Application Management Services Market Analysis, Size, and Forecast 2026-2030: North America (US, Canada, and Mexico), APAC (China, Japan, and India), Europe (Germany, UK, and France), Middle East and Africa (UAE, Saudi Arabia, and South Africa), South America (Brazil and Argentina), and Rest of World (ROW)

Application Management Services Market Analysis, Size, and Forecast 2026-2030:
North America (US, Canada, and Mexico), APAC (China, Japan, and India), Europe (Germany, UK, and France), Middle East and Africa (UAE, Saudi Arabia, and South Africa), South America (Brazil and Argentina), and Rest of World (ROW)

Published: Mar 2026 327 Pages SKU: IRTNTR43884

Market Overview at a Glance

$70.89 B
Market Opportunity
21.5%
CAGR 2025 - 2030
41.2%
North America Growth
$23.00 B
Discrete AMS segment 2024

Application Management Services Market Size 2026-2030

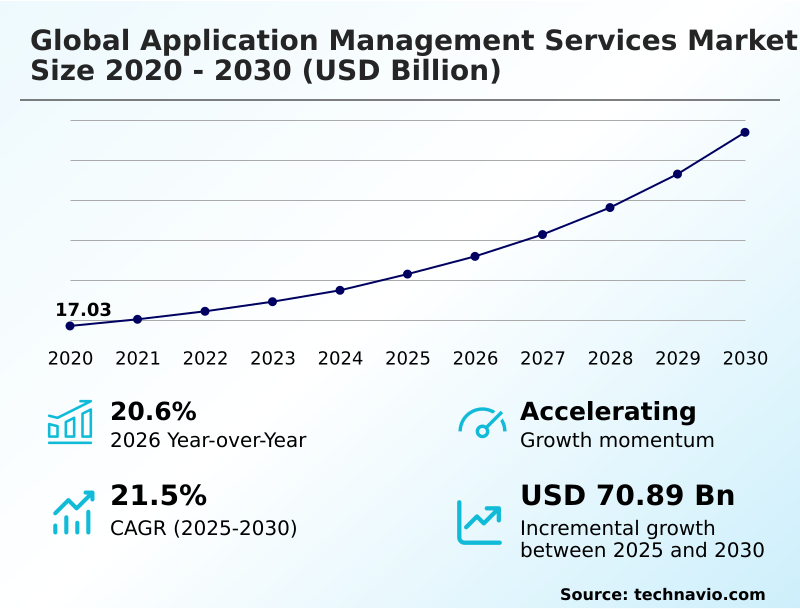
The application management services market size is valued to increase by USD 70.89 billion, at a CAGR of 21.5% from 2025 to 2030. Pervasive imperative of digital transformation and application modernization will drive the application management services market.

Major Market Trends & Insights

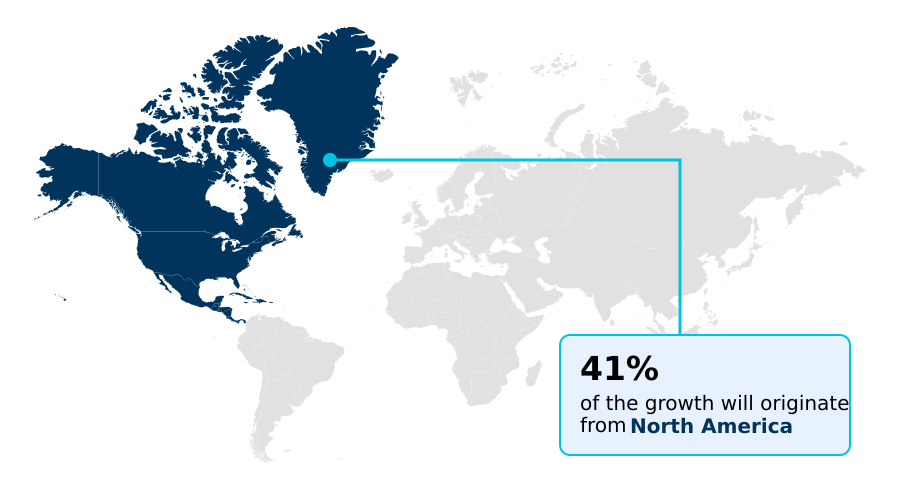
  • North America dominated the market and accounted for a 41.2% growth during the forecast period.
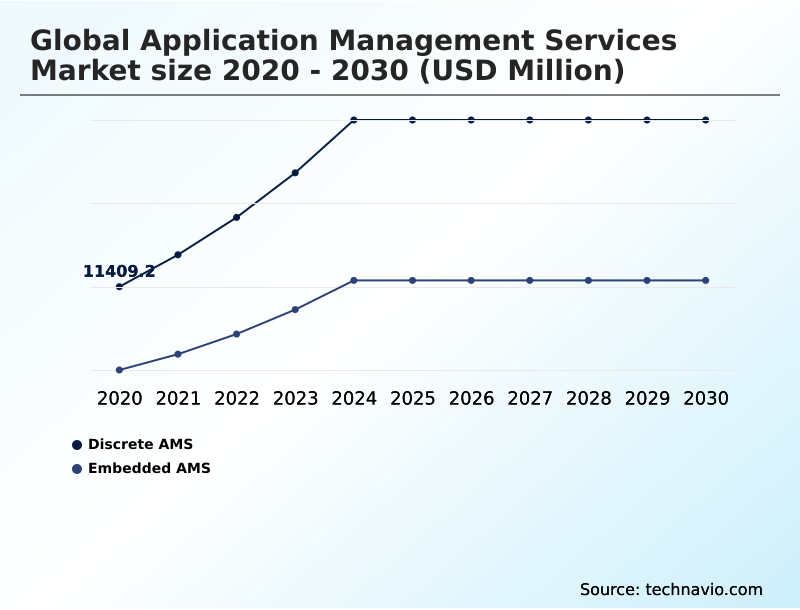
  • By Type - Discrete AMS segment was valued at USD 23.00 billion in 2024
  • By End-user - Small and medium enterprises segment accounted for the largest market revenue share in 2024

Market Size & Forecast

  • Market Opportunities: USD 96.81 billion
  • Market Future Opportunities: USD 70.89 billion
  • CAGR from 2025 to 2030 : 21.5%

Market Summary

  • The application management services market is defined by its role in governing the complete lifecycle of an organization's software portfolio. Beyond traditional break-fix support, it encompasses proactive monitoring, maintenance, and continuous enhancement to ensure optimal performance and security. A primary driver is the enterprise-wide pursuit of digital transformation, which necessitates the modernization of legacy applications that hinder agility.
  • For example, a global retail enterprise must ensure its e-commerce platform remains highly available and scalable during peak holiday seasons, a task that requires specialized expertise in cloud-native architectures and performance tuning. By outsourcing application management, the company can leverage a provider's established frameworks for cloud migration and DevOps methodologies.
  • This partnership allows the internal IT team to shift its focus from routine operational tasks to strategic, value-generating projects like developing new personalized customer experiences.
  • The market is also propelled by the need to bridge the widening technical skills gap, as managing a complex hybrid portfolio of on-premises, cloud, and SaaS applications demands a broad spectrum of expertise that is difficult to maintain in-house, making external service providers a critical enabler of business continuity and innovation.

What will be the Size of the Application Management Services Market during the forecast period?

Get Key Insights on Market Forecast (PDF) Request Free Sample

How is the Application Management Services Market Segmented?

The application management services industry research report provides comprehensive data (region-wise segment analysis), with forecasts and estimates in "USD million" for the period 2026-2030, as well as historical data from 2020-2024 for the following segments.

  • Type
    • Discrete AMS
    • Embedded AMS
  • End-user
    • Small and medium enterprises
    • Large enterprises
  • Deployment
    • Hosted
    • On-premises
  • Geography
    • North America
      • US
      • Canada
      • Mexico
    • APAC
      • China
      • Japan
      • India
    • Europe
      • Germany
      • UK
      • France
    • Middle East and Africa
      • UAE
      • Saudi Arabia
      • South Africa
    • South America
      • Brazil
      • Argentina
    • Rest of World (ROW)

By Type Insights

The discrete ams segment is estimated to witness significant growth during the forecast period.

The global application management services market segments by type, end-user, deployment, and geography. By type, the market includes Discrete AMS and Embedded AMS. The end-user segment comprises Small and Medium Enterprises and Large Enterprises.

Deployment is categorized into Hosted and On-premises. Geographically, the market is divided into North America, APAC, Europe, the Middle East and Africa, and South America. North America is the largest region, while APAC shows the fastest growth, driven by digitalization.

A key driver across segments is the adoption of DevOps methodology. For instance, a focus on application portfolio rationalization allows for strategic technical debt reduction. Providers use AI-driven application support services to manage complex hybrid IT environments effectively.

Utilizing proactive performance monitoring helps maintain service level agreement management, and software composition analysis is crucial for securing the application lifecycle in the cloud.

This approach to managing application portfolios has led to a 20% improvement in resource utilization for firms that adopt a product-centric delivery model.

Request Free Sample

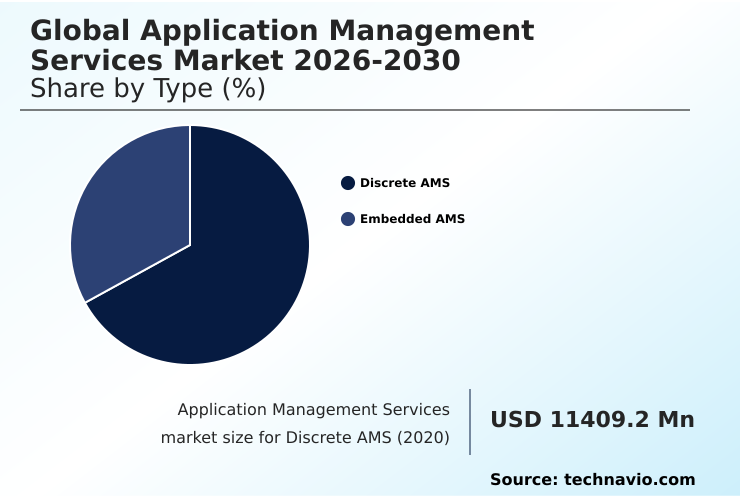
The Discrete AMS segment was valued at USD 23.00 billion in 2024 and showed a gradual increase during the forecast period.

Request Free Sample

Regional Analysis

North America is estimated to contribute 41.2% to the growth of the global market during the forecast period.Technavio’s analysts have elaborately explained the regional trends and drivers that shape the market during the forecast period.

See How Application Management Services Market Demand is Rising in North America Request Free Sample

The global application management services market is geographically dominated by North America, which accounts for over 41% of the market's incremental growth, driven by its mature digital infrastructure and focus on optimizing application portfolios.

This region excels in proactive issue resolution and has a high adoption rate of agile and DevOps practices. In contrast, the APAC region is the fastest-growing market, fueled by rapid economic expansion and widespread digitalization, particularly in China and India.

Europe remains a significant market, with a strong emphasis on regulatory compliance, where service providers help organizations maintain over 99% adherence to data protection mandates like GDPR. Key activities include application performance tuning and navigating complex hybrid IT environments.

The Middle East and Africa and South America are emerging markets, showing increasing demand for application modernization and cloud migration services to support their developing digital economies and enhance business agility across various sectors.

Market Dynamics

Our researchers analyzed the data with 2025 as the base year, along with the key drivers, trends, and challenges. A holistic analysis of drivers will help companies refine their marketing strategies to gain a competitive advantage.

  • Strategic decision-making in the application management services market is increasingly focused on long-term value and operational resilience. A primary consideration is managing the application lifecycle in the cloud, which involves more than just migration; it requires continuous optimization and governance.
  • Organizations are adopting AI-driven application support services to move from reactive to predictive maintenance, a shift that is critical for business continuity. A key goal for CFOs is optimizing application total cost of ownership, which involves a careful analysis of both direct and indirect expenses over the application's lifespan.
  • Implementing DevSecOps for enterprise application security is no longer optional but a baseline requirement to mitigate threats in an increasingly complex digital landscape. Furthermore, a well-defined application modernization for digital transformation strategy is essential for businesses looking to maintain a competitive edge. This is often coupled with a comprehensive legacy application portfolio management strategy to systematically reduce technical debt.
  • The effectiveness of these initiatives is measured by clear service level agreements in AMS. For instance, companies that effectively implement a strategy for managing enterprise application integration complexity report a twofold improvement in their ability to launch new integrated services compared to those without a formal approach. This demonstrates the tangible link between expert application management and business agility.
  • The focus extends to ensuring high availability for critical business applications and providing proactive IT support for business process continuity, making AMS a cornerstone of modern enterprise operations.

What are the key market drivers leading to the rise in the adoption of Application Management Services Industry?

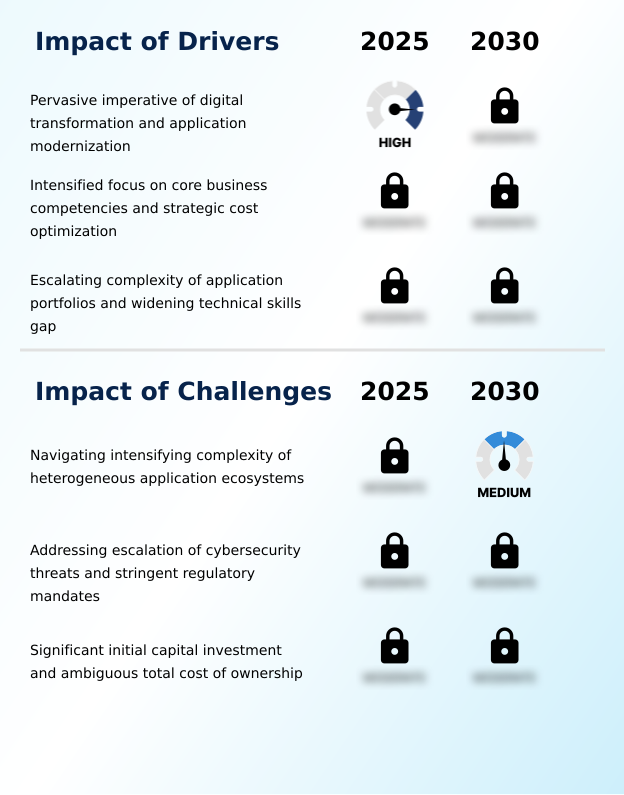
  • The pervasive imperative for digital transformation and application modernization is a key driver for market growth.

  • The primary driver for the application management services market is the enterprise-wide imperative for digital transformation, compelling organizations to pursue legacy system modernization.
  • By engaging service providers, companies can reduce technical debt and re-architect monolithic systems into agile microservices architectures, a process that internal teams often lack the specialized skills to manage.
  • This strategic outsourcing allows businesses to reallocate up to 35% of their internal IT talent toward value-generating innovation. Another key driver is the pursuit of cost optimization through a predictable operational expenditure model, which leverages a provider's economies of scale.
  • The widening technical skills gap further fuels demand, as managing complex hybrid IT environments with container orchestration and multi-cloud strategies requires expertise that is scarce and expensive to hire, making application portfolio rationalization through a partner an efficient solution.

What are the market trends shaping the Application Management Services Industry?

  • The ascendancy of hyperautomation and artificial intelligence for IT operations (AIOps) is a transformative trend. It is reshaping application management from reactive support to a proactive and predictive operational framework.

  • A transformative trend in the application management services market is the integration of hyperautomation and AI-Ops platforms. This shift from reactive to predictive operational frameworks is redefining service delivery, with automated root cause analysis improving issue resolution times by up to 45%.
  • Organizations are adopting platform engineering principles to build robust, self-service internal developer platforms, which has been shown to boost developer productivity by over 30%. This product-centric delivery model, supported by continuous integration and continuous delivery (CI/CD) pipelines, accelerates feature deployment.
  • Furthermore, the pervasive integration of security through DevSecOps methodologies is critical, embedding software composition analysis and other automated controls early in the lifecycle. This 'shift-left' approach significantly reduces remediation costs and enhances the overall security posture of applications under management.

What challenges does the Application Management Services Industry face during its growth?

  • Navigating the intensifying complexity of heterogeneous application ecosystems presents a key challenge to industry growth.

  • A formidable challenge in the application management services market is navigating the escalating complexity of heterogeneous application portfolios. These ecosystems, comprising legacy systems, cloud-native services, and SaaS platforms, create significant integration and governance hurdles, with integration failures accounting for nearly 50% of critical business disruptions.
  • The relentless pace of technological change requires providers to constantly adapt to new paradigms like serverless computing. Another critical challenge is the dual pressure of a sophisticated cybersecurity landscape and stringent regulatory mandates. Providers must embed proactive security measures and ensure compliance with rules like GDPR, which can increase project costs by 15% if not managed proactively.
  • Finally, the ambiguity surrounding the total cost of ownership, including high initial transition costs and unpredictable long-term fees, acts as a significant restraint on market adoption, particularly for small and medium-sized enterprises.

Exclusive Technavio Analysis on Customer Landscape

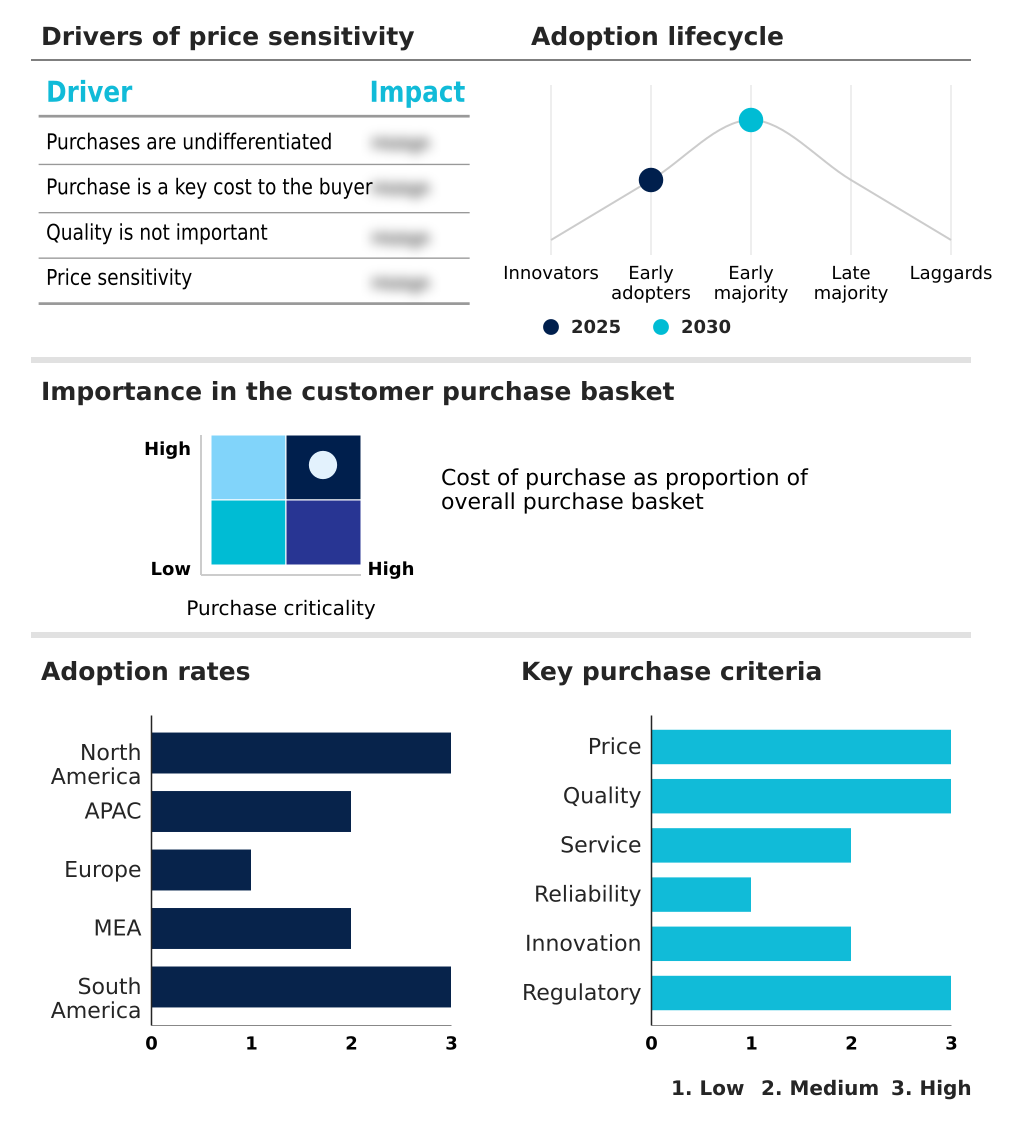
The application management services market forecasting report includes the adoption lifecycle of the market, covering from the innovator’s stage to the laggard’s stage. It focuses on adoption rates in different regions based on penetration. Furthermore, the application management services market report also includes key purchase criteria and drivers of price sensitivity to help companies evaluate and develop their market growth analysis strategies.

Customer Landscape of Application Management Services Industry

Competitive Landscape

Companies are implementing various strategies, such as strategic alliances, application management services market forecast, partnerships, mergers and acquisitions, geographical expansion, and product/service launches, to enhance their presence in the industry.

Accenture Plc - Providers deliver comprehensive application lifecycle governance, ensuring optimal performance, security, and alignment with strategic business goals through outsourced expertise.

The industry research and growth report includes detailed analyses of the competitive landscape of the market and information about key companies, including:

  • Accenture Plc
  • Atos SE
  • Capgemini SE
  • Cognizant Technology Solution
  • Deloitte Touche Tohmatsu Ltd.
  • DXC Technology Co.
  • Fujitsu Ltd.
  • HCL Technologies Ltd.
  • Hexaware Technologies Ltd.
  • IBM Corp.
  • Infosys Ltd.
  • LTIMindtree Ltd.
  • Mphasis Ltd.
  • NTT DATA Corp.
  • Oracle Corp.
  • SAP SE
  • ScienceSoft USA Corp.
  • Tata Consultancy Services
  • Unisys Corp.
  • Wipro Ltd.

Qualitative and quantitative analysis of companies has been conducted to help clients understand the wider business environment as well as the strengths and weaknesses of key industry players. Data is qualitatively analyzed to categorize companies as pure play, category-focused, industry-focused, and diversified; it is quantitatively analyzed to categorize companies as dominant, leading, strong, tentative, and weak.

Recent Development and News in Application management services market

  • In January 2025, IBM Corp. acquired Applications Software Technology to bolster its capabilities in Oracle Cloud transformation services, reflecting the strategic importance of cloud expertise in the North American market.
  • In February 2025, Infosys Ltd. announced a strategic partnership with Lufthansa to drive digital transformation within the aviation industry, focusing on modernizing its application landscape.
  • In May 2025, Amazon Web Services pledged an investment of over USD 4 billion to establish a new cloud region in Chile, significantly enhancing digital infrastructure and accelerating cloud-native application adoption in South America.
  • In October 2025, DXC Technology Co. launched Assure Broking Essentials, an AI-powered SaaS platform designed for the insurance brokerage industry, highlighting the trend toward industry-specific, technology-driven solutions.

Dive into Technavio’s robust research methodology, blending expert interviews, extensive data synthesis, and validated models for unparalleled Application Management Services Market insights. See full methodology.

Market Scope
Page number 327
Base year 2025
Historic period 2020-2024
Forecast period 2026-2030
Growth momentum & CAGR Accelerate at a CAGR of 21.5%
Market growth 2026-2030 USD 70891.1 million
Market structure Fragmented
YoY growth 2025-2026(%) 20.6%
Key countries US, Canada, Mexico, China, Japan, India, Australia, South Korea, Indonesia, Germany, UK, France, Italy, Spain, The Netherlands, UAE, Saudi Arabia, South Africa, Israel, Egypt, Brazil, Argentina and Chile
Competitive landscape Leading Companies, Market Positioning of Companies, Competitive Strategies, and Industry Risks

Request Free Sample

Research Analyst Overview

  • The application management services market is fundamentally evolving from a cost-saving utility to a strategic enabler of business innovation. Central to this shift is the widespread adoption of legacy system modernization and application portfolio rationalization. Organizations are leveraging DevOps methodology and microservices architecture to dismantle monolithic structures, thereby reducing technical debt and enhancing agility.
  • Boardroom decisions are now directly influenced by the need for continuous integration and continuous delivery (CI/CD) to accelerate speed-to-market. For instance, companies embracing platform engineering have demonstrated a 40% faster rollout of new digital products. This is achieved through a product-centric delivery model, where AI-Ops platforms and container orchestration provide the foundation for resilient and scalable systems.
  • Service level agreement management has become more sophisticated, focusing on business outcomes rather than simple uptime metrics. The integration of software composition analysis into the development pipeline is a non-negotiable aspect of risk management, addressing vulnerabilities in open-source components proactively.
  • This holistic approach, combining proactive performance monitoring with a robust multi-cloud management strategy, is critical for navigating today's complex hybrid IT environment and unlocking true business value from technology investments.

What are the Key Data Covered in this Application Management Services Market Research and Growth Report?

  • What is the expected growth of the Application Management Services Market between 2026 and 2030?

    • USD 70.89 billion, at a CAGR of 21.5%

  • What segmentation does the market report cover?

    • The report is segmented by Type (Discrete AMS, and Embedded AMS), End-user (Small and medium enterprises, and Large enterprises), Deployment (Hosted, and On-premises) and Geography (North America, APAC, Europe, Middle East and Africa, South America)

  • Which regions are analyzed in the report?

    • North America, APAC, Europe, Middle East and Africa and South America

  • What are the key growth drivers and market challenges?

    • Pervasive imperative of digital transformation and application modernization, Navigating intensifying complexity of heterogeneous application ecosystems

  • Who are the major players in the Application Management Services Market?

    • Accenture Plc, Atos SE, Capgemini SE, Cognizant Technology Solution, Deloitte Touche Tohmatsu Ltd., DXC Technology Co., Fujitsu Ltd., HCL Technologies Ltd., Hexaware Technologies Ltd., IBM Corp., Infosys Ltd., LTIMindtree Ltd., Mphasis Ltd., NTT DATA Corp., Oracle Corp., SAP SE, ScienceSoft USA Corp., Tata Consultancy Services, Unisys Corp. and Wipro Ltd.

Market Research Insights

  • The market is undergoing a significant shift from tactical support to strategic, value-driven partnerships. Organizations are leveraging automated root cause analysis and integrating IT service management to enhance operational efficiency. This focus on total cost of ownership modeling and business process outsourcing allows for better resource allocation.
  • Adopting a product-centric delivery model, supported by robust platform engineering principles, has enabled companies to achieve an 18% improvement in aligning IT outputs with business goals. Furthermore, a multi-cloud management strategy is becoming standard, with firms reporting up to a 25% reduction in cloud spend through optimized governance and FinOps practices.
  • This evolution highlights a clear move toward agile, outcome-based engagements.

We can help! Our analysts can customize this application management services market research report to meet your requirements.

Get in touch

1. Executive Summary

1.1 Market overview

Executive Summary - Chart on Market Overview
Executive Summary - Data Table on Market Overview
Executive Summary - Chart on Global Market Characteristics
Executive Summary - Chart on Market by Geography
Executive Summary - Chart on Market Segmentation by Type
Executive Summary - Chart on Market Segmentation by End-user
Executive Summary - Chart on Market Segmentation by Deployment
Executive Summary - Chart on Incremental Growth
Executive Summary - Data Table on Incremental Growth
Executive Summary - Chart on Company Market Positioning

2. Technavio Analysis

2.1 Analysis of price sensitivity, lifecycle, customer purchase basket, adoption rates, and purchase criteria

2.2 Criticality of inputs and Factors of differentiation

Chart on Overview on criticality of inputs and factors of differentiation

2.3 Factors of disruption

Chart on Overview on factors of disruption

2.4 Impact of drivers and challenges

Chart on Impact of drivers and challenges in 2025 and 2030

3. Market Landscape

3.1 Market ecosystem

Chart on Parent Market
Data Table on - Parent Market

3.2 Market characteristics

Chart on Market characteristics analysis

3.3 Value chain analysis

Chart on Value chain analysis

4. Market Sizing

4.1 Market definition

Data Table on Offerings of companies included in the market definition

4.2 Market segment analysis

Market segments

4.3 Market size 2025

4.4 Market outlook: Forecast for 2025-2030

Chart on Global - Market size and forecast 2025-2030 ($ million)
Data Table on Global - Market size and forecast 2025-2030 ($ million)
Chart on Global Market: Year-over-year growth 2025-2030 (%)
Data Table on Global Market: Year-over-year growth 2025-2030 (%)

5. Historic Market Size

5.1 Global Application Management Services Market 2020 - 2024

Historic Market Size - Data Table on Global Application Management Services Market 2020 - 2024 ($ million)

5.2 Type segment analysis 2020 - 2024

Historic Market Size - Type Segment 2020 - 2024 ($ million)

5.3 End-user segment analysis 2020 - 2024

Historic Market Size - End-user Segment 2020 - 2024 ($ million)

5.4 Deployment segment analysis 2020 - 2024

Historic Market Size - Deployment Segment 2020 - 2024 ($ million)

5.5 Geography segment analysis 2020 - 2024

Historic Market Size - Geography Segment 2020 - 2024 ($ million)

5.6 Country segment analysis 2020 - 2024

Historic Market Size - Country Segment 2020 - 2024 ($ million)

6. Qualitative Analysis

6.1 The AI impact on global application management services market

7. Five Forces Analysis

7.1 Five forces summary

Five forces analysis - Comparison between 2025 and 2030

7.2 Bargaining power of buyers

Bargaining power of buyers - Impact of key factors 2025 and 2030

7.3 Bargaining power of suppliers

Bargaining power of suppliers - Impact of key factors in 2025 and 2030

7.4 Threat of new entrants

Threat of new entrants - Impact of key factors in 2025 and 2030

7.5 Threat of substitutes

Threat of substitutes - Impact of key factors in 2025 and 2030

7.6 Threat of rivalry

Threat of rivalry - Impact of key factors in 2025 and 2030

7.7 Market condition

Chart on Market condition - Five forces 2025 and 2030

8. Market Segmentation by Type

8.1 Market segments

Chart on Type - Market share 2025-2030 (%)
Data Table on Type - Market share 2025-2030 (%)

8.2 Comparison by Type

Chart on Comparison by Type
Data Table on Comparison by Type

8.3 Discrete AMS - Market size and forecast 2025-2030

Chart on Discrete AMS - Market size and forecast 2025-2030 ($ million)
Data Table on Discrete AMS - Market size and forecast 2025-2030 ($ million)
Chart on Discrete AMS - Year-over-year growth 2025-2030 (%)
Data Table on Discrete AMS - Year-over-year growth 2025-2030 (%)

8.4 Embedded AMS - Market size and forecast 2025-2030

Chart on Embedded AMS - Market size and forecast 2025-2030 ($ million)
Data Table on Embedded AMS - Market size and forecast 2025-2030 ($ million)
Chart on Embedded AMS - Year-over-year growth 2025-2030 (%)
Data Table on Embedded AMS - Year-over-year growth 2025-2030 (%)

8.5 Market opportunity by Type

Market opportunity by Type ($ million)
Data Table on Market opportunity by Type ($ million)

9. Market Segmentation by End-user

9.1 Market segments

Chart on End-user - Market share 2025-2030 (%)
Data Table on End-user - Market share 2025-2030 (%)

9.2 Comparison by End-user

Chart on Comparison by End-user
Data Table on Comparison by End-user

9.3 Small and medium enterprises - Market size and forecast 2025-2030

Chart on Small and medium enterprises - Market size and forecast 2025-2030 ($ million)
Data Table on Small and medium enterprises - Market size and forecast 2025-2030 ($ million)
Chart on Small and medium enterprises - Year-over-year growth 2025-2030 (%)
Data Table on Small and medium enterprises - Year-over-year growth 2025-2030 (%)

9.4 Large enterprises - Market size and forecast 2025-2030

Chart on Large enterprises - Market size and forecast 2025-2030 ($ million)
Data Table on Large enterprises - Market size and forecast 2025-2030 ($ million)
Chart on Large enterprises - Year-over-year growth 2025-2030 (%)
Data Table on Large enterprises - Year-over-year growth 2025-2030 (%)

9.5 Market opportunity by End-user

Market opportunity by End-user ($ million)
Data Table on Market opportunity by End-user ($ million)

10. Market Segmentation by Deployment

10.1 Market segments

Chart on Deployment - Market share 2025-2030 (%)
Data Table on Deployment - Market share 2025-2030 (%)

10.2 Comparison by Deployment

Chart on Comparison by Deployment
Data Table on Comparison by Deployment

10.3 Hosted - Market size and forecast 2025-2030

Chart on Hosted - Market size and forecast 2025-2030 ($ million)
Data Table on Hosted - Market size and forecast 2025-2030 ($ million)
Chart on Hosted - Year-over-year growth 2025-2030 (%)
Data Table on Hosted - Year-over-year growth 2025-2030 (%)

10.4 On-premises - Market size and forecast 2025-2030

Chart on On-premises - Market size and forecast 2025-2030 ($ million)
Data Table on On-premises - Market size and forecast 2025-2030 ($ million)
Chart on On-premises - Year-over-year growth 2025-2030 (%)
Data Table on On-premises - Year-over-year growth 2025-2030 (%)

10.5 Market opportunity by Deployment

Market opportunity by Deployment ($ million)
Data Table on Market opportunity by Deployment ($ million)

11. Customer Landscape

11.1 Customer landscape overview

Analysis of price sensitivity, lifecycle, customer purchase basket, adoption rates, and purchase criteria

12. Geographic Landscape

12.1 Geographic segmentation

Chart on Market share by geography 2025-2030 (%)
Data Table on Market share by geography 2025-2030 (%)

12.2 Geographic comparison

Chart on Geographic comparison
Data Table on Geographic comparison

12.3 North America - Market size and forecast 2025-2030

Chart on North America - Market size and forecast 2025-2030 ($ million)
Data Table on North America - Market size and forecast 2025-2030 ($ million)
Chart on North America - Year-over-year growth 2025-2030 (%)
Data Table on North America - Year-over-year growth 2025-2030 (%)
Chart on Regional Comparison - North America
Data Table on Regional Comparison - North America

12.3.1 US - Market size and forecast 2025-2030

Chart on US - Market size and forecast 2025-2030 ($ million)
Data Table on US - Market size and forecast 2025-2030 ($ million)
Chart on US - Year-over-year growth 2025-2030 (%)
Data Table on US - Year-over-year growth 2025-2030 (%)

12.3.2 Canada - Market size and forecast 2025-2030

Chart on Canada - Market size and forecast 2025-2030 ($ million)
Data Table on Canada - Market size and forecast 2025-2030 ($ million)
Chart on Canada - Year-over-year growth 2025-2030 (%)
Data Table on Canada - Year-over-year growth 2025-2030 (%)

12.3.3 Mexico - Market size and forecast 2025-2030

Chart on Mexico - Market size and forecast 2025-2030 ($ million)
Data Table on Mexico - Market size and forecast 2025-2030 ($ million)
Chart on Mexico - Year-over-year growth 2025-2030 (%)
Data Table on Mexico - Year-over-year growth 2025-2030 (%)

12.4 APAC - Market size and forecast 2025-2030

Chart on APAC - Market size and forecast 2025-2030 ($ million)
Data Table on APAC - Market size and forecast 2025-2030 ($ million)
Chart on APAC - Year-over-year growth 2025-2030 (%)
Data Table on APAC - Year-over-year growth 2025-2030 (%)
Chart on Regional Comparison - APAC
Data Table on Regional Comparison - APAC

12.4.1 China - Market size and forecast 2025-2030

Chart on China - Market size and forecast 2025-2030 ($ million)
Data Table on China - Market size and forecast 2025-2030 ($ million)
Chart on China - Year-over-year growth 2025-2030 (%)
Data Table on China - Year-over-year growth 2025-2030 (%)

12.4.2 Japan - Market size and forecast 2025-2030

Chart on Japan - Market size and forecast 2025-2030 ($ million)
Data Table on Japan - Market size and forecast 2025-2030 ($ million)
Chart on Japan - Year-over-year growth 2025-2030 (%)
Data Table on Japan - Year-over-year growth 2025-2030 (%)

12.4.3 India - Market size and forecast 2025-2030

Chart on India - Market size and forecast 2025-2030 ($ million)
Data Table on India - Market size and forecast 2025-2030 ($ million)
Chart on India - Year-over-year growth 2025-2030 (%)
Data Table on India - Year-over-year growth 2025-2030 (%)

12.4.4 Australia - Market size and forecast 2025-2030

Chart on Australia - Market size and forecast 2025-2030 ($ million)
Data Table on Australia - Market size and forecast 2025-2030 ($ million)
Chart on Australia - Year-over-year growth 2025-2030 (%)
Data Table on Australia - Year-over-year growth 2025-2030 (%)

12.4.5 South Korea - Market size and forecast 2025-2030

Chart on South Korea - Market size and forecast 2025-2030 ($ million)
Data Table on South Korea - Market size and forecast 2025-2030 ($ million)
Chart on South Korea - Year-over-year growth 2025-2030 (%)
Data Table on South Korea - Year-over-year growth 2025-2030 (%)

12.4.6 Indonesia - Market size and forecast 2025-2030

Chart on Indonesia - Market size and forecast 2025-2030 ($ million)
Data Table on Indonesia - Market size and forecast 2025-2030 ($ million)
Chart on Indonesia - Year-over-year growth 2025-2030 (%)
Data Table on Indonesia - Year-over-year growth 2025-2030 (%)

12.5 Europe - Market size and forecast 2025-2030

Chart on Europe - Market size and forecast 2025-2030 ($ million)
Data Table on Europe - Market size and forecast 2025-2030 ($ million)
Chart on Europe - Year-over-year growth 2025-2030 (%)
Data Table on Europe - Year-over-year growth 2025-2030 (%)
Chart on Regional Comparison - Europe
Data Table on Regional Comparison - Europe

12.5.1 Germany - Market size and forecast 2025-2030

Chart on Germany - Market size and forecast 2025-2030 ($ million)
Data Table on Germany - Market size and forecast 2025-2030 ($ million)
Chart on Germany - Year-over-year growth 2025-2030 (%)
Data Table on Germany - Year-over-year growth 2025-2030 (%)

12.5.2 UK - Market size and forecast 2025-2030

Chart on UK - Market size and forecast 2025-2030 ($ million)
Data Table on UK - Market size and forecast 2025-2030 ($ million)
Chart on UK - Year-over-year growth 2025-2030 (%)
Data Table on UK - Year-over-year growth 2025-2030 (%)

12.5.3 France - Market size and forecast 2025-2030

Chart on France - Market size and forecast 2025-2030 ($ million)
Data Table on France - Market size and forecast 2025-2030 ($ million)
Chart on France - Year-over-year growth 2025-2030 (%)
Data Table on France - Year-over-year growth 2025-2030 (%)

12.5.4 Italy - Market size and forecast 2025-2030

Chart on Italy - Market size and forecast 2025-2030 ($ million)
Data Table on Italy - Market size and forecast 2025-2030 ($ million)
Chart on Italy - Year-over-year growth 2025-2030 (%)
Data Table on Italy - Year-over-year growth 2025-2030 (%)

12.5.5 Spain - Market size and forecast 2025-2030

Chart on Spain - Market size and forecast 2025-2030 ($ million)
Data Table on Spain - Market size and forecast 2025-2030 ($ million)
Chart on Spain - Year-over-year growth 2025-2030 (%)
Data Table on Spain - Year-over-year growth 2025-2030 (%)

12.5.6 The Netherlands - Market size and forecast 2025-2030

Chart on The Netherlands - Market size and forecast 2025-2030 ($ million)
Data Table on The Netherlands - Market size and forecast 2025-2030 ($ million)
Chart on The Netherlands - Year-over-year growth 2025-2030 (%)
Data Table on The Netherlands - Year-over-year growth 2025-2030 (%)

12.6 Middle East and Africa - Market size and forecast 2025-2030

Chart on Middle East and Africa - Market size and forecast 2025-2030 ($ million)
Data Table on Middle East and Africa - Market size and forecast 2025-2030 ($ million)
Chart on Middle East and Africa - Year-over-year growth 2025-2030 (%)
Data Table on Middle East and Africa - Year-over-year growth 2025-2030 (%)
Chart on Regional Comparison - Middle East and Africa
Data Table on Regional Comparison - Middle East and Africa

12.6.1 UAE - Market size and forecast 2025-2030

Chart on UAE - Market size and forecast 2025-2030 ($ million)
Data Table on UAE - Market size and forecast 2025-2030 ($ million)
Chart on UAE - Year-over-year growth 2025-2030 (%)
Data Table on UAE - Year-over-year growth 2025-2030 (%)

12.6.2 Saudi Arabia - Market size and forecast 2025-2030

Chart on Saudi Arabia - Market size and forecast 2025-2030 ($ million)
Data Table on Saudi Arabia - Market size and forecast 2025-2030 ($ million)
Chart on Saudi Arabia - Year-over-year growth 2025-2030 (%)
Data Table on Saudi Arabia - Year-over-year growth 2025-2030 (%)

12.6.3 South Africa - Market size and forecast 2025-2030

Chart on South Africa - Market size and forecast 2025-2030 ($ million)
Data Table on South Africa - Market size and forecast 2025-2030 ($ million)
Chart on South Africa - Year-over-year growth 2025-2030 (%)
Data Table on South Africa - Year-over-year growth 2025-2030 (%)

12.6.4 Israel - Market size and forecast 2025-2030

Chart on Israel - Market size and forecast 2025-2030 ($ million)
Data Table on Israel - Market size and forecast 2025-2030 ($ million)
Chart on Israel - Year-over-year growth 2025-2030 (%)
Data Table on Israel - Year-over-year growth 2025-2030 (%)

12.6.5 Egypt - Market size and forecast 2025-2030

Chart on Egypt - Market size and forecast 2025-2030 ($ million)
Data Table on Egypt - Market size and forecast 2025-2030 ($ million)
Chart on Egypt - Year-over-year growth 2025-2030 (%)
Data Table on Egypt - Year-over-year growth 2025-2030 (%)

12.7 South America - Market size and forecast 2025-2030

Chart on South America - Market size and forecast 2025-2030 ($ million)
Data Table on South America - Market size and forecast 2025-2030 ($ million)
Chart on South America - Year-over-year growth 2025-2030 (%)
Data Table on South America - Year-over-year growth 2025-2030 (%)
Chart on Regional Comparison - South America
Data Table on Regional Comparison - South America

12.7.1 Brazil - Market size and forecast 2025-2030

Chart on Brazil - Market size and forecast 2025-2030 ($ million)
Data Table on Brazil - Market size and forecast 2025-2030 ($ million)
Chart on Brazil - Year-over-year growth 2025-2030 (%)
Data Table on Brazil - Year-over-year growth 2025-2030 (%)

12.7.2 Argentina - Market size and forecast 2025-2030

Chart on Argentina - Market size and forecast 2025-2030 ($ million)
Data Table on Argentina - Market size and forecast 2025-2030 ($ million)
Chart on Argentina - Year-over-year growth 2025-2030 (%)
Data Table on Argentina - Year-over-year growth 2025-2030 (%)

12.7.3 Chile - Market size and forecast 2025-2030

Chart on Chile - Market size and forecast 2025-2030 ($ million)
Data Table on Chile - Market size and forecast 2025-2030 ($ million)
Chart on Chile - Year-over-year growth 2025-2030 (%)
Data Table on Chile - Year-over-year growth 2025-2030 (%)

12.8 Market opportunity by geography

Market opportunity by geography ($ million)
Data Tables on Market opportunity by geography ($ million)

13. Drivers, Challenges, and Opportunity

13.1 Market drivers

Pervasive imperative of digital transformation and application modernization
Intensified focus on core business competencies and strategic cost optimization
Escalating complexity of application portfolios and widening technical skills gap

13.2 Market challenges

Navigating intensifying complexity of heterogeneous application ecosystems
Addressing escalation of cybersecurity threats and stringent regulatory mandates
Significant initial capital investment and ambiguous total cost of ownership

13.3 Impact of drivers and challenges

Impact of drivers and challenges in 2025 and 2030

13.4 Market opportunities

Ascendancy of hyperautomation and artificial intelligence for IT operations (AIOps)
Strategic shift towards platform engineering and product-centric delivery models
Pervasive integration of security through DevSecOps methodologies

14. Competitive Landscape

14.1 Overview

14.2

Overview on criticality of inputs and factors of differentiation

14.3 Landscape disruption

Overview on factors of disruption

14.4 Industry risks

Impact of key risks on business

15. Competitive Analysis

15.1 Companies profiled

Companies covered

15.2 Company ranking index

15.3 Market positioning of companies

Matrix on companies position and classification

15.4 Accenture Plc

Accenture Plc - Overview
Accenture Plc - Business segments
Accenture Plc - Key news
Accenture Plc - Key offerings
Accenture Plc - Segment focus
SWOT

15.5 Atos SE

Atos SE - Overview
Atos SE - Business segments
Atos SE - Key news
Atos SE - Key offerings
Atos SE - Segment focus
SWOT

15.6 Capgemini SE

Capgemini SE - Overview
Capgemini SE - Business segments
Capgemini SE - Key news
Capgemini SE - Key offerings
Capgemini SE - Segment focus
SWOT

15.7 Cognizant Technology Solution

Cognizant Technology Solution - Overview
Cognizant Technology Solution - Business segments
Cognizant Technology Solution - Key news
Cognizant Technology Solution - Key offerings
Cognizant Technology Solution - Segment focus
SWOT

15.8 Deloitte Touche Tohmatsu Ltd.

Deloitte Touche Tohmatsu Ltd. - Overview
Deloitte Touche Tohmatsu Ltd. - Business segments
Deloitte Touche Tohmatsu Ltd. - Key offerings
Deloitte Touche Tohmatsu Ltd. - Segment focus
SWOT

15.9 DXC Technology Co.

DXC Technology Co. - Overview
DXC Technology Co. - Business segments
DXC Technology Co. - Key news
DXC Technology Co. - Key offerings
DXC Technology Co. - Segment focus
SWOT

15.10 Fujitsu Ltd.

Fujitsu Ltd. - Overview
Fujitsu Ltd. - Business segments
Fujitsu Ltd. - Key news
Fujitsu Ltd. - Key offerings
Fujitsu Ltd. - Segment focus
SWOT

15.11 IBM Corp.

IBM Corp. - Overview
IBM Corp. - Business segments
IBM Corp. - Key news
IBM Corp. - Key offerings
IBM Corp. - Segment focus
SWOT

15.12 Infosys Ltd.

Infosys Ltd. - Overview
Infosys Ltd. - Business segments
Infosys Ltd. - Key news
Infosys Ltd. - Key offerings
Infosys Ltd. - Segment focus
SWOT

15.13 LTIMindtree Ltd.

LTIMindtree Ltd. - Overview
LTIMindtree Ltd. - Product / Service
LTIMindtree Ltd. - Key offerings
SWOT

15.14 NTT DATA Corp.

NTT DATA Corp. - Overview
NTT DATA Corp. - Business segments
NTT DATA Corp. - Key news
NTT DATA Corp. - Key offerings
NTT DATA Corp. - Segment focus
SWOT

15.15 Oracle Corp.

Oracle Corp. - Overview
Oracle Corp. - Business segments
Oracle Corp. - Key news
Oracle Corp. - Key offerings
Oracle Corp. - Segment focus
SWOT

15.16 SAP SE

SAP SE - Overview
SAP SE - Business segments
SAP SE - Key news
SAP SE - Key offerings
SAP SE - Segment focus
SWOT

15.17 Tata Consultancy Services

Tata Consultancy Services - Overview
Tata Consultancy Services - Business segments
Tata Consultancy Services - Key news
Tata Consultancy Services - Key offerings
Tata Consultancy Services - Segment focus
SWOT

15.18 Wipro Ltd.

Wipro Ltd. - Overview
Wipro Ltd. - Business segments
Wipro Ltd. - Key news
Wipro Ltd. - Key offerings
Wipro Ltd. - Segment focus
SWOT

16. Appendix

16.1 Scope of the report

Market definition
Objectives
Notes and caveats

16.2 Inclusions and exclusions checklist

Inclusions checklist
Exclusions checklist

16.3 Currency conversion rates for US$

16.4 Research methodology

16.5 Data procurement

Information sources

16.6 Data validation

16.7 Validation techniques employed for market sizing

16.8 Data synthesis

16.9 360 degree market analysis

16.10 List of abbreviations

Research Methodology

Technavio presents a detailed picture of the market by way of study, synthesis, and summation of data from multiple sources. The analysts have presented the various facets of the market with a particular focus on identifying the key industry influencers. The data thus presented is comprehensive, reliable, and the result of extensive research, both primary and secondary.

INFORMATION SOURCES

Primary sources

  • Manufacturers and suppliers
  • Channel partners
  • Industry experts
  • Strategic decision makers

Secondary sources

  • Industry journals and periodicals
  • Government data
  • Financial reports of key industry players
  • Historical data
  • Press releases

DATA ANALYSIS

Data Synthesis

  • Collation of data
  • Estimation of key figures
  • Analysis of derived insights

Data Validation

  • Triangulation with data models
  • Reference against proprietary databases
  • Corroboration with industry experts

REPORT WRITING

Qualitative

  • Market drivers
  • Market challenges
  • Market trends
  • Five forces analysis

Quantitative

  • Market size and forecast
  • Market segmentation
  • Geographical insights
  • Competitive landscape

Interested in this report?

Get your sample now to see our research methodology and insights!

Download Now

Frequently Asked Questions

Application Management Services market growth will increase by USD 70891.1 million during 2026-2030.

The Application Management Services market is expected to grow at a CAGR of 21.5% during 2026-2030.

Application Management Services market is segmented by Type (Discrete AMS, Embedded AMS) End-user (Small and medium enterprises, Large enterprises) Deployment (Hosted, On-premises)

Accenture Plc, Atos SE, Capgemini SE, Cognizant Technology Solution, Deloitte Touche Tohmatsu Ltd., DXC Technology Co., Fujitsu Ltd., HCL Technologies Ltd., Hexaware Technologies Ltd., IBM Corp., Infosys Ltd., LTIMindtree Ltd., Mphasis Ltd., NTT DATA Corp., Oracle Corp., SAP SE, ScienceSoft USA Corp., Tata Consultancy Services, Unisys Corp., Wipro Ltd. are a few of the key vendors in the Application Management Services market.

North America will register the highest growth rate of 41.2% among the other regions. Therefore, the Application Management Services market in North America is expected to garner significant business opportunities for the vendors during the forecast period.

US, Canada, Mexico, China, Japan, India, Australia, South Korea, Indonesia, Germany, UK, France, Italy, Spain, The Netherlands, UAE, Saudi Arabia, South Africa, Israel, Egypt, Brazil, Argentina, Chile

  • Pervasive imperative of digital transformation and application modernization is the driving factor this market.

The Application Management Services market vendors should focus on grabbing business opportunities from the Type segment as it accounted for the largest market share in the base year.
RIA - Research AI Assistant
Ask RIA