Application Modernization Services Market Analysis, Size, and Forecast 2026-2030: North America (US, Canada, and Mexico), Europe (Germany, UK, and France), APAC (China, India, and Japan), South America (Brazil, Argentina, and Colombia), Middle East and Africa (UAE, Saudi Arabia, and South Africa), and Rest of World (ROW)

Application Modernization Services Market Analysis, Size, and Forecast 2026-2030:
North America (US, Canada, and Mexico), Europe (Germany, UK, and France), APAC (China, India, and Japan), South America (Brazil, Argentina, and Colombia), Middle East and Africa (UAE, Saudi Arabia, and South Africa), and Rest of World (ROW)

Published: Mar 2026 307 Pages SKU: IRTNTR81277

Market Overview at a Glance

$24.97 B
Market Opportunity
16.2%
CAGR 2025 - 2030
38.6%
North America Growth
$13.64 B
Cloud based segment 2024

Application Modernization Services Market Size 2026-2030

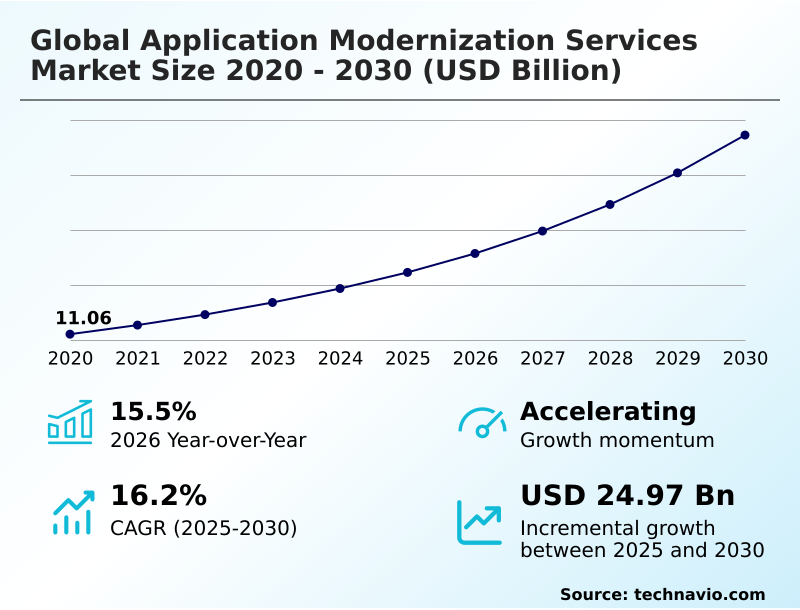
The application modernization services market size is valued to increase by USD 24.97 billion, at a CAGR of 16.2% from 2025 to 2030. Integration of generative AI into legacy frameworks will drive the application modernization services market.

Major Market Trends & Insights

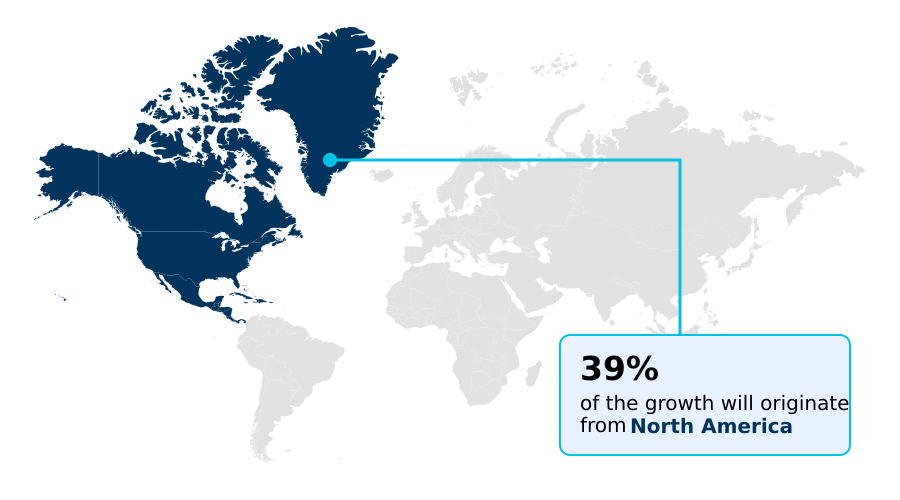
  • North America dominated the market and accounted for a 38.6% growth during the forecast period.
  • By Deployment - Cloud based segment was valued at USD 13.64 billion in 2024
  • By Business Segment - Large enterprises segment accounted for the largest market revenue share in 2024

Market Size & Forecast

  • Market Opportunities: USD 36.20 billion
  • Market Future Opportunities: USD 24.97 billion
  • CAGR from 2025 to 2030 : 16.2%

Market Summary

  • The application modernization services market is undergoing a significant expansion as businesses pursue a digital transformation journey to replace outdated systems with agile, high-performance architectures. This shift is driven by the need for a cloud-native transformation to leverage advanced technologies.
  • Key trends include the transition from monolithic to microservices, the adoption of a containerization strategy, and the use of serverless computing architecture to enhance scalability. A major driver is the strategic imperative for technical debt reduction and strengthening software supply chain security, as legacy systems are often vulnerable.
  • However, organizations face challenges such as the it skills gap mitigation and the complexities of data integrity management during mainframe migration. For instance, a global logistics firm might undergo enterprise resource planning modernization to improve supply chain visibility improvement, enabling it to respond more effectively to market demands.
  • This transformation, involving agile development methodologies and devops integration, is a fundamental business necessity for achieving a resilient software architecture.

What will be the Size of the Application Modernization Services Market during the forecast period?

Get Key Insights on Market Forecast (PDF) Request Free Sample

How is the Application Modernization Services Market Segmented?

The application modernization services industry research report provides comprehensive data (region-wise segment analysis), with forecasts and estimates in "USD million" for the period 2026-2030, as well as historical data from 2020-2024 for the following segments.

  • Deployment
    • Cloud based
    • On premises
  • Business segment
    • Large enterprises
    • Small and medium enterprises
  • End-user
    • BFSI
    • Retail and e-commerce
    • IT and telecom
    • Manufacturing
    • Others
  • Geography
    • North America
      • US
      • Canada
      • Mexico
    • Europe
      • Germany
      • UK
      • France
    • APAC
      • China
      • India
      • Japan
    • South America
      • Brazil
      • Argentina
      • Colombia
    • Middle East and Africa
      • UAE
      • Saudi Arabia
      • South Africa
    • Rest of World (ROW)

By Deployment Insights

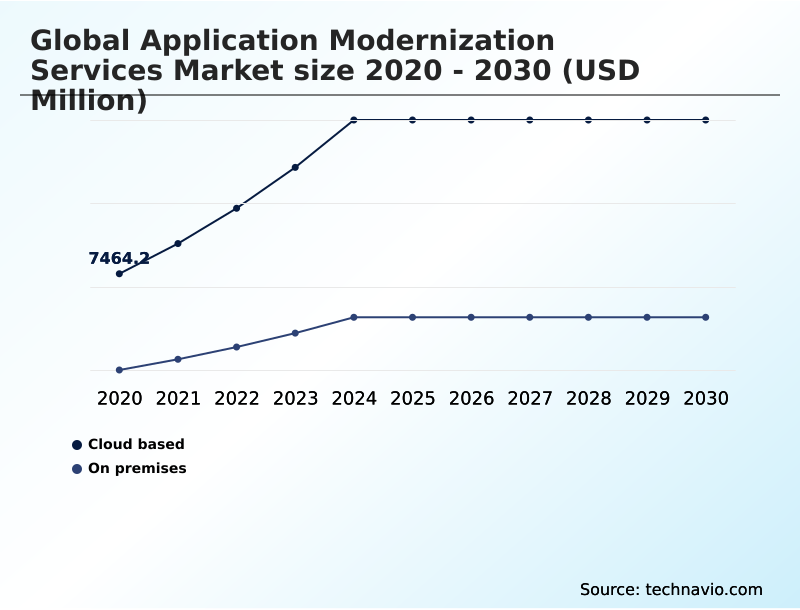
The cloud based segment is estimated to witness significant growth during the forecast period.

The cloud-based segment is defined by a strategic shift from capital expenditure vs operational expenditure models, driving organizations toward a complete cloud-native transformation.

This approach prioritizes the adoption of serverless computing architecture and other serverless models to enhance IT operational efficiency and build a resilient software architecture.

The modernization journey involves legacy system reengineering and significant IT infrastructure upgrades to manage a hybrid cloud environment effectively. A key focus is on technical debt reduction and application portfolio rationalization, which minimizes legacy system maintenance costs.

This transition is critical for business continuity planning, as it avoids vendor lock-in and improves return on investment, with some firms reporting a 25% decrease in deployment failures post-migration.

Request Free Sample

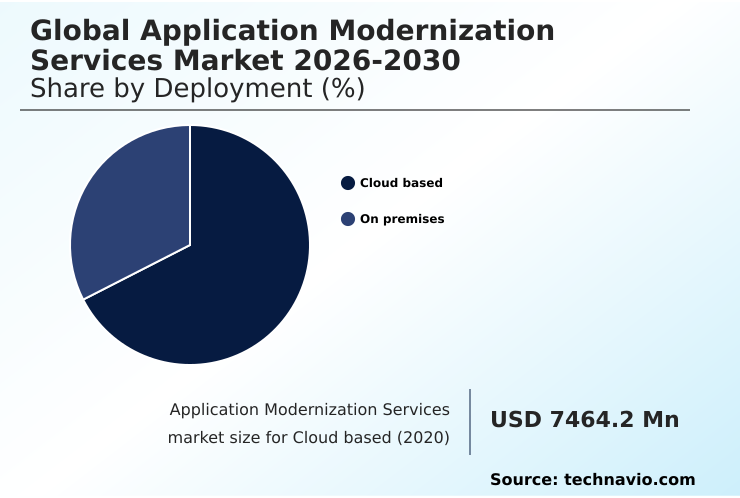
The Cloud based segment was valued at USD 13.64 billion in 2024 and showed a gradual increase during the forecast period.

Request Free Sample

Regional Analysis

North America is estimated to contribute 38.6% to the growth of the global market during the forecast period.Technavio’s analysts have elaborately explained the regional trends and drivers that shape the market during the forecast period.

See How Application Modernization Services Market Demand is Rising in North America Request Free Sample

The geographic landscape is shaped by varying paces of digital transformation journey, with mature markets focusing on advanced legacy replatforming and cloud-native application development. In contrast, emerging regions prioritize foundational IT infrastructure consulting and enterprise resource planning modernization.

The transition to cloud-native environments and the adoption of hybrid cloud strategies are common goals, enabling the use of real-time data analytics. Modernization efforts in critical sectors like healthcare EHR modernization and telecom network virtualization are widespread.

In North America, modernization of energy grid management software has led to a 15% improvement in grid stability.

The use of a software-defined data center and robust enterprise architecture planning are key to supporting these complex upgrades, including aerospace flight systems upgrades.

Market Dynamics

Our researchers analyzed the data with 2025 as the base year, along with the key drivers, trends, and challenges. A holistic analysis of drivers will help companies refine their marketing strategies to gain a competitive advantage.

  • Enterprises are increasingly evaluating the cost of legacy system maintenance against the long-term benefits of microservices architecture. Key decisions revolve around how to modernize mainframe applications, a process fraught with challenges in large scale migration. A critical first step is understanding the risks of application modernization projects and choosing a cloud modernization partner with proven expertise.
  • The rise of generative AI in code translation is lowering barriers, but a clear strategy for moving from on-premises to cloud is essential. The debate between a cloud native vs lift and shift approach depends on business objectives, with the former offering greater agility.
  • Modernizing applications for digital sovereignty has become non-negotiable for regulated industries, forcing them to implement zero trust security in legacy systems. Measuring ROI of application modernization is now more sophisticated, moving beyond simple cost savings.
  • For instance, in application modernization for financial services, success is also measured by a reduction in compliance-related incidents, with modernized platforms showing a 50% decrease in such events compared to their legacy counterparts. The impact of technical debt on business is well-documented, making application modernization best practices and integrating AI with legacy systems crucial.
  • These services are no longer just for large corporations; application modernization services for smes are a growing segment. The role of devops in modernization, ensuring data integrity during cloud migration, and securing the software supply chain are all integral to a successful transformation.

What are the key market drivers leading to the rise in the adoption of Application Modernization Services Industry?

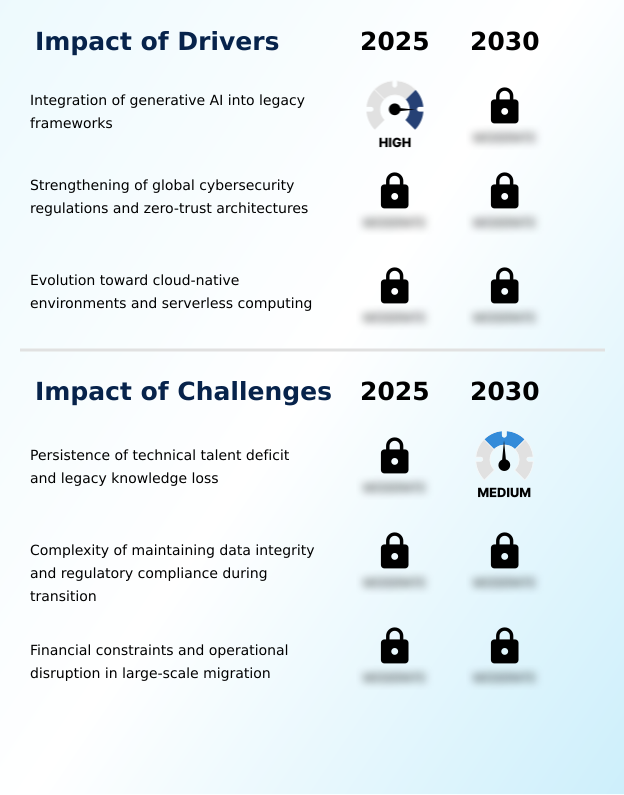
  • The integration of generative AI into legacy frameworks is a key market driver, compelling enterprises to modernize their software stacks to remain competitive.

  • Key market drivers include the widespread adoption of a containerization strategy and a cohesive multi-cloud strategy for enhanced flexibility. Enterprises are increasingly using AI-powered automation for mainframe migration and implementing multi-cloud managed services to streamline operations.
  • The focus on a robust cybersecurity resilience framework is paramount, with DevOps integration and zero-trust security architecture becoming standard for mitigating risks in software supply chain security.
  • The benefits of container orchestration are clear, as it aids in cloud migration risk management and provides effective disaster recovery solutions.
  • This approach improves supply chain visibility, with early adopters reporting up to a 15% reduction in stock-out incidents, and ensures better IT service delivery while addressing regulatory compliance challenges.

What are the market trends shaping the Application Modernization Services Industry?

  • The proliferation of generative AI in automated code conversion is a significant market trend, accelerating development cycles and transforming how organizations approach legacy system modernization.

  • The market is witnessing a major trend in the use of generative AI code generation for automated code conversion, accelerating the shift from monolithic to microservices. This automated refactoring supports agile development methodologies and API-first design, enabling businesses to enhance customer experience.
  • The adoption of low-code development platforms is also on the rise, addressing the IT talent deficit impact by allowing for faster development cycles. In e-commerce, the move toward a headless commerce architecture is gaining traction, with implementations showing a 30% improvement in page load times.
  • This evolution requires effective change management in IT projects and the integration of application performance monitoring tools to facilitate data-driven decision making and support edge computing integration.

What challenges does the Application Modernization Services Industry face during its growth?

  • The persistence of a technical talent deficit, coupled with the loss of legacy knowledge, presents a significant challenge to the growth of the application modernization services market.

  • A primary challenge involves the complexity of legacy code refactoring and maintaining data integrity management during the transition to a microservices-based architecture. Ensuring data lineage requirements and cyber resilience act compliance adds significant overhead. Organizations must undertake business process reengineering and application portfolio optimization to manage these transformations effectively, with a growing focus on green computing metrics to address sustainability.
  • The necessity for data sovereignty compliance often complicates digital platform integration, especially in financial services modernization and public sector digital transformation. Managing IT budget optimization while mitigating the IT skills gap and updating manufacturing execution systems remains a delicate balancing act for many firms. Projects often see a 20% budget overrun due to unforeseen complexities.

Exclusive Technavio Analysis on Customer Landscape

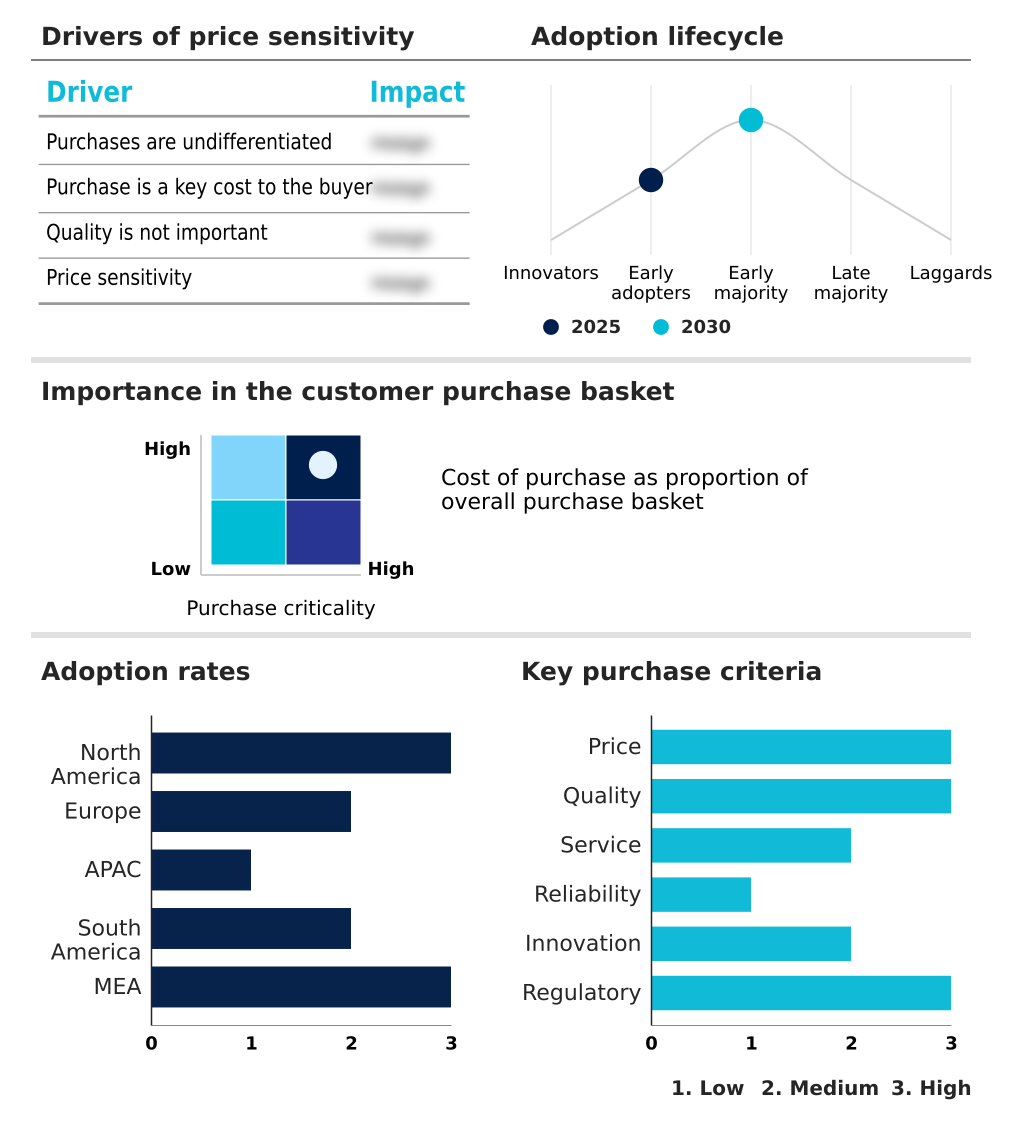
The application modernization services market forecasting report includes the adoption lifecycle of the market, covering from the innovator’s stage to the laggard’s stage. It focuses on adoption rates in different regions based on penetration. Furthermore, the application modernization services market report also includes key purchase criteria and drivers of price sensitivity to help companies evaluate and develop their market growth analysis strategies.

Customer Landscape of Application Modernization Services Industry

Competitive Landscape

Companies are implementing various strategies, such as strategic alliances, application modernization services market forecast, partnerships, mergers and acquisitions, geographical expansion, and product/service launches, to enhance their presence in the industry.

Accenture Plc - Delivers cloud-native transformation through legacy replatforming and AI-powered accelerators, focusing on portfolio rationalization and modern engineering to reduce technical debt and enhance agility.

The industry research and growth report includes detailed analyses of the competitive landscape of the market and information about key companies, including:

  • Accenture Plc
  • Atos SE
  • Capgemini Service SAS
  • Cisco Systems Inc.
  • Cognizant Technology Solution
  • Deloitte Touche Tohmatsu Ltd.
  • DXC Technology Co.
  • Ernst and Young Global Ltd.
  • Fujitsu Ltd.
  • HCL Technologies Ltd.
  • IBM Corp.
  • Infosys Ltd.
  • LTIMindtree Ltd.
  • NTT DATA Corp.
  • Oracle Corp.
  • PricewaterhouseCoopers LLP
  • Tata Consultancy Services
  • Tech Mahindra Ltd.
  • Virtusa Corp.
  • Wipro Ltd.

Qualitative and quantitative analysis of companies has been conducted to help clients understand the wider business environment as well as the strengths and weaknesses of key industry players. Data is qualitatively analyzed to categorize companies as pure play, category-focused, industry-focused, and diversified; it is quantitatively analyzed to categorize companies as dominant, leading, strong, tentative, and weak.

Recent Development and News in Application modernization services market

  • In April 2025, a consortium of major financial institutions in North America announced the completion of a multi-year pilot program that leveraged automated code translation to move core banking functions into a vector-based database environment.
  • In July 2025, the European Union began the full enforcement of the Cyber Resilience Act, which mandates that all digital products sold within the region must adhere to strict security-by-design principles throughout the product lifecycle.
  • In August 2025, a consortium of major telecommunications providers in South America launched a regional edge-computing initiative designed to modernize the legacy customer portals of the firms to comply with local performance and data residency standards.
  • In October 2025, a partnership between major energy utility providers in Northern Europe resulted in the successful migration of several legacy grid management systems to a cloud-native platform, allowing for better integration of renewable energy sources.

Dive into Technavio’s robust research methodology, blending expert interviews, extensive data synthesis, and validated models for unparalleled Application Modernization Services Market insights. See full methodology.

Market Scope
Page number 307
Base year 2025
Historic period 2020-2024
Forecast period 2026-2030
Growth momentum & CAGR Accelerate at a CAGR of 16.2%
Market growth 2026-2030 USD 24974.9 million
Market structure Fragmented
YoY growth 2025-2026(%) 15.5%
Key countries US, Canada, Mexico, Germany, UK, France, Italy, Russia, Spain, China, India, Japan, South Korea, Australia, Indonesia, Brazil, Argentina, Colombia, UAE, Saudi Arabia, South Africa, Israel and Turkey
Competitive landscape Leading Companies, Market Positioning of Companies, Competitive Strategies, and Industry Risks

Request Free Sample

Research Analyst Overview

  • The market is driven by a strategic imperative to address technical debt reduction through a comprehensive cloud-native transformation. This involves the transition from monolithic to microservices, facilitated by AI-powered automation and generative AI code generation for automated code conversion and automated refactoring.
  • A successful containerization strategy, alongside DevOps integration and agile development methodologies, is critical for legacy code refactoring and legacy system reengineering. Organizations are adopting hybrid cloud strategies and multi-cloud strategies, often with multi-cloud managed services, to optimize their application portfolio and achieve application portfolio rationalization.
  • The modernization of IT infrastructure, including IT infrastructure upgrades and the shift to cloud-native environments and serverless models, is essential. Key boardroom decisions now focus on managing the transition to a zero-trust security architecture, ensuring cyber resilience act compliance and strengthening software supply chain security.
  • This focus on security has led to a 30% reduction in vulnerability patching times for modernized applications. The adoption of green computing metrics is also influencing hybrid cloud environment designs and microservices-based architecture choices, reflecting a broader commitment to sustainability.

What are the Key Data Covered in this Application Modernization Services Market Research and Growth Report?

  • What is the expected growth of the Application Modernization Services Market between 2026 and 2030?

    • USD 24.97 billion, at a CAGR of 16.2%

  • What segmentation does the market report cover?

    • The report is segmented by Deployment (Cloud based, and On premises), Business Segment (Large enterprises, and Small and medium enterprises), End-user (BFSI, Retail and e-commerce, IT and telecom, Manufacturing, and Others) and Geography (North America, Europe, APAC, South America, Middle East and Africa)

  • Which regions are analyzed in the report?

    • North America, Europe, APAC, South America and Middle East and Africa

  • What are the key growth drivers and market challenges?

    • Integration of generative AI into legacy frameworks, Persistence of technical talent deficit and legacy knowledge loss

  • Who are the major players in the Application Modernization Services Market?

    • Accenture Plc, Atos SE, Capgemini Service SAS, Cisco Systems Inc., Cognizant Technology Solution, Deloitte Touche Tohmatsu Ltd., DXC Technology Co., Ernst and Young Global Ltd., Fujitsu Ltd., HCL Technologies Ltd., IBM Corp., Infosys Ltd., LTIMindtree Ltd., NTT DATA Corp., Oracle Corp., PricewaterhouseCoopers LLP, Tata Consultancy Services, Tech Mahindra Ltd., Virtusa Corp. and Wipro Ltd.

Market Research Insights

  • The market dynamics are defined by a strategic pursuit of operational agility, compelling enterprises to prioritize application portfolio rationalization and adopt hybrid cloud environments. This transition supports a shift from capital expenditure vs operational expenditure models, with organizations that implement serverless models reporting up to a 40% reduction in infrastructure management costs.
  • The focus on a robust cybersecurity resilience framework is also critical, as modern architectures enable firms to align with new regulatory compliance challenges more effectively than legacy systems. Adopting open-source frameworks has become a key strategy for avoiding vendor lock-in.
  • Moreover, successful modernization projects demonstrate a clear return on investment, with some companies achieving a 2:1 improvement in their deployment frequency-to-failure ratio.

We can help! Our analysts can customize this application modernization services market research report to meet your requirements.

Get in touch

1. Executive Summary

1.1 Market overview

Executive Summary - Chart on Market Overview
Executive Summary - Data Table on Market Overview
Executive Summary - Chart on Global Market Characteristics
Executive Summary - Chart on Market by Geography
Executive Summary - Chart on Market Segmentation by Deployment
Executive Summary - Chart on Market Segmentation by Business Segment
Executive Summary - Chart on Market Segmentation by End-user
Executive Summary - Chart on Incremental Growth
Executive Summary - Data Table on Incremental Growth
Executive Summary - Chart on Company Market Positioning

2. Technavio Analysis

2.1 Analysis of price sensitivity, lifecycle, customer purchase basket, adoption rates, and purchase criteria

2.2 Criticality of inputs and Factors of differentiation

Chart on Overview on criticality of inputs and factors of differentiation

2.3 Factors of disruption

Chart on Overview on factors of disruption

2.4 Impact of drivers and challenges

Chart on Impact of drivers and challenges in 2025 and 2030

3. Market Landscape

3.1 Market ecosystem

Chart on Parent Market
Data Table on - Parent Market

3.2 Market characteristics

Chart on Market characteristics analysis

3.3 Value chain analysis

Chart on Value chain analysis

4. Market Sizing

4.1 Market definition

Data Table on Offerings of companies included in the market definition

4.2 Market segment analysis

Market segments

4.3 Market size 2025

4.4 Market outlook: Forecast for 2025-2030

Chart on Global - Market size and forecast 2025-2030 ($ million)
Data Table on Global - Market size and forecast 2025-2030 ($ million)
Chart on Global Market: Year-over-year growth 2025-2030 (%)
Data Table on Global Market: Year-over-year growth 2025-2030 (%)

5. Historic Market Size

5.1 Global Application Modernization Services Market 2020 - 2024

Historic Market Size - Data Table on Global Application Modernization Services Market 2020 - 2024 ($ million)

5.2 Deployment segment analysis 2020 - 2024

Historic Market Size - Deployment Segment 2020 - 2024 ($ million)

5.3 Business segment analysis 2020 - 2024

Historic Market Size - Business Segment 2020 - 2024 ($ million)

5.4 End-user segment analysis 2020 - 2024

Historic Market Size - End-user Segment 2020 - 2024 ($ million)

5.5 Geography segment analysis 2020 - 2024

Historic Market Size - Geography Segment 2020 - 2024 ($ million)

5.6 Country segment analysis 2020 - 2024

Historic Market Size - Country Segment 2020 - 2024 ($ million)

6. Qualitative Analysis

6.1 The AI impact on global application modernization services market

7. Five Forces Analysis

7.1 Five forces summary

Five forces analysis - Comparison between 2025 and 2030

7.2 Bargaining power of buyers

Bargaining power of buyers - Impact of key factors 2025 and 2030

7.3 Bargaining power of suppliers

Bargaining power of suppliers - Impact of key factors in 2025 and 2030

7.4 Threat of new entrants

Threat of new entrants - Impact of key factors in 2025 and 2030

7.5 Threat of substitutes

Threat of substitutes - Impact of key factors in 2025 and 2030

7.6 Threat of rivalry

Threat of rivalry - Impact of key factors in 2025 and 2030

7.7 Market condition

Chart on Market condition - Five forces 2025 and 2030

8. Market Segmentation by Deployment

8.1 Market segments

Chart on Deployment - Market share 2025-2030 (%)
Data Table on Deployment - Market share 2025-2030 (%)

8.2 Comparison by Deployment

Chart on Comparison by Deployment
Data Table on Comparison by Deployment

8.3 Cloud based - Market size and forecast 2025-2030

Chart on Cloud based - Market size and forecast 2025-2030 ($ million)
Data Table on Cloud based - Market size and forecast 2025-2030 ($ million)
Chart on Cloud based - Year-over-year growth 2025-2030 (%)
Data Table on Cloud based - Year-over-year growth 2025-2030 (%)

8.4 On premises - Market size and forecast 2025-2030

Chart on On premises - Market size and forecast 2025-2030 ($ million)
Data Table on On premises - Market size and forecast 2025-2030 ($ million)
Chart on On premises - Year-over-year growth 2025-2030 (%)
Data Table on On premises - Year-over-year growth 2025-2030 (%)

8.5 Market opportunity by Deployment

Market opportunity by Deployment ($ million)
Data Table on Market opportunity by Deployment ($ million)

9. Market Segmentation by Business Segment

9.1 Market segments

Chart on Market Segmentation by Business Segment - Market share 2025-2030 (%)
Data Table on Market Segmentation by Business Segment - Market share 2025-2030 (%)

9.2 Comparison by Market Segmentation by Business Segment

Chart on Comparison by Market Segmentation by Business Segment
Data Table on Comparison by Market Segmentation by Business Segment

9.3 Large enterprises - Market size and forecast 2025-2030

Chart on Large enterprises - Market size and forecast 2025-2030 ($ million)
Data Table on Large enterprises - Market size and forecast 2025-2030 ($ million)
Chart on Large enterprises - Year-over-year growth 2025-2030 (%)
Data Table on Large enterprises - Year-over-year growth 2025-2030 (%)

9.4 Small and medium enterprises - Market size and forecast 2025-2030

Chart on Small and medium enterprises - Market size and forecast 2025-2030 ($ million)
Data Table on Small and medium enterprises - Market size and forecast 2025-2030 ($ million)
Chart on Small and medium enterprises - Year-over-year growth 2025-2030 (%)
Data Table on Small and medium enterprises - Year-over-year growth 2025-2030 (%)

9.5 Market opportunity by Market Segmentation by Business Segment

Market opportunity by Market Segmentation by Business Segment ($ million)
Data Table on Market opportunity by Market Segmentation by Business Segment ($ million)

10. Market Segmentation by End-user

10.1 Market segments

Chart on End-user - Market share 2025-2030 (%)
Data Table on End-user - Market share 2025-2030 (%)

10.2 Comparison by End-user

Chart on Comparison by End-user
Data Table on Comparison by End-user

10.3 BFSI - Market size and forecast 2025-2030

Chart on BFSI - Market size and forecast 2025-2030 ($ million)
Data Table on BFSI - Market size and forecast 2025-2030 ($ million)
Chart on BFSI - Year-over-year growth 2025-2030 (%)
Data Table on BFSI - Year-over-year growth 2025-2030 (%)

10.4 Retail and e-commerce - Market size and forecast 2025-2030

Chart on Retail and e-commerce - Market size and forecast 2025-2030 ($ million)
Data Table on Retail and e-commerce - Market size and forecast 2025-2030 ($ million)
Chart on Retail and e-commerce - Year-over-year growth 2025-2030 (%)
Data Table on Retail and e-commerce - Year-over-year growth 2025-2030 (%)

10.5 IT and telecom - Market size and forecast 2025-2030

Chart on IT and telecom - Market size and forecast 2025-2030 ($ million)
Data Table on IT and telecom - Market size and forecast 2025-2030 ($ million)
Chart on IT and telecom - Year-over-year growth 2025-2030 (%)
Data Table on IT and telecom - Year-over-year growth 2025-2030 (%)

10.6 Manufacturing - Market size and forecast 2025-2030

Chart on Manufacturing - Market size and forecast 2025-2030 ($ million)
Data Table on Manufacturing - Market size and forecast 2025-2030 ($ million)
Chart on Manufacturing - Year-over-year growth 2025-2030 (%)
Data Table on Manufacturing - Year-over-year growth 2025-2030 (%)

10.7 Others - Market size and forecast 2025-2030

Chart on Others - Market size and forecast 2025-2030 ($ million)
Data Table on Others - Market size and forecast 2025-2030 ($ million)
Chart on Others - Year-over-year growth 2025-2030 (%)
Data Table on Others - Year-over-year growth 2025-2030 (%)

10.8 Market opportunity by End-user

Market opportunity by End-user ($ million)
Data Table on Market opportunity by End-user ($ million)

11. Customer Landscape

11.1 Customer landscape overview

Analysis of price sensitivity, lifecycle, customer purchase basket, adoption rates, and purchase criteria

12. Geographic Landscape

12.1 Geographic segmentation

Chart on Market share by geography 2025-2030 (%)
Data Table on Market share by geography 2025-2030 (%)

12.2 Geographic comparison

Chart on Geographic comparison
Data Table on Geographic comparison

12.3 North America - Market size and forecast 2025-2030

Chart on North America - Market size and forecast 2025-2030 ($ million)
Data Table on North America - Market size and forecast 2025-2030 ($ million)
Chart on North America - Year-over-year growth 2025-2030 (%)
Data Table on North America - Year-over-year growth 2025-2030 (%)
Chart on Regional Comparison - North America
Data Table on Regional Comparison - North America

12.3.1 US - Market size and forecast 2025-2030

Chart on US - Market size and forecast 2025-2030 ($ million)
Data Table on US - Market size and forecast 2025-2030 ($ million)
Chart on US - Year-over-year growth 2025-2030 (%)
Data Table on US - Year-over-year growth 2025-2030 (%)

12.3.2 Canada - Market size and forecast 2025-2030

Chart on Canada - Market size and forecast 2025-2030 ($ million)
Data Table on Canada - Market size and forecast 2025-2030 ($ million)
Chart on Canada - Year-over-year growth 2025-2030 (%)
Data Table on Canada - Year-over-year growth 2025-2030 (%)

12.3.3 Mexico - Market size and forecast 2025-2030

Chart on Mexico - Market size and forecast 2025-2030 ($ million)
Data Table on Mexico - Market size and forecast 2025-2030 ($ million)
Chart on Mexico - Year-over-year growth 2025-2030 (%)
Data Table on Mexico - Year-over-year growth 2025-2030 (%)

12.4 Europe - Market size and forecast 2025-2030

Chart on Europe - Market size and forecast 2025-2030 ($ million)
Data Table on Europe - Market size and forecast 2025-2030 ($ million)
Chart on Europe - Year-over-year growth 2025-2030 (%)
Data Table on Europe - Year-over-year growth 2025-2030 (%)
Chart on Regional Comparison - Europe
Data Table on Regional Comparison - Europe

12.4.1 Germany - Market size and forecast 2025-2030

Chart on Germany - Market size and forecast 2025-2030 ($ million)
Data Table on Germany - Market size and forecast 2025-2030 ($ million)
Chart on Germany - Year-over-year growth 2025-2030 (%)
Data Table on Germany - Year-over-year growth 2025-2030 (%)

12.4.2 UK - Market size and forecast 2025-2030

Chart on UK - Market size and forecast 2025-2030 ($ million)
Data Table on UK - Market size and forecast 2025-2030 ($ million)
Chart on UK - Year-over-year growth 2025-2030 (%)
Data Table on UK - Year-over-year growth 2025-2030 (%)

12.4.3 France - Market size and forecast 2025-2030

Chart on France - Market size and forecast 2025-2030 ($ million)
Data Table on France - Market size and forecast 2025-2030 ($ million)
Chart on France - Year-over-year growth 2025-2030 (%)
Data Table on France - Year-over-year growth 2025-2030 (%)

12.4.4 Italy - Market size and forecast 2025-2030

Chart on Italy - Market size and forecast 2025-2030 ($ million)
Data Table on Italy - Market size and forecast 2025-2030 ($ million)
Chart on Italy - Year-over-year growth 2025-2030 (%)
Data Table on Italy - Year-over-year growth 2025-2030 (%)

12.4.5 Russia - Market size and forecast 2025-2030

Chart on Russia - Market size and forecast 2025-2030 ($ million)
Data Table on Russia - Market size and forecast 2025-2030 ($ million)
Chart on Russia - Year-over-year growth 2025-2030 (%)
Data Table on Russia - Year-over-year growth 2025-2030 (%)

12.4.6 Spain - Market size and forecast 2025-2030

Chart on Spain - Market size and forecast 2025-2030 ($ million)
Data Table on Spain - Market size and forecast 2025-2030 ($ million)
Chart on Spain - Year-over-year growth 2025-2030 (%)
Data Table on Spain - Year-over-year growth 2025-2030 (%)

12.5 APAC - Market size and forecast 2025-2030

Chart on APAC - Market size and forecast 2025-2030 ($ million)
Data Table on APAC - Market size and forecast 2025-2030 ($ million)
Chart on APAC - Year-over-year growth 2025-2030 (%)
Data Table on APAC - Year-over-year growth 2025-2030 (%)
Chart on Regional Comparison - APAC
Data Table on Regional Comparison - APAC

12.5.1 China - Market size and forecast 2025-2030

Chart on China - Market size and forecast 2025-2030 ($ million)
Data Table on China - Market size and forecast 2025-2030 ($ million)
Chart on China - Year-over-year growth 2025-2030 (%)
Data Table on China - Year-over-year growth 2025-2030 (%)

12.5.2 India - Market size and forecast 2025-2030

Chart on India - Market size and forecast 2025-2030 ($ million)
Data Table on India - Market size and forecast 2025-2030 ($ million)
Chart on India - Year-over-year growth 2025-2030 (%)
Data Table on India - Year-over-year growth 2025-2030 (%)

12.5.3 Japan - Market size and forecast 2025-2030

Chart on Japan - Market size and forecast 2025-2030 ($ million)
Data Table on Japan - Market size and forecast 2025-2030 ($ million)
Chart on Japan - Year-over-year growth 2025-2030 (%)
Data Table on Japan - Year-over-year growth 2025-2030 (%)

12.5.4 South Korea - Market size and forecast 2025-2030

Chart on South Korea - Market size and forecast 2025-2030 ($ million)
Data Table on South Korea - Market size and forecast 2025-2030 ($ million)
Chart on South Korea - Year-over-year growth 2025-2030 (%)
Data Table on South Korea - Year-over-year growth 2025-2030 (%)

12.5.5 Australia - Market size and forecast 2025-2030

Chart on Australia - Market size and forecast 2025-2030 ($ million)
Data Table on Australia - Market size and forecast 2025-2030 ($ million)
Chart on Australia - Year-over-year growth 2025-2030 (%)
Data Table on Australia - Year-over-year growth 2025-2030 (%)

12.5.6 Indonesia - Market size and forecast 2025-2030

Chart on Indonesia - Market size and forecast 2025-2030 ($ million)
Data Table on Indonesia - Market size and forecast 2025-2030 ($ million)
Chart on Indonesia - Year-over-year growth 2025-2030 (%)
Data Table on Indonesia - Year-over-year growth 2025-2030 (%)

12.6 South America - Market size and forecast 2025-2030

Chart on South America - Market size and forecast 2025-2030 ($ million)
Data Table on South America - Market size and forecast 2025-2030 ($ million)
Chart on South America - Year-over-year growth 2025-2030 (%)
Data Table on South America - Year-over-year growth 2025-2030 (%)
Chart on Regional Comparison - South America
Data Table on Regional Comparison - South America

12.6.1 Brazil - Market size and forecast 2025-2030

Chart on Brazil - Market size and forecast 2025-2030 ($ million)
Data Table on Brazil - Market size and forecast 2025-2030 ($ million)
Chart on Brazil - Year-over-year growth 2025-2030 (%)
Data Table on Brazil - Year-over-year growth 2025-2030 (%)

12.6.2 Argentina - Market size and forecast 2025-2030

Chart on Argentina - Market size and forecast 2025-2030 ($ million)
Data Table on Argentina - Market size and forecast 2025-2030 ($ million)
Chart on Argentina - Year-over-year growth 2025-2030 (%)
Data Table on Argentina - Year-over-year growth 2025-2030 (%)

12.6.3 Colombia - Market size and forecast 2025-2030

Chart on Colombia - Market size and forecast 2025-2030 ($ million)
Data Table on Colombia - Market size and forecast 2025-2030 ($ million)
Chart on Colombia - Year-over-year growth 2025-2030 (%)
Data Table on Colombia - Year-over-year growth 2025-2030 (%)

12.7 Middle East and Africa - Market size and forecast 2025-2030

Chart on Middle East and Africa - Market size and forecast 2025-2030 ($ million)
Data Table on Middle East and Africa - Market size and forecast 2025-2030 ($ million)
Chart on Middle East and Africa - Year-over-year growth 2025-2030 (%)
Data Table on Middle East and Africa - Year-over-year growth 2025-2030 (%)
Chart on Regional Comparison - Middle East and Africa
Data Table on Regional Comparison - Middle East and Africa

12.7.1 UAE - Market size and forecast 2025-2030

Chart on UAE - Market size and forecast 2025-2030 ($ million)
Data Table on UAE - Market size and forecast 2025-2030 ($ million)
Chart on UAE - Year-over-year growth 2025-2030 (%)
Data Table on UAE - Year-over-year growth 2025-2030 (%)

12.7.2 Saudi Arabia - Market size and forecast 2025-2030

Chart on Saudi Arabia - Market size and forecast 2025-2030 ($ million)
Data Table on Saudi Arabia - Market size and forecast 2025-2030 ($ million)
Chart on Saudi Arabia - Year-over-year growth 2025-2030 (%)
Data Table on Saudi Arabia - Year-over-year growth 2025-2030 (%)

12.7.3 South Africa - Market size and forecast 2025-2030

Chart on South Africa - Market size and forecast 2025-2030 ($ million)
Data Table on South Africa - Market size and forecast 2025-2030 ($ million)
Chart on South Africa - Year-over-year growth 2025-2030 (%)
Data Table on South Africa - Year-over-year growth 2025-2030 (%)

12.7.4 Israel - Market size and forecast 2025-2030

Chart on Israel - Market size and forecast 2025-2030 ($ million)
Data Table on Israel - Market size and forecast 2025-2030 ($ million)
Chart on Israel - Year-over-year growth 2025-2030 (%)
Data Table on Israel - Year-over-year growth 2025-2030 (%)

12.7.5 Turkey - Market size and forecast 2025-2030

Chart on Turkey - Market size and forecast 2025-2030 ($ million)
Data Table on Turkey - Market size and forecast 2025-2030 ($ million)
Chart on Turkey - Year-over-year growth 2025-2030 (%)
Data Table on Turkey - Year-over-year growth 2025-2030 (%)

12.8 Market opportunity by geography

Market opportunity by geography ($ million)
Data Tables on Market opportunity by geography ($ million)

13. Drivers, Challenges, and Opportunity

13.1 Market drivers

Integration of generative AI into legacy frameworks
Strengthening of global cybersecurity regulations and zero-trust architectures
Evolution toward cloud-native environments and serverless computing

13.2 Market challenges

Persistence of technical talent deficit and legacy knowledge loss
Complexity of maintaining data integrity and regulatory compliance during transition
Financial constraints and operational disruption in large-scale migration

13.3 Impact of drivers and challenges

Impact of drivers and challenges in 2025 and 2030

13.4 Market opportunities

Proliferation of generative AI in automated code conversion
Strategic focus on digital sovereignty and regional cloud modernization
Integration of sustainability and green computing metrics into modernization

14. Competitive Landscape

14.1 Overview

14.2

Overview on criticality of inputs and factors of differentiation

14.3 Landscape disruption

Overview on factors of disruption

14.4 Industry risks

Impact of key risks on business

15. Competitive Analysis

15.1 Companies profiled

Companies covered

15.2 Company ranking index

15.3 Market positioning of companies

Matrix on companies position and classification

15.4 Accenture Plc

Accenture Plc - Overview
Accenture Plc - Business segments
Accenture Plc - Key news
Accenture Plc - Key offerings
Accenture Plc - Segment focus
SWOT

15.5 Atos SE

Atos SE - Overview
Atos SE - Business segments
Atos SE - Key news
Atos SE - Key offerings
Atos SE - Segment focus
SWOT

15.6 Capgemini Service SAS

Capgemini Service SAS - Overview
Capgemini Service SAS - Business segments
Capgemini Service SAS - Key news
Capgemini Service SAS - Key offerings
Capgemini Service SAS - Segment focus
SWOT

15.7 Cognizant Technology Solution

Cognizant Technology Solution - Overview
Cognizant Technology Solution - Business segments
Cognizant Technology Solution - Key news
Cognizant Technology Solution - Key offerings
Cognizant Technology Solution - Segment focus
SWOT

15.8 Deloitte Touche Tohmatsu Ltd.

Deloitte Touche Tohmatsu Ltd. - Overview
Deloitte Touche Tohmatsu Ltd. - Business segments
Deloitte Touche Tohmatsu Ltd. - Key offerings
Deloitte Touche Tohmatsu Ltd. - Segment focus
SWOT

15.9 DXC Technology Co.

DXC Technology Co. - Overview
DXC Technology Co. - Business segments
DXC Technology Co. - Key news
DXC Technology Co. - Key offerings
DXC Technology Co. - Segment focus
SWOT

15.10 Ernst and Young Global Ltd.

Ernst and Young Global Ltd. - Overview
Ernst and Young Global Ltd. - Product / Service
Ernst and Young Global Ltd. - Key offerings
SWOT

15.11 Fujitsu Ltd.

Fujitsu Ltd. - Overview
Fujitsu Ltd. - Business segments
Fujitsu Ltd. - Key news
Fujitsu Ltd. - Key offerings
Fujitsu Ltd. - Segment focus
SWOT

15.12 HCL Technologies Ltd.

HCL Technologies Ltd. - Overview
HCL Technologies Ltd. - Business segments
HCL Technologies Ltd. - Key news
HCL Technologies Ltd. - Key offerings
HCL Technologies Ltd. - Segment focus
SWOT

15.13 IBM Corp.

IBM Corp. - Overview
IBM Corp. - Business segments
IBM Corp. - Key news
IBM Corp. - Key offerings
IBM Corp. - Segment focus
SWOT

15.14 Infosys Ltd.

Infosys Ltd. - Overview
Infosys Ltd. - Business segments
Infosys Ltd. - Key news
Infosys Ltd. - Key offerings
Infosys Ltd. - Segment focus
SWOT

15.15 NTT DATA Corp.

NTT DATA Corp. - Overview
NTT DATA Corp. - Business segments
NTT DATA Corp. - Key news
NTT DATA Corp. - Key offerings
NTT DATA Corp. - Segment focus
SWOT

15.16 PricewaterhouseCoopers LLP

PricewaterhouseCoopers LLP - Overview
PricewaterhouseCoopers LLP - Product / Service
PricewaterhouseCoopers LLP - Key offerings
SWOT

15.17 Tata Consultancy Services

Tata Consultancy Services - Overview
Tata Consultancy Services - Business segments
Tata Consultancy Services - Key news
Tata Consultancy Services - Key offerings
Tata Consultancy Services - Segment focus
SWOT

15.18 Wipro Ltd.

Wipro Ltd. - Overview
Wipro Ltd. - Business segments
Wipro Ltd. - Key news
Wipro Ltd. - Key offerings
Wipro Ltd. - Segment focus
SWOT

16. Appendix

16.1 Scope of the report

Market definition
Objectives
Notes and caveats

16.2 Inclusions and exclusions checklist

Inclusions checklist
Exclusions checklist

16.3 Currency conversion rates for US$

16.4 Research methodology

16.5 Data procurement

Information sources

16.6 Data validation

16.7 Validation techniques employed for market sizing

16.8 Data synthesis

16.9 360 degree market analysis

16.10 List of abbreviations

Research Methodology

Technavio presents a detailed picture of the market by way of study, synthesis, and summation of data from multiple sources. The analysts have presented the various facets of the market with a particular focus on identifying the key industry influencers. The data thus presented is comprehensive, reliable, and the result of extensive research, both primary and secondary.

INFORMATION SOURCES

Primary sources

  • Manufacturers and suppliers
  • Channel partners
  • Industry experts
  • Strategic decision makers

Secondary sources

  • Industry journals and periodicals
  • Government data
  • Financial reports of key industry players
  • Historical data
  • Press releases

DATA ANALYSIS

Data Synthesis

  • Collation of data
  • Estimation of key figures
  • Analysis of derived insights

Data Validation

  • Triangulation with data models
  • Reference against proprietary databases
  • Corroboration with industry experts

REPORT WRITING

Qualitative

  • Market drivers
  • Market challenges
  • Market trends
  • Five forces analysis

Quantitative

  • Market size and forecast
  • Market segmentation
  • Geographical insights
  • Competitive landscape

Interested in this report?

Get your sample now to see our research methodology and insights!

Download Now

Frequently Asked Questions

Application Modernization Services market growth will increase by USD 24974.9 million during 2026-2030.

The Application Modernization Services market is expected to grow at a CAGR of 16.2% during 2026-2030.

Application Modernization Services market is segmented by Deployment (Cloud based, On premises) Business segment (Large enterprises, Small and medium enterprises) End-user (BFSI, Retail and e-commerce, IT and telecom, Manufacturing, Others)

Accenture Plc, Atos SE, Capgemini Service SAS, Cisco Systems Inc., Cognizant Technology Solution, Deloitte Touche Tohmatsu Ltd., DXC Technology Co., Ernst and Young Global Ltd., Fujitsu Ltd., HCL Technologies Ltd., IBM Corp., Infosys Ltd., LTIMindtree Ltd., NTT DATA Corp., Oracle Corp., PricewaterhouseCoopers LLP, Tata Consultancy Services, Tech Mahindra Ltd., Virtusa Corp., Wipro Ltd. are a few of the key vendors in the Application Modernization Services market.

North America will register the highest growth rate of 38.6% among the other regions. Therefore, the Application Modernization Services market in North America is expected to garner significant business opportunities for the vendors during the forecast period.

US, Canada, Mexico, Germany, UK, France, Italy, Russia, Spain, China, India, Japan, South Korea, Australia, Indonesia, Brazil, Argentina, Colombia, UAE, Saudi Arabia, South Africa, Israel, Turkey

  • Integration of generative AI into legacy frameworks is the driving factor this market.

The Application Modernization Services market vendors should focus on grabbing business opportunities from the Deployment segment as it accounted for the largest market share in the base year.
RIA - Research AI Assistant
Ask RIA