
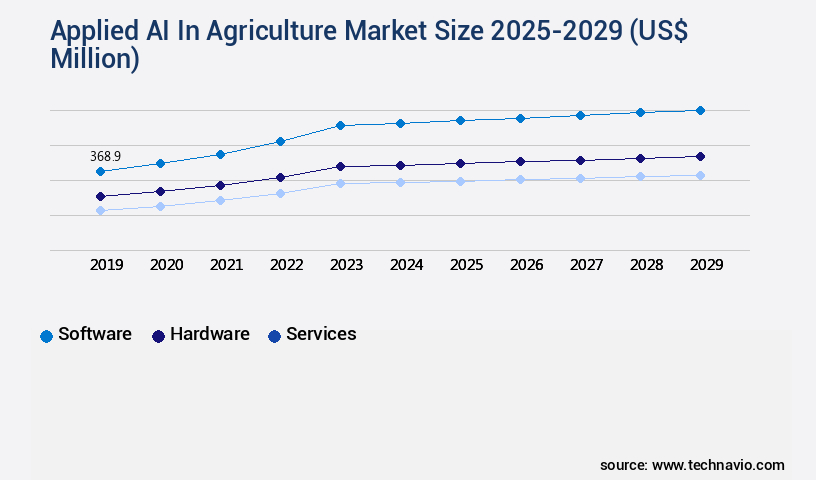
Applied AI In Agriculture Market Size 2025-2029
The applied AI in agriculture market size is valued to increase by USD 2.31 billion, at a CAGR of 20.4% from 2024 to 2029. Increasing global food demand and need for enhanced farm productivity will drive the applied ai in agriculture market.
Major Market Trends & Insights
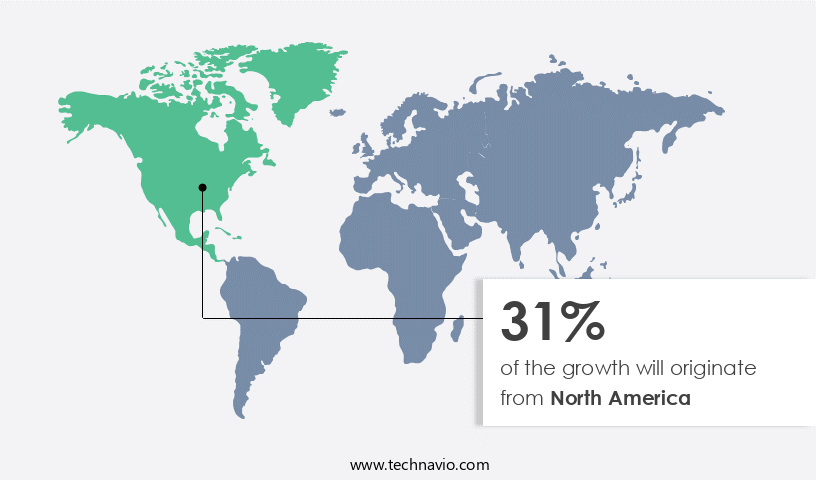
- North America dominated the market and accounted for a 31% growth during the forecast period.
- By Component - Software segment was valued at USD 368.90 billion in 2023
- By Application - Crop monitoring and health assessment segment accounted for the largest market revenue share in 2023
Market Size & Forecast
- Market Opportunities: USD 373.63 million
- Market Future Opportunities: USD 2313.10 million
- CAGR from 2024 to 2029 : 20.4%
Market Summary
- The Applied Artificial Intelligence (AI) in Agriculture Market is experiencing significant growth as global food demand escalates and the agricultural sector seeks to enhance productivity. AI technologies, such as machine learning and computer vision, are increasingly being adopted to automate farming processes, from crop monitoring and yield optimization to livestock management and precision irrigation. This market's expansion is driven by the potential for increased efficiency, reduced labor costs, and improved crop quality. According to a recent study, the global market for AI in agriculture is projected to reach USD11.1 billion by 2026, growing at a steady rate.
- However, the path to widespread adoption is not without challenges. Prohibitive implementation costs and ambiguous return on investment remain significant barriers for many farmers. Moreover, concerns around data privacy and security, as well as the need for reliable internet connectivity in rural areas, can hinder the adoption of AI technologies. Despite these challenges, the agricultural sector is accelerating towards hyper-automation and fully autonomous operations. Companies are investing in AI-powered solutions to address these issues, offering farmers affordable, scalable, and secure solutions. As AI continues to revolutionize agriculture, it will play a pivotal role in ensuring food security, reducing waste, and increasing sustainability.
What will be the Size of the Applied AI In Agriculture Market during the forecast period?

Get Key Insights on Market Forecast (PDF) Request Free Sample
How is the Applied AI In Agriculture Market Segmented ?
The applied ai in agriculture industry research report provides comprehensive data (region-wise segment analysis), with forecasts and estimates in "USD million" for the period 2025-2029, as well as historical data from 2019-2023 for the following segments.
- Component
- Software
- Hardware
- Services
- Application
- Crop monitoring and health assessment
- Precision farming
- Soil management and field mapping
- Livestock monitoring
- Others
- Technology
- ML and DL
- Computer vision
- Predictive analytics
- Robotics and automation
- NLP
- Geography
- North America
- US
- Canada
- Europe
- France
- Germany
- The Netherlands
- UK
- APAC
- Australia
- China
- India
- South America
- Brazil
- Rest of World (ROW)
- North America
By Component Insights
The software segment is estimated to witness significant growth during the forecast period.
The market is a dynamic and ever-evolving landscape, characterized by the integration of advanced technologies to optimize farming practices. This sector encompasses a range of applications, from predictive maintenance models for machinery to AI-powered irrigation systems that enhance water resource management. Disease prediction models and input optimization strategies are crucial components, ensuring crop health and reducing waste. Crop phenotyping techniques, soil health monitoring, and vertical farming technologies leverage machine learning algorithms to improve productivity and sustainability. Weed detection systems, sensor data integration, and plant growth modeling contribute to precision agriculture techniques, while greenhouse automation systems and smart farming technologies streamline livestock management.
Pest management systems, precision livestock farming, genomic selection methods, and farm management software are essential tools for farmers. Remote sensing applications, climate-smart agriculture, precision fertilization techniques, and sustainable farming practices promote efficient resource utilization. Hydroponics optimization, robotics in agriculture, and agricultural drones imagery offer innovative solutions for large-scale farming. Automated harvesting systems and harvest optimization strategies ensure optimal yield and reduce labor costs. The market's data-driven transformation is evident in the integration of sensor data, machine learning, and AI to create a smarter, more efficient agricultural sector. For instance, AI-driven systems can analyze livestock behavior and health data, reducing the need for manual monitoring by up to 30%.
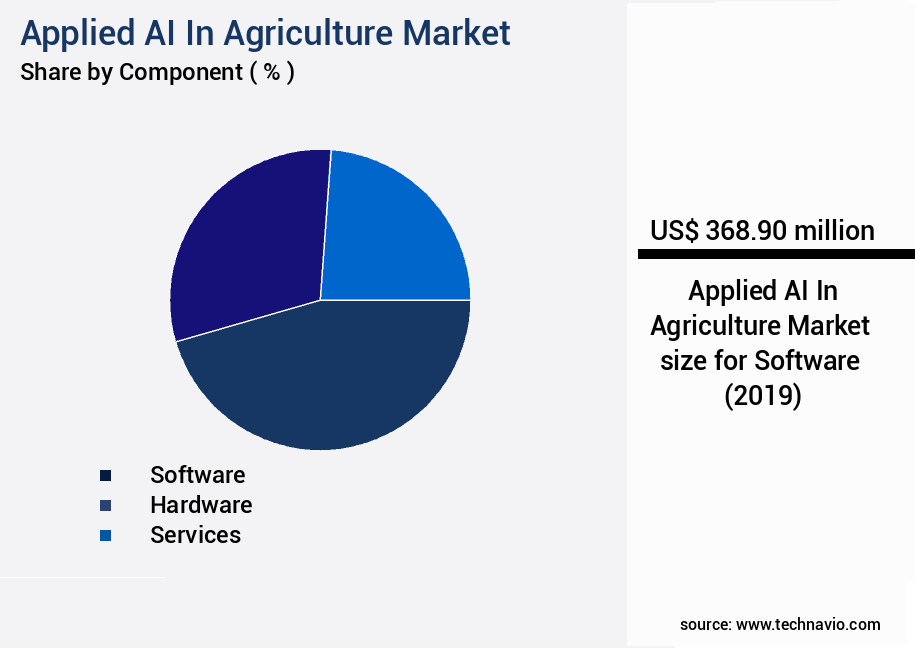
The Software segment was valued at USD 368.90 billion in 2019 and showed a gradual increase during the forecast period.
Regional Analysis
North America is estimated to contribute 31% to the growth of the global market during the forecast period.Technavio's analysts have elaborately explained the regional trends and drivers that shape the market during the forecast period.
See How Applied AI In Agriculture Market Demand is Rising in North America Request Free Sample
The market is witnessing significant growth, with North America leading the charge. This region, primarily consisting of the United States and Canada, is characterized by large-scale farming operations that can financially support advanced technological innovations. Structural factors, such as persistent labor shortages and escalating labor costs, are driving the adoption of automation and robotics in agriculture. As a result, the market is witnessing a strong focus on high-end AI applications, including autonomous tractors and combines, AI-driven robotic systems for planting and harvesting, and advanced predictive analytics platforms.
According to recent studies, the North American market is projected to account for over 40% of the global market share by 2027.
Market Dynamics
Our researchers analyzed the data with 2024 as the base year, along with the key drivers, trends, and challenges. A holistic analysis of drivers will help companies refine their marketing strategies to gain a competitive advantage.
The market is experiencing rapid growth as farmers and agribusinesses seek to optimize yields and improve efficiency through advanced technology. AI-driven yield optimization strategies are revolutionizing agriculture, enabling real-time crop monitoring through interactive dashboards that provide actionable insights. Automated irrigation scheduling systems, utilizing sensor network data integration, ensure optimized water usage in agriculture. Precision nutrient management techniques, fueled by data-driven decision support systems, enhance crop health and productivity. Predictive modeling for pest outbreaks and remote sensing for irrigation management are crucial components of modern farming, allowing farmers to proactively address issues and minimize losses.
Computer vision for weed identification and machine learning for disease diagnosis offer accurate and timely diagnoses, reducing the need for manual labor and increasing efficiency. Robotics for automated harvesting and automated livestock health monitoring further streamline operations, ensuring optimal conditions for both crops and livestock. Precision fertilization using sensor data and optimized water usage in agriculture contribute to sustainable farming practices. Greenhouse climate control systems and vertical farming efficiency improvements leverage AI to create ideal growing conditions, while hydroponics nutrient delivery systems and plant growth modeling for yield prediction enable year-round production. Crop phenotyping for genetic selection and genomic selection for improved crop traits ensure long-term productivity and profitability in the agricultural sector. The market continues to evolve, offering innovative solutions for farmers and agribusinesses worldwide.
What are the key market drivers leading to the rise in the adoption of Applied AI In Agriculture Industry?
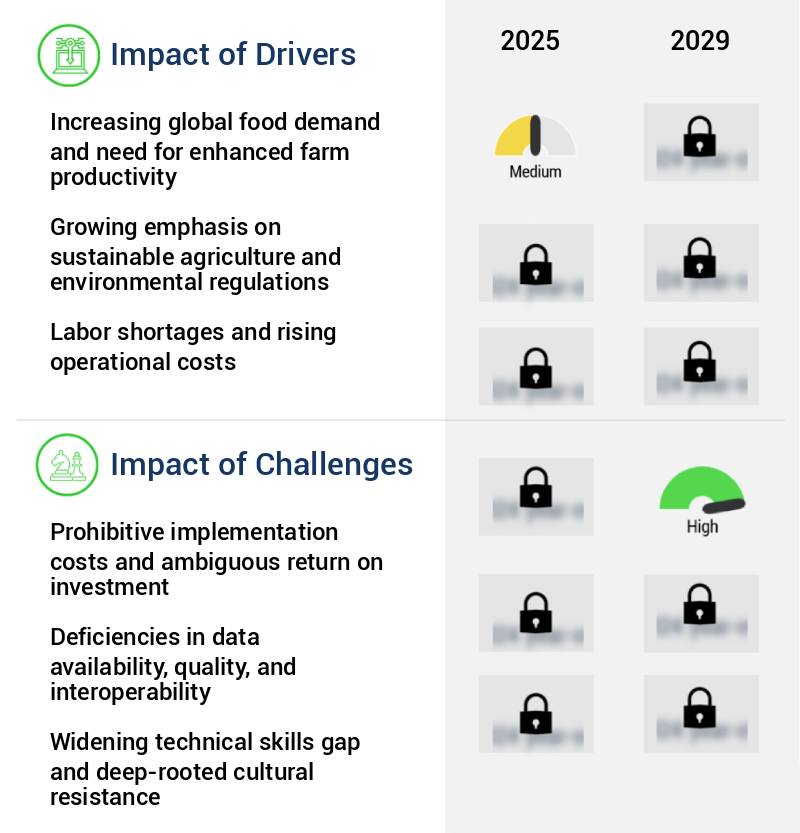
- The escalating global food demand and the necessity for heightened farm productivity serve as the primary market drivers.
- The market is gaining momentum due to the pressing need to boost farm productivity in response to escalating global food demand. With the United Nations projecting a significant population increase by 2050, there is a requirement for a substantial increase in food production from a finite and resource-constrained land base. Traditional farming methods are nearing their productive limits, necessitating technologies that can heighten efficiency and bridge the gap between potential and actual crop yields. Artificial intelligence (AI) emerges as an ideal solution, empowering the shift towards data-driven precision agriculture.
- By transitioning farm management from a practice reliant on broad averages to one grounded in granular, real-time insights, AI-powered solutions significantly enhance agricultural productivity. For instance, AI technologies can optimize irrigation, improve crop monitoring, and facilitate automated livestock management, leading to increased yields and reduced resource consumption.
What are the market trends shaping the Applied AI In Agriculture Industry?
- The market trend increasingly favors acceleration toward hyper-automation and fully autonomous operations. Hyper-automation and fully autonomous operations are the emerging market trends.
- The market is undergoing a significant transformation, transitioning from precision agriculture to hyper-automation and the development of fully autonomous farming systems. This shift marks a pivotal moment, as AI evolves from a decision-support tool to the primary operational force, managing intricate tasks with minimal human intervention. The catalysts fueling this evolution are diverse, including persistent agricultural labor shortages, the economic necessity for increased efficiency, and the technological advancements in robotics, computer vision, and machine learning.
- In developed regions like North America and Europe, the dwindling rural workforce and escalating labor costs have ignited a pressing demand for automated solutions capable of round-the-clock, uninterrupted operation.
What challenges does the Applied AI In Agriculture Industry face during its growth?
- The high implementation costs, which can be prohibitive, and the ambiguity surrounding potential returns on investment represent significant challenges that hinder industry growth.
- The market is undergoing significant evolution, offering potential solutions to address various challenges in the agricultural sector. AI technologies, including autonomous tractors, drones, multispectral sensors, and robotic systems, are increasingly being adopted for precision farming, crop monitoring, livestock management, and yield optimization. However, the high financial investment required for implementing these advanced technologies poses a substantial barrier for many farming operations, particularly small to medium-sized enterprises. These entities, which form a significant portion of the agricultural sector in regions like APAC and parts of Europe, often operate on thin margins. The initial investment in hardware, software platforms, data processing subscriptions, and specialized integration services can be substantial.
- For instance, the global market for agricultural drones is projected to reach USD1.2 billion by 2027, growing at a considerable rate. Despite the financial challenge, the potential benefits of AI in agriculture, such as increased efficiency, reduced labor costs, and enhanced crop yields, make it an attractive proposition for forward-thinking farmers.
Exclusive Technavio Analysis on Customer Landscape
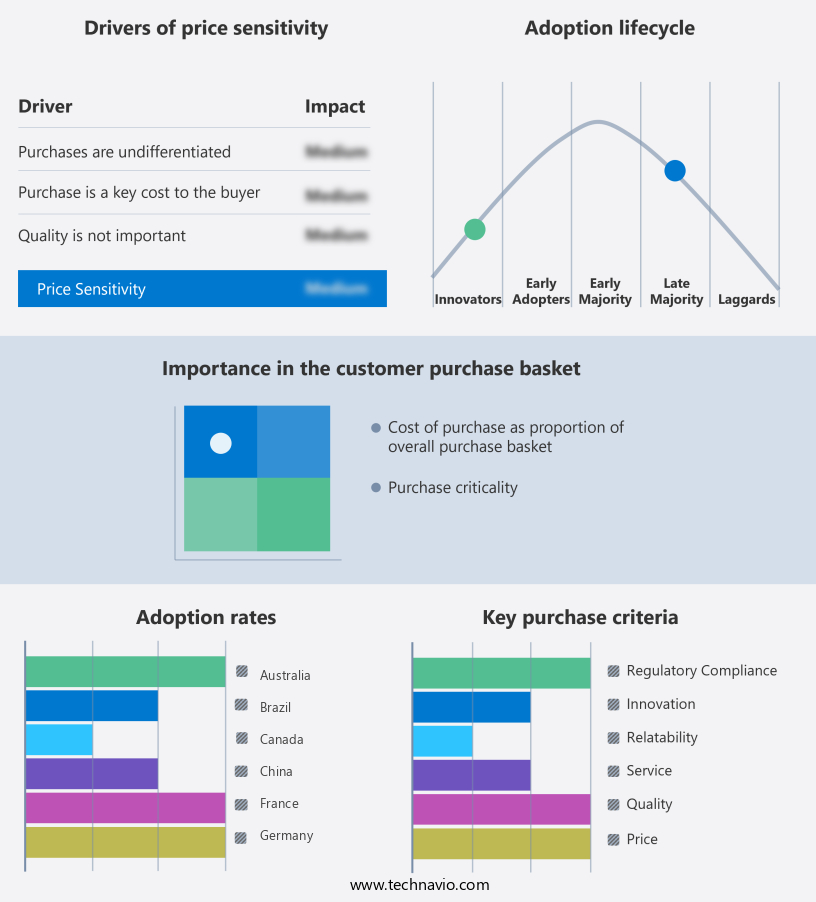
The applied ai in agriculture market forecasting report includes the adoption lifecycle of the market, covering from the innovator's stage to the laggard's stage. It focuses on adoption rates in different regions based on penetration. Furthermore, the applied ai in agriculture market report also includes key purchase criteria and drivers of price sensitivity to help companies evaluate and develop their market growth analysis strategies.
Customer Landscape of Applied AI In Agriculture Industry
Competitive Landscape
Companies are implementing various strategies, such as strategic alliances, applied ai in agriculture market forecast, partnerships, mergers and acquisitions, geographical expansion, and product/service launches, to enhance their presence in the industry.
A.A.A Taranis Visual Ltd. - The company's AI2 SmartScout platform leverages advanced artificial intelligence to revolutionize agriculture. This solution provides ultra-high-resolution aerial imagery and intricate leaf-level analytics, enabling early detection of pests, diseases, and nutrient deficiencies. By harnessing AI technology, farmers can optimize crop yields and minimize losses.
The industry research and growth report includes detailed analyses of the competitive landscape of the market and information about key companies, including:
- A.A.A Taranis Visual Ltd.
- AeroFarms LLC
- AgEagle Aerial Systems Inc.
- Agremo
- Benson Hill Inc.
- CropX Technologies Ltd.
- Deere and Co.
- Ever.Ag
- Farmers Edge Inc.
- Granular Inc.
- Guangzhou XAG Co. Ltd.
- Indigo Ag Inc.
- International Business Machines Corp.
- Recursion Pharmaceuticals Inc.
- Sentera Inc.
- The Climate Corp.
- Trace Genomics Inc.
- Trimble Inc.
- Valmont Industries Inc.
Qualitative and quantitative analysis of companies has been conducted to help clients understand the wider business environment as well as the strengths and weaknesses of key industry players. Data is qualitatively analyzed to categorize companies as pure play, category-focused, industry-focused, and diversified; it is quantitatively analyzed to categorize companies as dominant, leading, strong, tentative, and weak.
Recent Development and News in Applied AI In Agriculture Market
- In January 2024, Trimble Inc. Announced the launch of its new FarmWorks AI Crop Modeling solution, which uses machine learning algorithms to optimize crop yields and reduce input costs for farmers (Trimble Press Release).
- In March 2024, Microsoft and John Deere signed a strategic partnership to integrate Microsoft Azure's AI capabilities into John Deere's precision agriculture offerings, aiming to enhance farm productivity and sustainability (Microsoft News Center).
- In April 2025, PrecisionHawk, a leading provider of drone-based data solutions, raised USD70 million in a Series D funding round, fueling its expansion into new markets and the development of advanced AI-powered agricultural solutions (PrecisionHawk Press Release).
- In May 2025, the European Commission approved the Horizon 2020 project "AI4AgriFood," a multi-year initiative to develop and deploy AI technologies for sustainable agriculture across Europe, marking a significant commitment to the sector's growth and innovation (European Commission Press Release).
Dive into Technavio's robust research methodology, blending expert interviews, extensive data synthesis, and validated models for unparalleled Applied AI In Agriculture Market insights. See full methodology.
|
Market Scope |
|
|
Report Coverage |
Details |
|
Page number |
249 |
|
Base year |
2024 |
|
Historic period |
2019-2023 |
|
Forecast period |
2025-2029 |
|
Growth momentum & CAGR |
Accelerate at a CAGR of 20.4% |
|
Market growth 2025-2029 |
USD 2313.1 million |
|
Market structure |
Fragmented |
|
YoY growth 2024-2025(%) |
18.2 |
|
Key countries |
US, China, Germany, Canada, India, Brazil, UK, France, Australia, and The Netherlands |
|
Competitive landscape |
Leading Companies, Market Positioning of Companies, Competitive Strategies, and Industry Risks |
Research Analyst Overview
- The agricultural sector continues to embrace advanced technologies, with Artificial Intelligence (AI) playing a pivotal role in driving innovation and productivity. AI applications span various sectors, from predictive maintenance models for machinery to AI-powered irrigation systems that optimize water usage. Disease prediction models help farmers anticipate potential crop threats, while input optimization strategies enhance the efficiency of farming operations. Crop phenotyping techniques, utilizing machine learning algorithms, provide valuable insights into plant growth and development. Soil health monitoring, a critical component of sustainable farming practices, is enhanced through AI-driven analysis of sensor data. Vertical farming technologies, smart farming systems, and greenhouse automation are revolutionizing agriculture, enabling precise control over growing conditions.
- Precision agriculture techniques extend to livestock farming through precision livestock farming and genomic selection methods. Remote sensing applications, such as agricultural drones imagery, offer valuable data for water resource management and climate-smart agriculture. Precision fertilization techniques and sustainable farming practices contribute to optimizing agricultural productivity while minimizing environmental impact. The integration of AI in agriculture is expected to drive industry growth by over 15% annually, as reported by market research. For instance, a leading farm in California implemented an AI-driven weed detection system, resulting in a 30% reduction in herbicide usage. The future of agriculture lies in the continuous application of AI, robotics, and automation, ensuring a more sustainable and productive food production system.
What are the Key Data Covered in this Applied AI In Agriculture Market Research and Growth Report?
-
What is the expected growth of the Applied AI In Agriculture Market between 2025 and 2029?
-
USD 2.31 billion, at a CAGR of 20.4%
-
-
What segmentation does the market report cover?
-
The report is segmented by Component (Software, Hardware, and Services), Application (Crop monitoring and health assessment, Precision farming, Soil management and field mapping, Livestock monitoring, and Others), Technology (ML and DL, Computer vision, Predictive analytics, Robotics and automation, and NLP), and Geography (North America, Europe, APAC, South America, and Middle East and Africa)
-
-
Which regions are analyzed in the report?
-
North America, Europe, APAC, South America, and Middle East and Africa
-
-
What are the key growth drivers and market challenges?
-
Increasing global food demand and need for enhanced farm productivity, Prohibitive implementation costs and ambiguous return on investment
-
-
Who are the major players in the Applied AI In Agriculture Market?
-
A.A.A Taranis Visual Ltd., AeroFarms LLC, AgEagle Aerial Systems Inc., Agremo, Benson Hill Inc., CropX Technologies Ltd., Deere and Co., Ever.Ag, Farmers Edge Inc., Granular Inc., Guangzhou XAG Co. Ltd., Indigo Ag Inc., International Business Machines Corp., Recursion Pharmaceuticals Inc., Sentera Inc., The Climate Corp., Trace Genomics Inc., Trimble Inc., and Valmont Industries Inc.
-
Market Research Insights
- The market for AI applications in agriculture is continually advancing, with innovative technologies transforming traditional farming practices. Two significant developments include yield mapping techniques and potassium optimization. Yield mapping enables farmers to analyze crop production data in real-time, identifying areas of their fields that require improvement. For instance, a study showed that implementing yield mapping techniques led to a 10% increase in corn yields. Furthermore, the agricultural industry anticipates a 15% compound annual growth rate in AI adoption over the next decade.
- Automated weed control, IoT sensor networks, farm resource optimization, and other AI applications are revolutionizing agriculture, making farming more efficient and sustainable.
We can help! Our analysts can customize this applied ai in agriculture market research report to meet your requirements.
 RIA -
RIA - 
