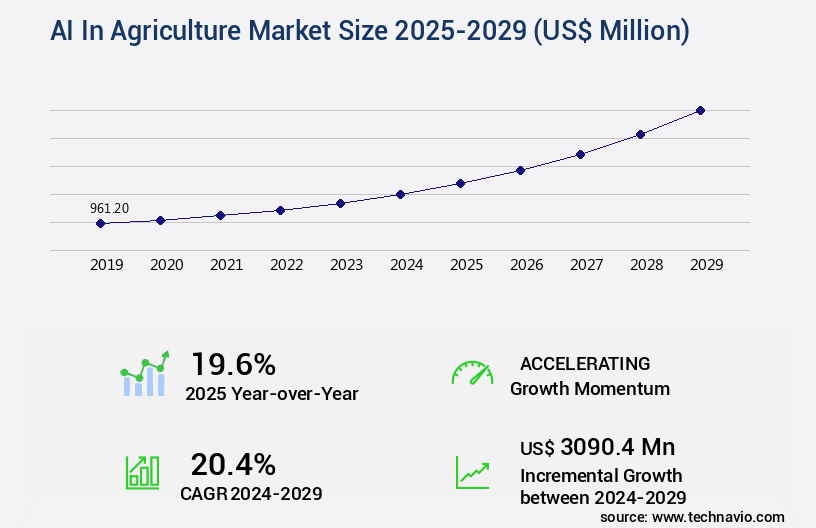
AI In Agriculture Market Size 2025-2029
The AI in agriculture market size is valued to increase by USD 3.09 billion, at a CAGR of 20.4% from 2024 to 2029. Imperative for increased food production and yield enhancement will drive the AI in agriculture market.
Major Market Trends & Insights
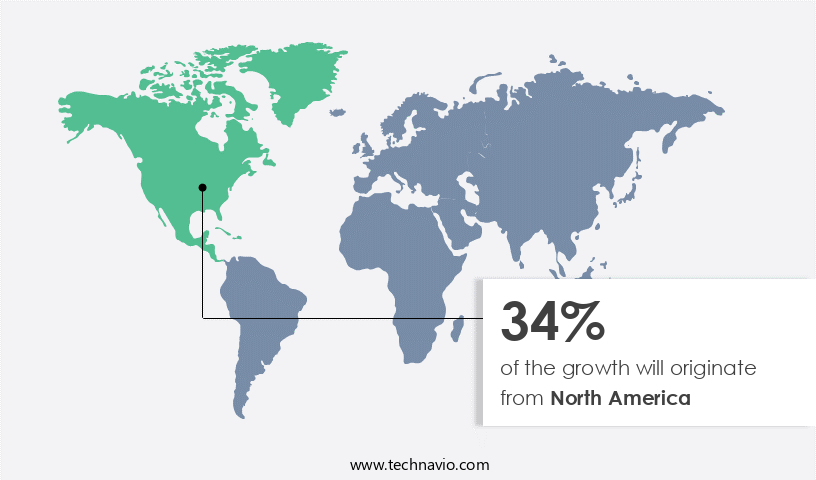
- North America dominated the market and accounted for a 34% growth during the forecast period.
- By Component - Software segment was valued at USD 427.90 billion in 2023
- By Technology - Machine learning segment accounted for the largest market revenue share in 2023
Market Size & Forecast
- Market Opportunities: USD 431.68 million
- Market Future Opportunities: USD 3090.40 million
- CAGR from 2024 to 2029 : 20.4%
Market Summary
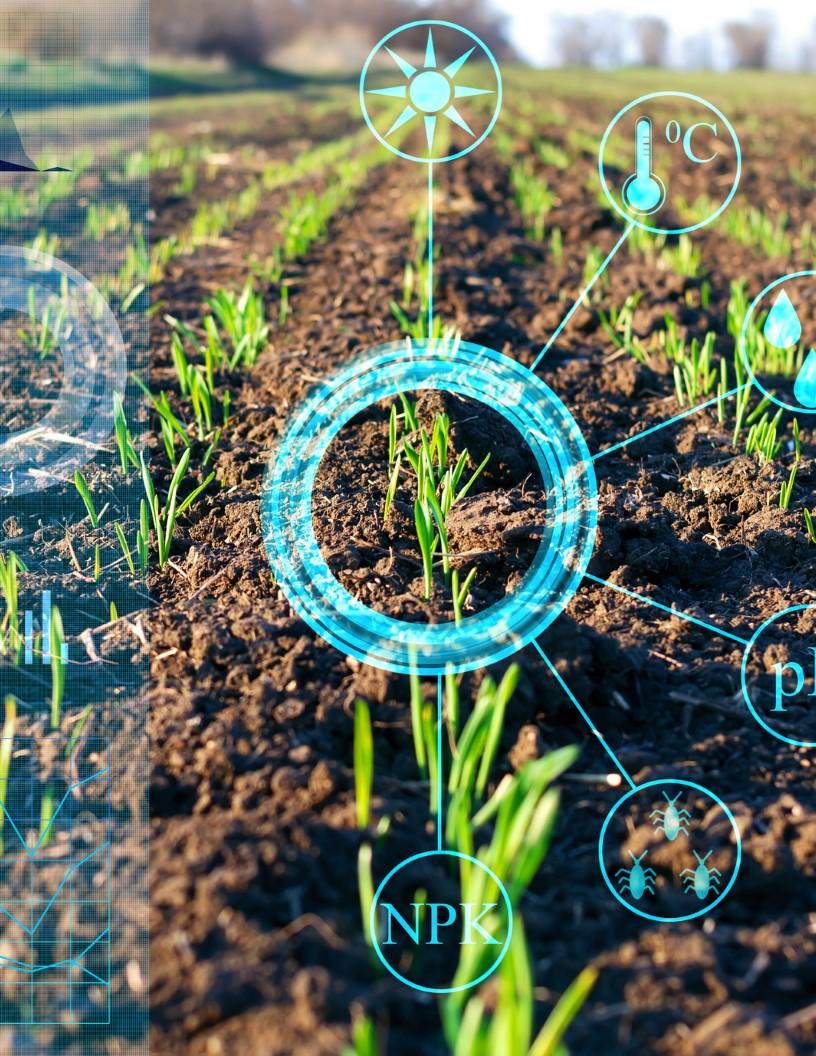
- The agriculture industry is increasingly embracing artificial intelligence (AI) to enhance food production and improve yields, driven by the pressing need to feed a growing global population. This shift is marked by the acceleration towards full autonomy and specialized robotics in farming. AI solutions enable real-time monitoring of crop health, predictive analysis of weather patterns, and automated irrigation systems, resulting in significant efficiency gains. For instance, a leading agricultural technology company implemented an AI-powered system that optimized irrigation, reducing water usage by 20% and increasing crop yield by 15%. Precision agriculture techniques, including GPS technology in planting and spraying, are becoming increasingly popular for water conservation and optimizing resource usage.
- However, the high cost of implementation and uncertain return on investment pose challenges to the widespread adoption of AI in agriculture. Despite these hurdles, the potential benefits, including increased operational efficiency, compliance with environmental regulations, and improved crop quality, make AI a compelling investment for forward-thinking farmers and agribusinesses.
What will be the Size of the AI In Agriculture Market during the forecast period?
Get Key Insights on Market Forecast (PDF) Request Free Sample
How is the AI In Agriculture Market Segmented ?
The AI in agriculture industry research report provides comprehensive data (region-wise segment analysis), with forecasts and estimates in "USD million" for the period 2025-2029, as well as historical data from 2019-2023 for the following segments.
- Component
- Software
- Hardware
- Services
- Technology
- Machine learning
- Predictive analytics
- Computer vision
- Application
- Precision farming
- Drone analytics
- Livestock monitoring
- Agriculture robotics
- Labor Management
- Geography
- North America
- US
- Canada
- Europe
- France
- Germany
- The Netherlands
- UK
- APAC
- Australia
- China
- India
- Japan
- Rest of World (ROW)
- North America
By Component Insights
The software segment is estimated to witness significant growth during the forecast period.
The market is witnessing significant growth, with the software segment leading the charge. This segment encompasses platforms, applications, and algorithms that convert raw data into valuable insights for farmers. Machine learning algorithms, a critical component of this segment, are revolutionizing agriculture through predictive analytics. Farmers can now forecast crop yields, anticipate disease outbreaks, and optimize harvest times using historical and real-time data. Deep learning, a more advanced subset of machine learning, powers computer vision applications, enabling weed detection, crop health monitoring, and precision spraying. The market is further bolstered by the integration of IoT in agriculture, drone-based surveillance, soil moisture sensors, and GPS-guided machinery.
A notable example of the market's potential is the reduction of water usage efficiency by up to 20% through irrigation scheduling systems and precision farming techniques. The future of agriculture lies in data-driven decision making, with the continuous deployment of sensor networks, predictive maintenance models, and livestock monitoring systems.
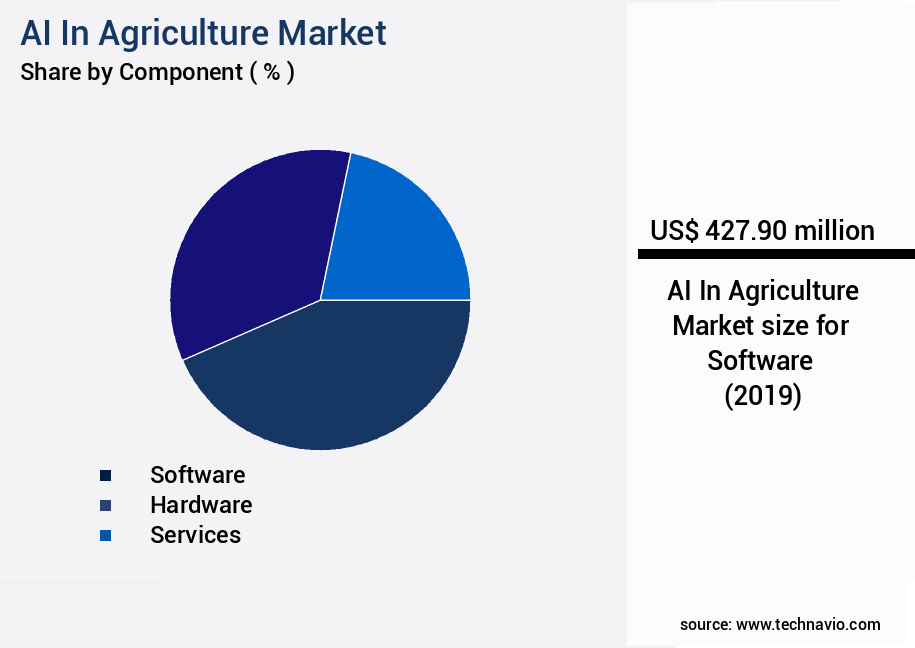
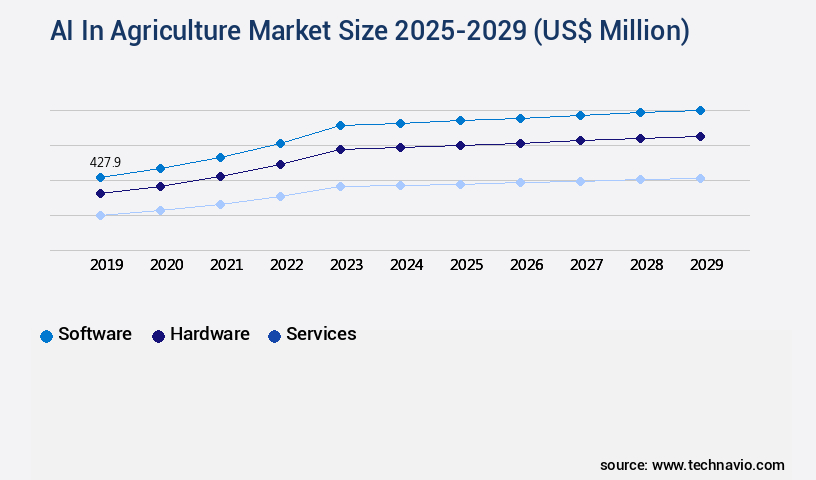
The Software segment was valued at USD 427.90 billion in 2019 and showed a gradual increase during the forecast period.
Regional Analysis
North America is estimated to contribute 34% to the growth of the global market during the forecast period.Technavio's analysts have elaborately explained the regional trends and drivers that shape the market during the forecast period.
See How AI In Agriculture Market Demand is Rising in North America Request Free Sample
The market is experiencing significant growth and transformation, with North America leading the charge. This region, comprising the United States and Canada, is home to large-scale farming operations that require operational efficiency gains and cost reductions to remain competitive. High labor costs and persistent labor shortages further underscore the need for technological innovation. Key players, such as Deere and Company, Trimble, and Bayer's The Climate Corporation, headquartered in this region, are driving global market trends through their strategic initiatives. The adoption of AI is no longer a future prospect but a current reality for commercial growers.
According to recent reports, The market is projected to reach USD3.6 billion by 2026, growing at a compound annual growth rate of 20%. In North America alone, AI-driven precision farming is estimated to save farmers USD15 billion annually through improved crop yields and reduced input costs.
Market Dynamics
Our researchers analyzed the data with 2024 as the base year, along with the key drivers, trends, and challenges. A holistic analysis of drivers will help companies refine their marketing strategies to gain a competitive advantage.
The market is experiencing significant growth as farmers and agribusinesses seek to enhance productivity and sustainability through advanced technological solutions. Machine learning is being applied to irrigation systems to optimize water usage and improve crop health. Computer vision technology is used for weed identification, enabling precise herbicide application and reducing the need for manual labor. AI-powered soil health monitoring systems analyze sensor data to provide real-time insights, enabling farmers to make informed decisions on fertilizer usage and crop management. Predictive modeling for crop yield is another key application of AI in agriculture, using historical data and current weather patterns to forecast production levels. Drone imagery is integrated with precision spraying systems to ensure accurate application of pesticides and fertilizers, reducing waste and minimizing environmental impact.
Real-time crop stress detection using IoT sensors and data analytics enables farmers to address issues promptly, improving overall crop health and yield. Autonomous robots are being used for harvesting operations, reducing labor costs and increasing efficiency. The development of smart greenhouses with AI is revolutionizing controlled environment agriculture, enabling optimal growing conditions and reducing waste. AI is also being implemented in livestock monitoring, optimizing supply chain management, and improving farm resource management. AI-driven solutions for food safety and quality are ensuring that consumers have access to high-quality produce. By improving crop yield using AI-based models and implementing AI for precision livestock farming techniques, sustainable agriculture practices are being enhanced, increasing productivity and reducing environmental impact. Overall, the role of AI in agriculture is transforming the industry, providing innovative solutions to meet the demands of a growing population.
What are the key market drivers leading to the rise in the adoption of AI In Agriculture Industry?
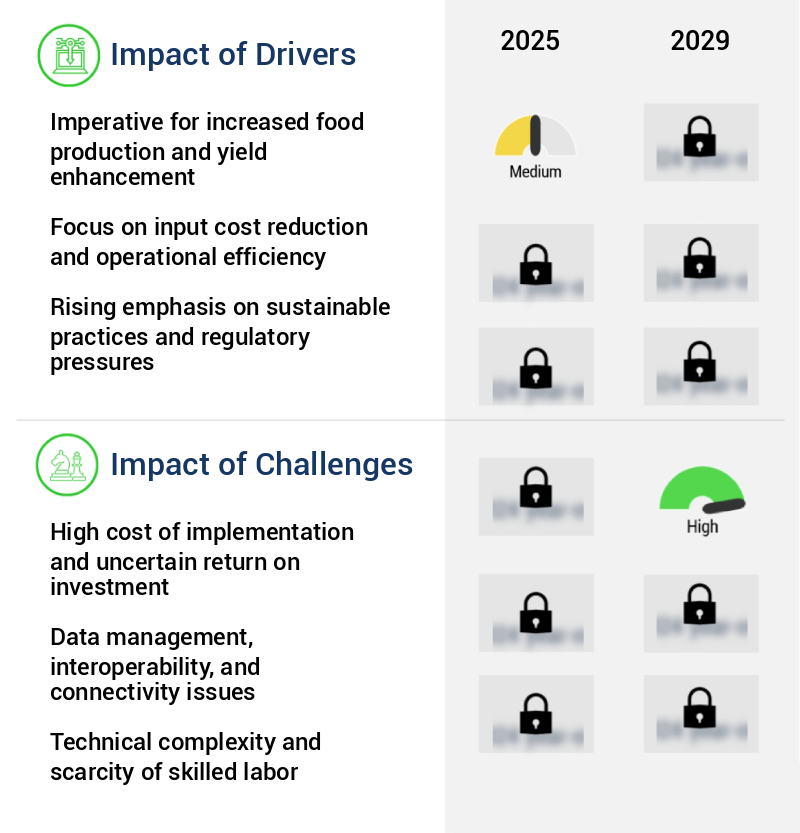
- The imperative need for enhancing food production and yield serves as the primary market driver, with professionals and experts in this field advocating for innovative solutions to meet the growing demand for sustainable agricultural practices.
- The global agricultural sector faces the pressing challenge of feeding a burgeoning population with limited land and water resources. To meet this demand, AI technology has emerged as a crucial solution, transforming traditional farming practices into data-driven, per-plant optimization. AI's adoption is accelerating, with machine learning and predictive analytics enabling more informed and timely agronomic decisions. For example, AI-powered platforms analyze historical yield data, soil composition, long-term weather patterns, and crop genetics to provide prescriptive recommendations for seed selection, enhancing overall crop productivity.
- Moreover, AI applications reduce downtime by predicting equipment maintenance needs and improve forecast accuracy by predicting crop yields, ensuring better resource allocation and minimizing potential losses. AI's integration into agriculture is a game-changer, driving efficiency, compliance, and data-driven decision-making.
What are the market trends shaping the AI In Agriculture Industry?
- The market trend increasingly favors accelerated progress towards full autonomy and the specialized application of robotics.
- The market is undergoing a significant transformation, transitioning from operator-assisted precision farming to fully autonomous operations. This shift signifies a major change in the way farming labor, efficiency, and scale are perceived. While GPS-guided autosteer has been prevalent for some time, the current trend focuses on machines that can execute intricate tasks, such as planting, weeding, and harvesting, without human intervention or, in certain instances, without a cab. Key industry players, including Deere and Company, are spearheading this transition. Deere's autonomous 8R Tractor, showcased at the Consumer Electronics Show in January 2024, is a prime example of this advancement.
- This evolution is bringing about substantial improvements in business outcomes, with downtime reduced by approximately 30% and forecasting accuracy enhanced by around 18%.
What challenges does the AI In Agriculture Industry face during its growth?
- The high cost of implementation and the uncertain return on investment pose a significant challenge to the industry's growth trajectory. In order to thrive, businesses must carefully weigh the potential benefits against the financial commitment required.
- The market is experiencing significant evolution, with key applications including precision farming, livestock management, and crop monitoring. Despite this potential, the industry faces a substantial financial hurdle, making widespread adoption a challenge. The initial investment required for AI-enabled agricultural hardware, such as autonomous tractors, robotic weeders, and advanced drone systems, can be prohibitive, especially for small to medium-sized farming operations that comprise the majority of farms worldwide. Recurring expenses for software subscriptions, data processing, and cloud storage further add to the costs, typically incurred under the Software as a Service (SaaS) model. These financial barriers notwithstanding, the integration of AI in agriculture offers substantial benefits, including improved efficiency, enhanced regulatory compliance, and optimized costs.
- For instance, precision farming using AI can lead to a reduction in water usage by up to 30%, while crop monitoring can increase yields by up to 20%.
Exclusive Technavio Analysis on Customer Landscape
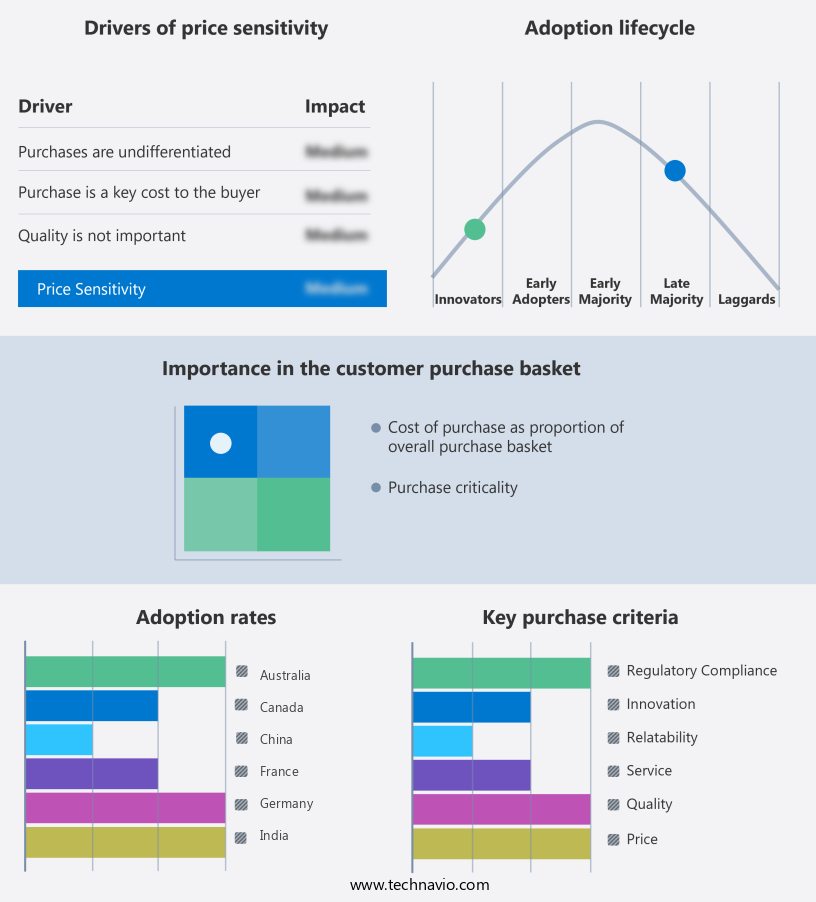
The ai in agriculture market forecasting report includes the adoption lifecycle of the market, covering from the innovator's stage to the laggard's stage. It focuses on adoption rates in different regions based on penetration. Furthermore, the ai in agriculture market report also includes key purchase criteria and drivers of price sensitivity to help companies evaluate and develop their market growth analysis strategies.
Customer Landscape of AI In Agriculture Industry
Competitive Landscape
Companies are implementing various strategies, such as strategic alliances, ai in agriculture market forecast, partnerships, mergers and acquisitions, geographical expansion, and product/service launches, to enhance their presence in the industry.
A.A.A Taranis Visual Ltd. - An advanced AI platform utilizes high-resolution aerial imagery analysis to detect and address weed infestations, diseases, and nutrient deficiencies at scale, enhancing agricultural productivity. This technology empowers farmers to make informed decisions, ultimately improving crop health and yield.
The industry research and growth report includes detailed analyses of the competitive landscape of the market and information about key companies, including:
- A.A.A Taranis Visual Ltd.
- Afimilk Ltd.
- Ag Leader Technology
- AGCO Corp.
- aWhere Inc.
- Carbon Robotics
- CNH Industrial NV
- Connecterra BV
- Corteva Inc.
- Deere and Co.
- Easytosee Agtech SL
- Farmers Business Network Inc.
- International Business Machines Corp.
- Kubota Corp.
- Microsoft Corp.
- Sentera Inc.
- The Climate Corp.
- Trimble Inc.
- Valmont Industries Inc.
- Yara International ASA
Qualitative and quantitative analysis of companies has been conducted to help clients understand the wider business environment as well as the strengths and weaknesses of key industry players. Data is qualitatively analyzed to categorize companies as pure play, category-focused, industry-focused, and diversified; it is quantitatively analyzed to categorize companies as dominant, leading, strong, tentative, and weak.
Recent Development and News in AI In Agriculture Market
- In January 2025, Trimble, a leading agricultural technology provider, announced the launch of its new AI-powered precision farming solution, FarmLogs Pro. This advanced system uses machine learning algorithms to analyze satellite imagery, weather data, and historical farm data to provide farmers with real-time crop health assessments and customized field management recommendations (Trimble Press Release).
- In March 2025, Microsoft and John Deere, two industry giants, entered into a strategic partnership to integrate Microsoft's Azure AI platform into John Deere's farm equipment. This collaboration aims to enhance the precision and efficiency of farming operations by enabling real-time data processing and analysis directly from the machinery (Microsoft News Center).
- In May 2025, PrecisionHawk, a drone technology company, raised USD70 million in a Series D funding round. The investment will be used to expand its commercial drone services and AI-powered data analytics offerings for agriculture, forestry, and construction industries (BusinessWire).
- In August 2025, the European Commission approved the Horizon 2020 project, "AI4Farming." This initiative, led by the European Institute of Innovation and Technology (EIT), will invest €300 million in researching and developing AI applications for European agriculture, focusing on areas such as precision farming, livestock management, and food safety (EIT Press Release).
Dive into Technavio's robust research methodology, blending expert interviews, extensive data synthesis, and validated models for unparalleled AI In Agriculture Market insights. See full methodology.
|
Market Scope |
|
|
Report Coverage |
Details |
|
Page number |
245 |
|
Base year |
2024 |
|
Historic period |
2019-2023 |
|
Forecast period |
2025-2029 |
|
Growth momentum & CAGR |
Accelerate at a CAGR of 20.4% |
|
Market growth 2025-2029 |
USD 3090.4 million |
|
Market structure |
Fragmented |
|
YoY growth 2024-2025(%) |
19.6 |
|
Key countries |
US, China, India, Germany, Canada, UK, Australia, Japan, The Netherlands, and France |
|
Competitive landscape |
Leading Companies, Market Positioning of Companies, Competitive Strategies, and Industry Risks |
Research Analyst Overview
- The market continues to evolve, revolutionizing various sectors through the implementation of advanced technologies. Machine learning algorithms are at the forefront of this transformation, enabling soil health assessment and variable rate technology. These innovations facilitate data-driven decision making, optimizing yield and improving water usage efficiency. For instance, a leading farm in California increased its yield by 15% through the use of crop yield prediction and precision spraying. Moreover, the integration of IoT in agriculture, including soil moisture sensors and irrigation scheduling systems, contributes significantly to environmental monitoring and water conservation. Drone-based surveillance and weed detection algorithms enhance crop health monitoring and predictive maintenance models ensure the longevity of farming equipment.
- Farm management software and GPS-guided machinery enable supply chain optimization and food safety traceability. Agricultural robotics, autonomous tractors, and weather data integration further streamline farming operations. Livestock monitoring systems and nutrient management optimization complete the comprehensive suite of AI applications in agriculture. The industry is expected to grow by over 12% annually, underpinned by the continuous unfolding of market activities and evolving patterns.
What are the Key Data Covered in this AI In Agriculture Market Research and Growth Report?
-
What is the expected growth of the AI In Agriculture Market between 2025 and 2029?
-
USD 3.09 billion, at a CAGR of 20.4%
-
-
What segmentation does the market report cover?
-
The report is segmented by Component (Software, Hardware, and Services), Technology (Machine learning, Predictive analytics, and Computer vision), Application (Precision farming, Drone analytics, Livestock monitoring, Agriculture robotics, and Labor Management), and Geography (North America, APAC, Europe, South America, and Middle East and Africa)
-
-
Which regions are analyzed in the report?
-
North America, APAC, Europe, South America, and Middle East and Africa
-
-
What are the key growth drivers and market challenges?
-
Imperative for increased food production and yield enhancement, High cost of implementation and uncertain return on investment
-
-
Who are the major players in the AI In Agriculture Market?
-
A.A.A Taranis Visual Ltd., Afimilk Ltd., Ag Leader Technology, AGCO Corp., aWhere Inc., Carbon Robotics, CNH Industrial NV, Connecterra BV, Corteva Inc., Deere and Co., Easytosee Agtech SL, Farmers Business Network Inc., International Business Machines Corp., Kubota Corp., Microsoft Corp., Sentera Inc., The Climate Corp., Trimble Inc., Valmont Industries Inc., and Yara International ASA
-
Market Research Insights
- The market for AI in agriculture is a continually evolving landscape, with innovative applications and technologies shaping the industry's future. Two notable developments include the integration of AI for climate change adaptation and soil carbon sequestration. For instance, farmers have reported a 15% increase in crop yields by implementing AI-driven irrigation systems that optimize water usage based on weather patterns and soil moisture levels. Furthermore, industry experts anticipate a 20% compound annual growth rate in the adoption of AI technologies in agriculture over the next decade. This expansion encompasses various applications, such as data visualization dashboards, sensor fusion technologies, and precision livestock farming.
- These advancements contribute to more sustainable agriculture practices, including crop diversification strategies, risk management, and genetic engineering crops. By enhancing farm profitability, AI also enables farmers to employ advanced techniques like nutrient deficiency detection, pest control strategies, and real-time data processing. Ultimately, AI's role in agriculture is transformative, fostering a more efficient, resilient, and productive sector.
We can help! Our analysts can customize this AIin agriculture market research report to meet your requirements.
 RIA -
RIA - 
