Arachidonic Acid Market Analysis APAC, North America, Europe, South America, Middle East and Africa - US, China, Japan, India, South Korea, Australia, Canada, Germany, UK, France - Size and Forecast 2025-2029

Arachidonic Acid Market Analysis APAC, North America, Europe, South America, Middle East and Africa - US, China, Japan, India, South Korea, Australia, Canada, Germany, UK, France - Size and Forecast 2025-2029

Published: Mar 2025 224 Pages SKU: IRTNTR40362

Market Overview at a Glance

$196.1 Mn
Market Opportunity
9%
CAGR
8.0
YoY growth 2024-2025(%)

Arachidonic Acid Market Size 2025-2029

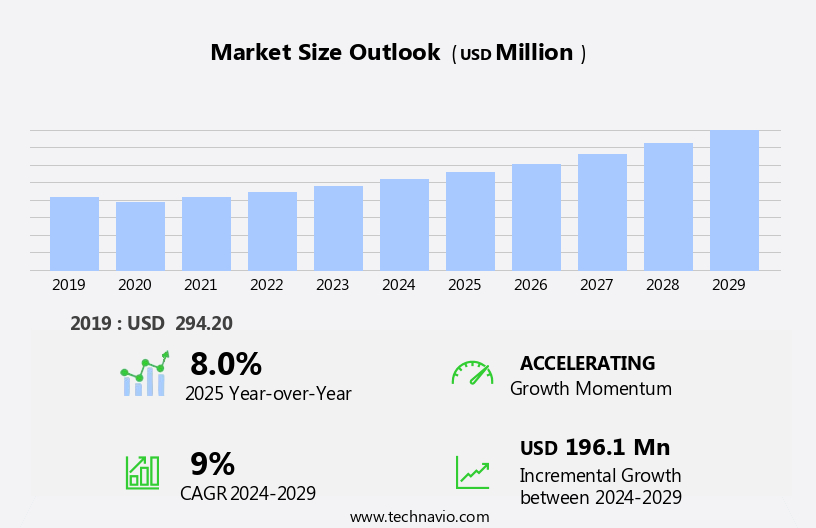
The arachidonic acid market size is forecast to increase by USD 196.1 million at a CAGR of 9% between 2024 and 2029.

  • The market is experiencing significant growth driven by the rising awareness about preventative healthcare and the increasing demand for baby food products. Arachidonic acid, an essential fatty acid, plays a crucial role in various physiological functions, including brain development and immune response. With the growing emphasis on maintaining optimal health, the demand for arachidonic acid supplements and fortified foods is on the rise. Moreover, the baby food industry is a major contributor to the market's growth. Arachidonic acid is an essential nutrient for infants, and its deficiency can lead to developmental delays. Consequently, baby food manufacturers are incorporating arachidonic acid into their products to cater to the nutritional needs of infants and toddlers.
  • However, the market's growth is not without challenges. The availability of substitutes for arachidonic acid, such as docosahexaenoic acid (DHA) and eicosapentaenoic acid (EPA), poses a significant threat. These substitutes offer similar health benefits and are often more cost-effective. As a result, market players need to differentiate themselves by focusing on product innovation, quality, and pricing strategies to remain competitive. In , the market is poised for growth due to the increasing demand for preventative healthcare and baby food products. However, the availability of substitutes presents a significant challenge. Companies seeking to capitalize on market opportunities and navigate challenges effectively must focus on product innovation, quality, and pricing strategies.

What will be the Size of the Arachidonic Acid Market during the forecast period?

Arachidonic Acid Market Size

 Request Free Sample

  • The market in the US is experiencing significant growth due to increasing demand from various end-users, including the healthcare industry and the food and beverage sector. Arachidonic acid, a key fatty acid in the omega-6 group, is sourced from various origins, including Mortierella alpine, seaweed, and animal-based sources. Its applications span from brain diseases treatment and neuron growth promotion to infant formula production and sports supplements. The market's size is substantial, driven by the rising income growth and awareness of the benefits of arachidonic acid. Innovative technologies, such as in-house manufacturing techniques and the development of plant-based arachidonic acid, are contributing to production cost reduction and expanding the market's reach.
  • End-users, including product manufacturers and consumers, are influenced by educational campaigns promoting the importance of arachidonic acid in various applications, such as depression treatment, physical injuries healing, and infant brain development. Global standards ensure product quality and safety, further fueling market growth. Arachidonic acid is available in both solvent and solid forms, catering to diverse application requirements. The market's direction remains positive, with population growth and increasing demand for arachidonic acid-rich products, such as baby care products and visual acuity enhancers, driving future expansion.

How is this Arachidonic Acid Industry segmented?

The arachidonic acid industry research report provides comprehensive data (region-wise segment analysis), with forecasts and estimates in "USD million" for the period 2025-2029, as well as historical data from 2019-2023 for the following segments.

  • Source
    • Plant source
    • Animal source
  • Form Factor
    • Liquid
    • Powder
    • Capsule
  • Application
    • Pharmaceuticals
    • Dietary supplements
    • Others
  • Geography
    • APAC
      • Australia
      • China
      • India
      • Japan
      • South Korea
    • North America
      • US
      • Canada
    • Europe
      • France
      • Germany
      • UK
    • South America
      • Middle East and Africa

      By Source Insights

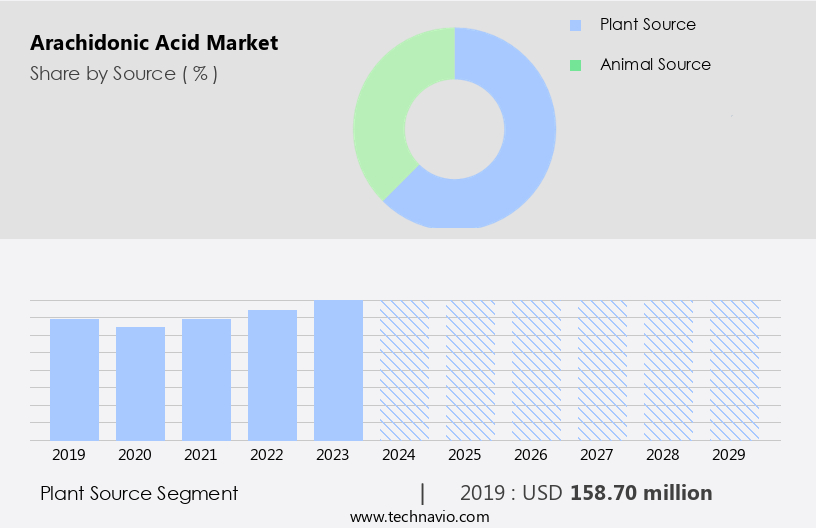
      The plant source segment is estimated to witness significant growth during the forecast period.

      Arachidonic acid, a crucial fatty acid in the Omega-6 group, plays a significant role in physical injuries healing and overall well-being. The global market for arachidonic acid witnessed the plant source segment's dominance in 2024, driven by increasing consumer interest in vegetarian or vegan products. Arachidonic acid is naturally found in various plant sources like nuts, seeds, legumes, grains, and seaweed. The growing preference for natural products and the health benefits associated with arachidonic acid will fuel the demand for plant-source arachidonic acid in various applications, including health supplements, infant formula, sports drinks, and baby care products.

      Arachidonic acid contributes to neuron growth, skeletal system improvement, and cognitive function improvement. Its anti-inflammatory properties make it an essential component in treating muscle inflammation and muscle gain processes. Furthermore, it has applications in treating brain diseases like depression and visual acuity issues. The market's growth is influenced by the population growth, urbanization, and the increasing awareness of arachidonic acid's health benefits. Product manufacturers are focusing on innovative technologies and R&D development to produce arachidonic acid in various forms, such as solid form, oil-based, and solvent form, to cater to diverse end-users, including athletes, bodybuilders, and individuals seeking improved immune and nervous system functions.

      The regulatory acceptance of arachidonic acid supplements and the reduction in production costs will further boost the industry's income growth.

      Arachidonic Acid Market Size

      Get a glance at the market report of share of various segments Request Free Sample

      The Plant source segment was valued at USD 158.70 million in 2019 and showed a gradual increase during the forecast period.

      Regional Analysis

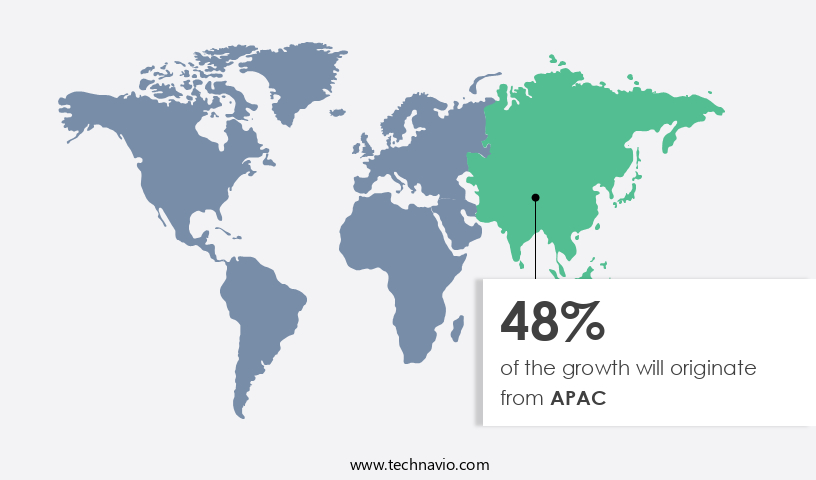
      APAC is estimated to contribute 48% to the growth of the global market during the forecast period.Technavio’s analysts have elaborately explained the regional trends and drivers that shape the market during the forecast period.

      Arachidonic Acid Market Share by Geography

      For more insights on the market size of various regions, Request Free Sample

      Arachidonic acid, a vital fatty acid belonging to the Omega-6 group, plays a significant role in physical injuries healing and supports the growth and development of the nervous and skeletal systems. This essential nutrient is found in various sources, including animal-based and plant-based products, such as meat, dairy, fish, and certain nuts and grains. Arachidonic acid is also used in the production of health supplements, infant formula, and baby care products. The market for arachidonic acid is driven by the increasing demand for functional food supplements and the rise in consumer awareness about its health benefits.

      In-house manufacturing techniques have led to the production of solid form arachidonic acid, making it more accessible to end-users in urban areas. Product applications extend to sports drinks, neuron growth, muscle hypertrophy, visual acuity, and depression treatment. The industry growth is further fueled by innovative technologies and R&D development, leading to the production of oil-based and solvent form arachidonic acid products. Sources of arachidonic acid include Mortierella alpine, seaweed, and animal-derived sources. The market is expected to experience income growth due to the increasing population and the regulatory acceptance of arachidonic acid supplements for infant brain development, cognitive function improvement, and immune system improvement.

      Global standards ensure the production cost reduction, making arachidonic acid accessible to a larger consumer base. Educational campaigns and awareness programs are being initiated to promote the benefits of arachidonic acid for overall well-being, muscle gain process, and nervous system improvement. The market is projected to grow at a steady pace during the forecast period.

      Market Dynamics

      Our researchers analyzed the data with 2024 as the base year, along with the key drivers, trends, and challenges. A holistic analysis of drivers will help companies refine their marketing strategies to gain a competitive advantage.

      What are the key market drivers leading to the rise in the adoption of Arachidonic Acid Industry?

      • Rising awareness about preventative healthcare is the key driver of the market. 

      • The market growth is driven by the rising consumer awareness towards preventative healthcare. The global population is projected to increase by an estimated 2.5 billion people, with most of this growth occurring in urban and semi-urban areas. This demographic shift will directly impact the demand for dietary supplements, as urban populations have a higher consumption rate. In response, dietary supplement manufacturers are forming strategic alliances and making acquisitions to capitalize on this trend.
      • Urbanization, changing lifestyles, and increasing internet penetration are also contributing factors to the market's expansion. As consumers become more health-conscious, the demand for arachidonic acid, a key component of many dietary supplements, is expected to grow.

      What are the market trends shaping the Arachidonic Acid Industry?

      • Increasing demand for baby food products is the upcoming market trend. 

      • Parents' perception of baby foods as healthy and free of harmful ingredients is driving the market growth. With an increasing number of parents preferring packaged baby foods that contain minimal pesticide residue, the demand for organic baby food products is on the rise. The awareness regarding the potential health risks of chemicals, preservatives, hormones, and antibiotics in baby food has led to a significant shift towards organic options.
      • Organic baby food is perceived as a healthier alternative due to its absence of these substances. This trend is expected to continue, contributing to the market expansion during the forecast period. Parents' concerns for their children's health and wellbeing are the primary market drivers.

      What challenges does the Arachidonic Acid Industry face during its growth?

      • Availability of substitutes for arachidonic acid is a key challenge affecting the industry growth. 

      • Arachidonic acid, a polyunsaturated omega-6 fatty acid, faces competition from various substitutes in the market. These alternatives, such as linoleic acid, alpha-linolenic acid, Y-linolenic acid, leukotriene, and docosapentaenoic acid, can replace arachidonic acid in various applications, including foods and beverages and pharmaceuticals. Unlike arachidonic acid, these substitutes are widely available and easily accessible. For instance, linoleic acid, a common polyunsaturated fatty acid in Western diets, is extensively used in food product preparation.
      • In the human body, arachidonic acid is synthesized from linoleic acid. Omega-6 fatty acids, including arachidonic acid, are primarily produced during and after physical activities. The availability and accessibility of these substitutes may impact the growth of the market.

      Exclusive Customer Landscape

      The arachidonic acid market forecasting report includes the adoption lifecycle of the market, covering from the innovator’s stage to the laggard’s stage. It focuses on adoption rates in different regions based on penetration. Furthermore, the arachidonic acid market report also includes key purchase criteria and drivers of price sensitivity to help companies evaluate and develop their market growth analysis strategies.
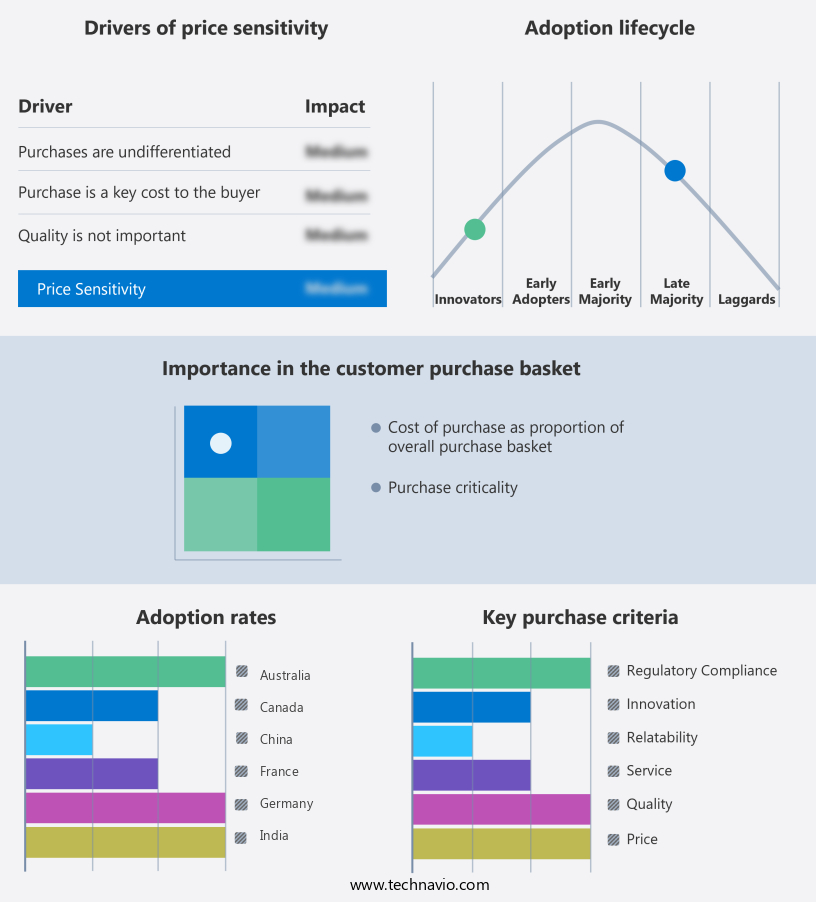
      Arachidonic Acid Market Share by Geography

       Customer Landscape

      Key Companies & Market Insights

      Companies are implementing various strategies, such as strategic alliances, arachidonic acid market forecast, partnerships, mergers and acquisitions, geographical expansion, and product/service launches, to enhance their presence in the industry.

      Avantor Inc. - The company specializes in providing arachidonic acid, an essential fatty acid, for the biosynthesis of prostaglandins, thromboxanes, and leukotrienes. These bioactive lipids play crucial roles in various physiological processes, including inflammation, pain perception, and platelet aggregation. By offering arachidonic acid, the company caters to the research needs of scientists and institutions, enabling them to advance their studies in these areas.

      The industry research and growth report includes detailed analyses of the competitive landscape of the market and information about key companies, including:

      • Avantor Inc.
      • BASF SE
      • Bio Techne Corp.
      • Cargill Inc.
      • Cayman Chemical Co
      • Croda International Plc
      • Kingdomway Nutrition Inc.
      • dsm-firmenich
      • Merck KGaA
      • Parchem Fine and Specialty Chemicals Inc.
      • Perkin Elmer Inc.
      • Selleck Chemicals LLC
      • Sisco Research Laboratories Pvt. Ltd.
      • Spectrum Laboratory Products Inc.
      • Thermo Fisher Scientific Inc.
      • Tokyo Chemical Industry Co. Ltd.
      • Van Eeghen International B.V
      • Wanrun Co. Ltd.
      • Glister Industrial Development Co. Ltd.
      • Zhejiang Tianhecheng Bio technology Shares Co. Ltd.

      Qualitative and quantitative analysis of companies has been conducted to help clients understand the wider business environment as well as the strengths and weaknesses of key industry players. Data is qualitatively analyzed to categorize companies as pure play, category-focused, industry-focused, and diversified; it is quantitatively analyzed to categorize companies as dominant, leading, strong, tentative, and weak.

      Research Analyst Overview

      Arachidonic acid (AA), a crucial member of the omega-6 fatty acid family, plays a significant role in various physiological processes. Its primary functions include promoting neuron growth, improving the skeletal system, and contributing to overall well-being. This essential nutrient is found in both animal and plant sources, making it accessible to a wide range of consumers. In-house manufacturing techniques have been instrumental in the production of arachidonic acid, enabling product manufacturers to maintain quality control and ensure adherence to global standards. The versatility of arachidonic acid has led to its application in various industries, including health supplements, sports drinks, and baby care products.

      The demand for arachidonic acid continues to grow due to increasing awareness of its health benefits. Neuron growth and nervous system improvement are among the primary benefits associated with arachidonic acid consumption. Moreover, its role in muscle hypertrophy and muscle gain processes has made it a popular ingredient in bodybuilding and sports supplements. The market is driven by income growth and population growth, particularly in urban areas. Innovative technologies and R&D development have led to the creation of new products, such as oil-based arachidonic acid products and plant-based arachidonic acid, catering to diverse consumer preferences.

      The use of arachidonic acid extends beyond health and wellness applications. It is also being explored for its potential in treating brain diseases, including depression, and improving visual acuity. Regulatory acceptance of arachidonic acid as a safe and effective ingredient is crucial for the industry's growth. Sources of arachidonic acid include Mortierella alpine, a type of fungus, and various animal and plant-based sources. Seaweed is a promising plant-based source of arachidonic acid, offering potential for sustainable production. The production cost reduction and income growth in the market have made it an attractive investment opportunity for businesses. However, the industry faces challenges such as increasing competition and the need for continuous innovation to meet evolving consumer demands.

      End-users of arachidonic acid products include individuals seeking to improve their overall health, athletes looking to enhance their performance, and parents providing nutrition for their infants. Educational campaigns and awareness initiatives are essential to inform consumers about the benefits of arachidonic acid and its various applications. In summary, the market is a dynamic and growing industry driven by increasing awareness, regulatory acceptance, and innovative technologies. Its applications span various industries, including health supplements, sports drinks, and baby care products, making it a versatile and valuable ingredient for businesses and consumers alike.

      Market Scope

      Report Coverage

      Details

      Page number

      224

      Base year

      2024

      Historic period

      2019-2023

      Forecast period

      2025-2029

      Growth momentum & CAGR

      Accelerate at a CAGR of 9%

      Market growth 2025-2029

      USD 196.1 million

      Market structure

      Fragmented

      YoY growth 2024-2025(%)

      8.0

      Key countries

      US, China, Japan, India, South Korea, Australia, Canada, Germany, UK, and France

      Competitive landscape

      Leading Companies, Market Positioning of Companies, Competitive Strategies, and Industry Risks

      Request Free Sample

      What are the Key Data Covered in this Arachidonic Acid Market Research and Growth Report?

      • CAGR of the Arachidonic Acid industry during the forecast period
      • Detailed information on factors that will drive the growth and forecasting between 2025 and 2029
      • Precise estimation of the size of the market and its contribution of the industry in focus to the parent market
      • Accurate predictions about upcoming growth and trends and changes in consumer behaviour
      • Growth of the market across APAC, North America, Europe, South America, and Middle East and Africa
      • Thorough analysis of the market’s competitive landscape and detailed information about companies
      • Comprehensive analysis of factors that will challenge the arachidonic acid market growth of industry companies

      We can help! Our analysts can customize this arachidonic acid market research report to meet your requirements.

      Get in touch


      1 Executive Summary

      • 1.1 Market overview
        • Executive Summary - Chart on Market Overview
        • Executive Summary - Data Table on Market Overview
        • Executive Summary - Chart on Global Market Characteristics
        • Executive Summary - Chart on Market by Geography
        • Executive Summary - Chart on Market Segmentation by Source
        • Executive Summary - Chart on Market Segmentation by Form Factor
        • Executive Summary - Chart on Market Segmentation by Application
        • Executive Summary - Chart on Incremental Growth
        • Executive Summary - Data Table on Incremental Growth
        • Executive Summary - Chart on Company Market Positioning

      2 Technavio Analysis

      • 2.1 Analysis of price sensitivity, lifecycle, customer purchase basket, adoption rates, and purchase criteria
        • Analysis of price sensitivity, lifecycle, customer purchase basket, adoption rates, and purchase criteria
      • 2.2 Criticality of inputs and Factors of differentiation
        • Overview on criticality of inputs and factors of differentiation
      • 2.3 Factors of disruption
        • Overview on factors of disruption
      • 2.4 Impact of drivers and challenges
        • Impact of drivers and challenges in 2024 and 2029

      3 Market Landscape

      • 3.1 Market ecosystem
        • Parent Market
        • Data Table on - Parent Market
      • 3.2 Market characteristics
        • Market characteristics analysis
      • 3.3 Value chain analysis
        • Value chain analysis

      4 Market Sizing

      • 4.1 Market definition
        • Offerings of companies included in the market definition
      • 4.2 Market segment analysis
        • Market segments
      • 4.3 Market size 2024
        • 4.4 Market outlook: Forecast for 2024-2029
          • Chart on Global - Market size and forecast 2024-2029 ($ million)
          • Data Table on Global - Market size and forecast 2024-2029 ($ million)
          • Chart on Global Market: Year-over-year growth 2024-2029 (%)
          • Data Table on Global Market: Year-over-year growth 2024-2029 (%)

        5 Historic Market Size

        • 5.1 Global Arachidonic Acid Market 2019 - 2023
          • Historic Market Size - Data Table on Global Arachidonic Acid Market 2019 - 2023 ($ million)
        • 5.2 Source segment analysis 2019 - 2023
          • Historic Market Size - Source Segment 2019 - 2023 ($ million)
        • 5.3 Form Factor segment analysis 2019 - 2023
          • Historic Market Size - Form Factor Segment 2019 - 2023 ($ million)
        • 5.4 Application segment analysis 2019 - 2023
          • Historic Market Size - Application Segment 2019 - 2023 ($ million)
        • 5.5 Geography segment analysis 2019 - 2023
          • Historic Market Size - Geography Segment 2019 - 2023 ($ million)
        • 5.6 Country segment analysis 2019 - 2023
          • Historic Market Size - Country Segment 2019 - 2023 ($ million)

        6 Qualitative Analysis

        • 6.1 Impact of AI on global arachidonic acid market

          7 Five Forces Analysis

          • 7.1 Five forces summary
            • Five forces analysis - Comparison between 2024 and 2029
          • 7.2 Bargaining power of buyers
            • Bargaining power of buyers - Impact of key factors 2024 and 2029
          • 7.3 Bargaining power of suppliers
            • Bargaining power of suppliers - Impact of key factors in 2024 and 2029
          • 7.4 Threat of new entrants
            • Threat of new entrants - Impact of key factors in 2024 and 2029
          • 7.5 Threat of substitutes
            • Threat of substitutes - Impact of key factors in 2024 and 2029
          • 7.6 Threat of rivalry
            • Threat of rivalry - Impact of key factors in 2024 and 2029
          • 7.7 Market condition
            • Chart on Market condition - Five forces 2024 and 2029

          8 Market Segmentation by Source

          • 8.1 Market segments
            • Chart on Source - Market share 2024-2029 (%)
            • Data Table on Source - Market share 2024-2029 (%)
          • 8.2 Comparison by Source
            • Chart on Comparison by Source
            • Data Table on Comparison by Source
          • 8.3 Plant source - Market size and forecast 2024-2029
            • Chart on Plant source - Market size and forecast 2024-2029 ($ million)
            • Data Table on Plant source - Market size and forecast 2024-2029 ($ million)
            • Chart on Plant source - Year-over-year growth 2024-2029 (%)
            • Data Table on Plant source - Year-over-year growth 2024-2029 (%)
          • 8.4 Animal source - Market size and forecast 2024-2029
            • Chart on Animal source - Market size and forecast 2024-2029 ($ million)
            • Data Table on Animal source - Market size and forecast 2024-2029 ($ million)
            • Chart on Animal source - Year-over-year growth 2024-2029 (%)
            • Data Table on Animal source - Year-over-year growth 2024-2029 (%)
          • 8.5 Market opportunity by Source
            • Market opportunity by Source ($ million)
            • Data Table on Market opportunity by Source ($ million)

          9 Market Segmentation by Form Factor

          • 9.1 Market segments
            • Chart on Form Factor - Market share 2024-2029 (%)
            • Data Table on Form Factor - Market share 2024-2029 (%)
          • 9.2 Comparison by Form Factor
            • Chart on Comparison by Form Factor
            • Data Table on Comparison by Form Factor
          • 9.3 Liquid - Market size and forecast 2024-2029
            • Chart on Liquid - Market size and forecast 2024-2029 ($ million)
            • Data Table on Liquid - Market size and forecast 2024-2029 ($ million)
            • Chart on Liquid - Year-over-year growth 2024-2029 (%)
            • Data Table on Liquid - Year-over-year growth 2024-2029 (%)
          • 9.4 Powder - Market size and forecast 2024-2029
            • Chart on Powder - Market size and forecast 2024-2029 ($ million)
            • Data Table on Powder - Market size and forecast 2024-2029 ($ million)
            • Chart on Powder - Year-over-year growth 2024-2029 (%)
            • Data Table on Powder - Year-over-year growth 2024-2029 (%)
          • 9.5 Capsule - Market size and forecast 2024-2029
            • Chart on Capsule - Market size and forecast 2024-2029 ($ million)
            • Data Table on Capsule - Market size and forecast 2024-2029 ($ million)
            • Chart on Capsule - Year-over-year growth 2024-2029 (%)
            • Data Table on Capsule - Year-over-year growth 2024-2029 (%)
          • 9.6 Market opportunity by Form Factor
            • Market opportunity by Form Factor ($ million)
            • Data Table on Market opportunity by Form Factor ($ million)

          10 Market Segmentation by Application

          • 10.1 Market segments
            • Chart on Application - Market share 2024-2029 (%)
            • Data Table on Application - Market share 2024-2029 (%)
          • 10.2 Comparison by Application
            • Chart on Comparison by Application
            • Data Table on Comparison by Application
          • 10.3 Pharmaceuticals - Market size and forecast 2024-2029
            • Chart on Pharmaceuticals - Market size and forecast 2024-2029 ($ million)
            • Data Table on Pharmaceuticals - Market size and forecast 2024-2029 ($ million)
            • Chart on Pharmaceuticals - Year-over-year growth 2024-2029 (%)
            • Data Table on Pharmaceuticals - Year-over-year growth 2024-2029 (%)
          • 10.4 Dietary supplements - Market size and forecast 2024-2029
            • Chart on Dietary supplements - Market size and forecast 2024-2029 ($ million)
            • Data Table on Dietary supplements - Market size and forecast 2024-2029 ($ million)
            • Chart on Dietary supplements - Year-over-year growth 2024-2029 (%)
            • Data Table on Dietary supplements - Year-over-year growth 2024-2029 (%)
          • 10.5 Others - Market size and forecast 2024-2029
            • Chart on Others - Market size and forecast 2024-2029 ($ million)
            • Data Table on Others - Market size and forecast 2024-2029 ($ million)
            • Chart on Others - Year-over-year growth 2024-2029 (%)
            • Data Table on Others - Year-over-year growth 2024-2029 (%)
          • 10.6 Market opportunity by Application
            • Market opportunity by Application ($ million)
            • Data Table on Market opportunity by Application ($ million)

          11 Customer Landscape

          • 11.1 Customer landscape overview
            • Analysis of price sensitivity, lifecycle, customer purchase basket, adoption rates, and purchase criteria

          12 Geographic Landscape

          • 12.1 Geographic segmentation
            • Chart on Market share by geography 2024-2029 (%)
            • Data Table on Market share by geography 2024-2029 (%)
          • 12.2 Geographic comparison
            • Chart on Geographic comparison
            • Data Table on Geographic comparison
          • 12.3 APAC - Market size and forecast 2024-2029
            • Chart on APAC - Market size and forecast 2024-2029 ($ million)
            • Data Table on APAC - Market size and forecast 2024-2029 ($ million)
            • Chart on APAC - Year-over-year growth 2024-2029 (%)
            • Data Table on APAC - Year-over-year growth 2024-2029 (%)
          • 12.4 North America - Market size and forecast 2024-2029
            • Chart on North America - Market size and forecast 2024-2029 ($ million)
            • Data Table on North America - Market size and forecast 2024-2029 ($ million)
            • Chart on North America - Year-over-year growth 2024-2029 (%)
            • Data Table on North America - Year-over-year growth 2024-2029 (%)
          • 12.5 Europe - Market size and forecast 2024-2029
            • Chart on Europe - Market size and forecast 2024-2029 ($ million)
            • Data Table on Europe - Market size and forecast 2024-2029 ($ million)
            • Chart on Europe - Year-over-year growth 2024-2029 (%)
            • Data Table on Europe - Year-over-year growth 2024-2029 (%)
          • 12.6 South America - Market size and forecast 2024-2029
            • Chart on South America - Market size and forecast 2024-2029 ($ million)
            • Data Table on South America - Market size and forecast 2024-2029 ($ million)
            • Chart on South America - Year-over-year growth 2024-2029 (%)
            • Data Table on South America - Year-over-year growth 2024-2029 (%)
          • 12.7 Middle East and Africa - Market size and forecast 2024-2029
            • Chart on Middle East and Africa - Market size and forecast 2024-2029 ($ million)
            • Data Table on Middle East and Africa - Market size and forecast 2024-2029 ($ million)
            • Chart on Middle East and Africa - Year-over-year growth 2024-2029 (%)
            • Data Table on Middle East and Africa - Year-over-year growth 2024-2029 (%)
          • 12.8 US - Market size and forecast 2024-2029
            • Chart on US - Market size and forecast 2024-2029 ($ million)
            • Data Table on US - Market size and forecast 2024-2029 ($ million)
            • Chart on US - Year-over-year growth 2024-2029 (%)
            • Data Table on US - Year-over-year growth 2024-2029 (%)
          • 12.9 China - Market size and forecast 2024-2029
            • Chart on China - Market size and forecast 2024-2029 ($ million)
            • Data Table on China - Market size and forecast 2024-2029 ($ million)
            • Chart on China - Year-over-year growth 2024-2029 (%)
            • Data Table on China - Year-over-year growth 2024-2029 (%)
          • 12.10 Japan - Market size and forecast 2024-2029
            • Chart on Japan - Market size and forecast 2024-2029 ($ million)
            • Data Table on Japan - Market size and forecast 2024-2029 ($ million)
            • Chart on Japan - Year-over-year growth 2024-2029 (%)
            • Data Table on Japan - Year-over-year growth 2024-2029 (%)
          • 12.11 India - Market size and forecast 2024-2029
            • Chart on India - Market size and forecast 2024-2029 ($ million)
            • Data Table on India - Market size and forecast 2024-2029 ($ million)
            • Chart on India - Year-over-year growth 2024-2029 (%)
            • Data Table on India - Year-over-year growth 2024-2029 (%)
          • 12.12 South Korea - Market size and forecast 2024-2029
            • Chart on South Korea - Market size and forecast 2024-2029 ($ million)
            • Data Table on South Korea - Market size and forecast 2024-2029 ($ million)
            • Chart on South Korea - Year-over-year growth 2024-2029 (%)
            • Data Table on South Korea - Year-over-year growth 2024-2029 (%)
          • 12.13 Canada - Market size and forecast 2024-2029
            • Chart on Canada - Market size and forecast 2024-2029 ($ million)
            • Data Table on Canada - Market size and forecast 2024-2029 ($ million)
            • Chart on Canada - Year-over-year growth 2024-2029 (%)
            • Data Table on Canada - Year-over-year growth 2024-2029 (%)
          • 12.14 Australia - Market size and forecast 2024-2029
            • Chart on Australia - Market size and forecast 2024-2029 ($ million)
            • Data Table on Australia - Market size and forecast 2024-2029 ($ million)
            • Chart on Australia - Year-over-year growth 2024-2029 (%)
            • Data Table on Australia - Year-over-year growth 2024-2029 (%)
          • 12.15 Germany - Market size and forecast 2024-2029
            • Chart on Germany - Market size and forecast 2024-2029 ($ million)
            • Data Table on Germany - Market size and forecast 2024-2029 ($ million)
            • Chart on Germany - Year-over-year growth 2024-2029 (%)
            • Data Table on Germany - Year-over-year growth 2024-2029 (%)
          • 12.16 UK - Market size and forecast 2024-2029
            • Chart on UK - Market size and forecast 2024-2029 ($ million)
            • Data Table on UK - Market size and forecast 2024-2029 ($ million)
            • Chart on UK - Year-over-year growth 2024-2029 (%)
            • Data Table on UK - Year-over-year growth 2024-2029 (%)
          • 12.17 France - Market size and forecast 2024-2029
            • Chart on France - Market size and forecast 2024-2029 ($ million)
            • Data Table on France - Market size and forecast 2024-2029 ($ million)
            • Chart on France - Year-over-year growth 2024-2029 (%)
            • Data Table on France - Year-over-year growth 2024-2029 (%)
          • 12.18 Market opportunity by geography
            • Market opportunity by geography ($ million)
            • Data Tables on Market opportunity by geography ($ million)

          13 Drivers, Challenges, and Opportunity/Restraints

          • 13.1 Market drivers
            • 13.2 Market challenges
              • 13.3 Impact of drivers and challenges
                • Impact of drivers and challenges in 2024 and 2029
              • 13.4 Market opportunities/restraints

                14 Competitive Landscape

                • 14.1 Overview
                  • 14.2 Competitive Landscape
                    • Overview on criticality of inputs and factors of differentiation
                  • 14.3 Landscape disruption
                    • Overview on factors of disruption
                  • 14.4 Industry risks
                    • Impact of key risks on business

                  15 Competitive Analysis

                  • 15.1 Companies profiled
                    • Companies covered
                  • 15.2 Company ranking index
                    • Company ranking index
                  • 15.3 Market positioning of companies
                    • Matrix on companies position and classification
                  • 15.4 Avantor Inc.
                    • Avantor Inc. - Overview
                    • Avantor Inc. - Business segments
                    • Avantor Inc. - Key news
                    • Avantor Inc. - Key offerings
                    • Avantor Inc. - Segment focus
                    • SWOT
                  • 15.5 BASF SE
                    • BASF SE - Overview
                    • BASF SE - Business segments
                    • BASF SE - Key news
                    • BASF SE - Key offerings
                    • BASF SE - Segment focus
                    • SWOT
                  • 15.6 Bio Techne Corp.
                    • Bio Techne Corp. - Overview
                    • Bio Techne Corp. - Business segments
                    • Bio Techne Corp. - Key news
                    • Bio Techne Corp. - Key offerings
                    • Bio Techne Corp. - Segment focus
                    • SWOT
                  • 15.7 Cargill Inc.
                    • Cargill Inc. - Overview
                    • Cargill Inc. - Product / Service
                    • Cargill Inc. - Key offerings
                    • SWOT
                  • 15.8 Cayman Chemical Co
                    • Cayman Chemical Co - Overview
                    • Cayman Chemical Co - Product / Service
                    • Cayman Chemical Co - Key offerings
                    • SWOT
                  • 15.9 Croda International Plc
                    • Croda International Plc - Overview
                    • Croda International Plc - Business segments
                    • Croda International Plc - Key news
                    • Croda International Plc - Key offerings
                    • Croda International Plc - Segment focus
                    • SWOT
                  • 15.10 Kingdomway Nutrition Inc.
                    • Kingdomway Nutrition Inc. - Overview
                    • Kingdomway Nutrition Inc. - Product / Service
                    • Kingdomway Nutrition Inc. - Key offerings
                    • SWOT
                  • 15.11 dsm-firmenich
                    • dsm-firmenich - Overview
                    • dsm-firmenich - Business segments
                    • dsm-firmenich - Key news
                    • dsm-firmenich - Key offerings
                    • dsm-firmenich - Segment focus
                    • SWOT
                  • 15.12 Merck KGaA
                    • Merck KGaA - Overview
                    • Merck KGaA - Business segments
                    • Merck KGaA - Key news
                    • Merck KGaA - Key offerings
                    • Merck KGaA - Segment focus
                    • SWOT
                  • 15.13 Parchem Fine and Specialty Chemicals Inc.
                    • Parchem Fine and Specialty Chemicals Inc. - Overview
                    • Parchem Fine and Specialty Chemicals Inc. - Product / Service
                    • Parchem Fine and Specialty Chemicals Inc. - Key offerings
                    • SWOT
                  • 15.14 Perkin Elmer Inc.
                    • Perkin Elmer Inc. - Overview
                    • Perkin Elmer Inc. - Business segments
                    • Perkin Elmer Inc. - Key news
                    • Perkin Elmer Inc. - Key offerings
                    • Perkin Elmer Inc. - Segment focus
                    • SWOT
                  • 15.15 Selleck Chemicals LLC
                    • Selleck Chemicals LLC - Overview
                    • Selleck Chemicals LLC - Product / Service
                    • Selleck Chemicals LLC - Key offerings
                    • SWOT
                  • 15.16 Spectrum Laboratory Products Inc.
                    • Spectrum Laboratory Products Inc. - Overview
                    • Spectrum Laboratory Products Inc. - Product / Service
                    • Spectrum Laboratory Products Inc. - Key news
                    • Spectrum Laboratory Products Inc. - Key offerings
                    • SWOT
                  • 15.17 Thermo Fisher Scientific Inc.
                    • Thermo Fisher Scientific Inc. - Overview
                    • Thermo Fisher Scientific Inc. - Business segments
                    • Thermo Fisher Scientific Inc. - Key news
                    • Thermo Fisher Scientific Inc. - Key offerings
                    • Thermo Fisher Scientific Inc. - Segment focus
                    • SWOT
                  • 15.18 Wanrun Co. Ltd.
                    • Wanrun Co. Ltd. - Overview
                    • Wanrun Co. Ltd. - Product / Service
                    • Wanrun Co. Ltd. - Key offerings
                    • SWOT

                  16 Appendix

                  • 16.1 Scope of the report
                    • 16.2 Inclusions and exclusions checklist
                      • Inclusions checklist
                      • Exclusions checklist
                    • 16.3 Currency conversion rates for US$
                      • Currency conversion rates for US$
                    • 16.4 Research methodology
                      • Research methodology
                    • 16.5 Data procurement
                      • Information sources
                    • 16.6 Data validation
                      • Data validation
                    • 16.7 Validation techniques employed for market sizing
                      • Validation techniques employed for market sizing
                    • 16.8 Data synthesis
                      • Data synthesis
                    • 16.9 360 degree market analysis
                      • 360 degree market analysis
                    • 16.10 List of abbreviations
                      • List of abbreviations

                    Research Methodology

                    Technavio presents a detailed picture of the market by way of study, synthesis, and summation of data from multiple sources. The analysts have presented the various facets of the market with a particular focus on identifying the key industry influencers. The data thus presented is comprehensive, reliable, and the result of extensive research, both primary and secondary.

                    INFORMATION SOURCES

                    Primary sources

                    • Manufacturers and suppliers
                    • Channel partners
                    • Industry experts
                    • Strategic decision makers

                    Secondary sources

                    • Industry journals and periodicals
                    • Government data
                    • Financial reports of key industry players
                    • Historical data
                    • Press releases

                    DATA ANALYSIS

                    Data Synthesis

                    • Collation of data
                    • Estimation of key figures
                    • Analysis of derived insights

                    Data Validation

                    • Triangulation with data models
                    • Reference against proprietary databases
                    • Corroboration with industry experts

                    REPORT WRITING

                    Qualitative

                    • Market drivers
                    • Market challenges
                    • Market trends
                    • Five forces analysis

                    Quantitative

                    • Market size and forecast
                    • Market segmentation
                    • Geographical insights
                    • Competitive landscape

                    Interested in this report?

                    Get your sample now to see our research methodology and insights!

                    Download Now

                    Frequently Asked Questions

                    Arachidonic Acid market growth will increase by $ 196.1 mn during 2025-2029.

                    The Arachidonic Acid market is expected to grow at a CAGR of 9% during 2025-2029.

                    Arachidonic Acid market is segmented by Source( Plant source, Animal source) Form Factor( Liquid, Powder, Capsule) Application( Pharmaceuticals, Dietary supplements, Others, South America, Middle East and Africa)

                    Avantor Inc., BASF SE, Bio Techne Corp., Cargill Inc., Cayman Chemical Co, Croda International Plc, Kingdomway Nutrition Inc., dsm-firmenich, Merck KGaA, Parchem Fine and Specialty Chemicals Inc., Perkin Elmer Inc., Selleck Chemicals LLC, Sisco Research Laboratories Pvt. Ltd., Spectrum Laboratory Products Inc., Thermo Fisher Scientific Inc., Tokyo Chemical Industry Co. Ltd., Van Eeghen International B.V, Wanrun Co. Ltd., Glister Industrial Development Co. Ltd., Zhejiang Tianhecheng Bio technology Shares Co. Ltd. are a few of the key vendors in the Arachidonic Acid market.

                    APAC will register the highest growth rate of 48% among the other regions. Therefore, the Arachidonic Acid market in APAC is expected to garner significant business opportunities for the vendors during the forecast period.

                    US, China, Japan, India, South Korea, Australia, Canada, Germany, UK, France

                    • Rising awareness about preventative healthcareThe increase in global consumer awareness regarding preventative medicine is one of the primary factors driving the demand for arachidonic acid. Growing urbanization is the driving factor this market.
                    • changing consumer lifestyles is the driving factor this market.
                    • and increasing Internet penetration are some of the key supporting factors to the growth of the arachidonic acid market 2050 is the driving factor this market.
                    • an additional 2.5 billion people are estimated to populate urban and semi-urban areas. The rising urban population will have a direct impact on the demand for dietary supplements as the consumption of dietary supplements is high among the urban population.To capitalize on the increasing demand for dietary supplements in urban and semi-urban areas is the driving factor this market.
                    • manufacturers of dietary supplements have increased strategic alliances and acquisitions. These manufacturers are looking to expand their product portfolio and geographical presence. The intake of dietary supplements can ensure good health by reinforcing the immune system of the body and lowering the chances of acquiring diseases is the driving factor this market.
                    • allergies is the driving factor this market.
                    • and other diseases.Consumers are leveraging online medical health portals and health organization websites instead of turning to doctors and medical practitioners to gain an understanding of their health conditions and for a second opinion. Dietary supplement manufacturers are providing product-related information on online portals is the driving factor this market.
                    • which is increasing consumer awareness. The abovementioned factors will drive the global arachidonic acid market during the forecast period. is the driving factor this market.

                    The Arachidonic Acid market vendors should focus on grabbing business opportunities from the Plant source segment as it accounted for the largest market share in the base year.
                    RIA - Research AI Assistant
                    Ask RIA