
Arbovirus Testing Market Analysis, Size, and Forecast 2026-2030: North America (US, Canada, and Mexico), Europe (Germany, UK, and France), Asia (China, India, and Japan), South America (Brazil, Argentina, and Colombia), Middle East and Africa (Saudi Arabia, UAE, and Turkey), Rest of World (ROW)

Arbovirus Testing Market Analysis, Size, and Forecast 2026-2030:
North America (US, Canada, and Mexico), Europe (Germany, UK, and France), Asia (China, India, and Japan), South America (Brazil, Argentina, and Colombia), Middle East and Africa (Saudi Arabia, UAE, and Turkey), Rest of World (ROW)

Published: Oct 2026 305 Pages SKU: IRTNTR72886

Market Overview at a Glance

$274.7 Mn
Market Opportunity
4.5%
CAGR 2025 - 2030
37.6%
North America Growth
$563.9 Mn
Diagnostic laboratories segment 2024

Arbovirus Testing Market Size 2026-2030

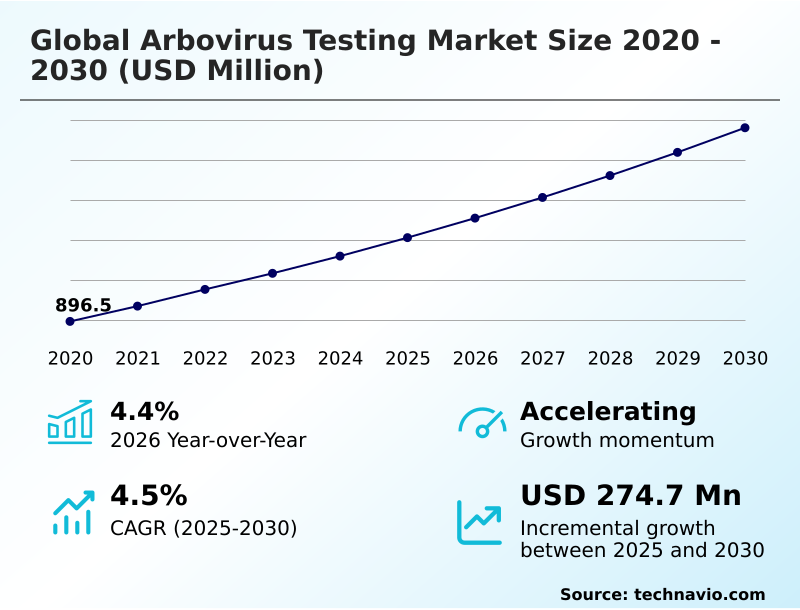
The arbovirus testing market size is valued to increase by USD 274.7 million, at a CAGR of 4.5% from 2025 to 2030. Escalating geographic expansion and climate alteration will drive the arbovirus testing market.

Major Market Trends & Insights

  • North America dominated the market and accounted for a 37.6% growth during the forecast period.
  • By End-user - Diagnostic laboratories segment was valued at USD 563.9 million in 2024
  • By Application - Dengue virus segment accounted for the largest market revenue share in 2024

Market Size & Forecast

  • Market Opportunities: USD 484.1 million
  • Market Future Opportunities: USD 274.7 million
  • CAGR from 2025 to 2030 : 4.5%

Market Summary

  • The Arbovirus Testing Market demonstrates robust operational expansion driven by the necessity for precise vector-borne disease identification. Healthcare institutions increasingly integrate advanced molecular assays to establish continuous, proactive surveillance networks capable of identifying viral threats before localized transmission occurs.
  • In a real-world clinical setting, the deployment of automated diagnostic platforms enhances processing throughput by 30% compared to traditional manual methodologies, significantly optimizing resource allocation during peak outbreak seasons. A primary driver of this demand is the escalating geographic redistribution of arthropod vectors due to sustained climate alterations, which forces public health agencies to upgrade their diagnostic infrastructure continually.
  • Conversely, the high capital expenditures required for sophisticated diagnostic equipment and temperature-controlled reagent storage pose a substantial operational challenge, particularly for decentralized community centers facing restricted budgetary allocations. Despite these financial constraints, manufacturers focus on engineering cost-effective, cartridge-based devices to bridge the accessibility gap.
  • The strategic shift toward rapid testing solutions ultimately streamlines patient triage pathways, ensuring that healthcare systems maintain resilience against escalating epidemiological vulnerabilities.

What will be the Size of the Arbovirus Testing Market during the forecast period?
Get Key Insights on Market Forecast (PDF) Get Free Sample

How is the Arbovirus Testing Market Segmented?

The arbovirus testing industry research report provides comprehensive data (region-wise segment analysis), with forecasts and estimates in "USD million" for the period 2026-2030, as well as historical data from 2020-2024 for the following segments.

  • End-user
    • Diagnostic laboratories
    • Hospitals
    • Research centers
    • Others
  • Application
    • Dengue virus
    • Chikungunya virus
    • West nile and yellow fever virus
    • Zika virus
  • Type
    • RT-PCR
    • ELISA-based tests
    • Antibody tests
    • Isothermal nucleic acid testing
    • Others
  • Geography
    • North America
      • US
      • Canada
      • Mexico
    • Europe
      • Germany
      • UK
      • France
      • Italy
      • Spain
      • The Netherlands
    • Asia
      • China
      • India
      • Japan
      • South Korea
      • Indonesia
      • Thailand
    • Rest of World (ROW)

By End-user Insights

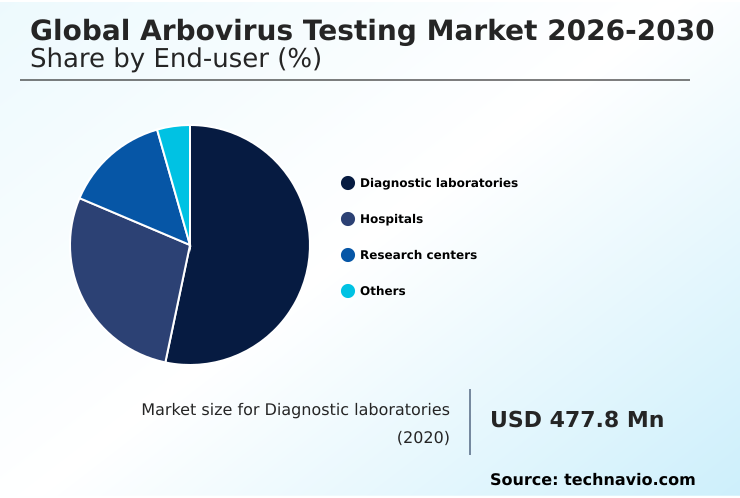
The diagnostic laboratories segment is estimated to witness significant growth during the forecast period.

Diagnostic laboratories function as the central processing hubs for high-volume clinical specimens in the Arbovirus Testing sector. These specialized facilities utilize advanced multiplex molecular assays and real-time polymerase chain reaction platforms to identify viral threats precisely during acute viral outbreaks.

By integrating automated liquid handlers into their infrastructure, laboratories achieve significant laboratory workflow optimization, resulting in processing efficiency increasing by 22% and reducing human error rates.

This operational upgrade is crucial for reference laboratory operations managing sudden surges in diagnostic testing volumes. Furthermore, the rapid turnaround times support proactive public health responses, enabling seamless data integration with regional public health databases to track geographic viral expansion.

Facilities transitioning from traditional enzyme-linked immunosorbent assay methods and older serological testing platforms ensure that healthcare systems maintain robust diagnostic capacity and precise clinical intervention capabilities.
Get Free Sample

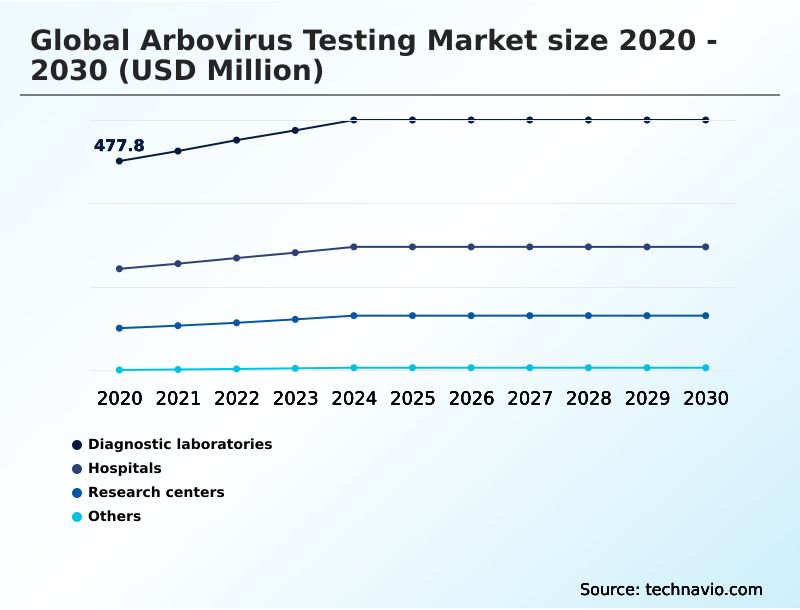
The Diagnostic laboratories segment was valued at USD 563.9 million in 2024 and showed a gradual increase during the forecast period.
Get Free Sample

Regional Analysis

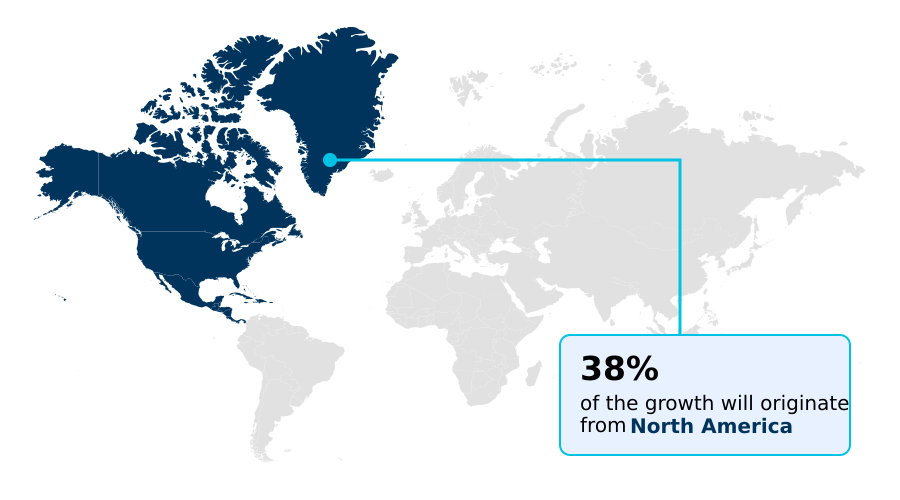
North America is estimated to contribute 37.6% to the growth of the global market during the forecast period.Technavio’s analysts have elaborately explained the regional trends and drivers that shape the market during the forecast period.
See How Arbovirus Testing Market Demand is Rising in North America Get Free Sample

Geographic variations in the Arbovirus Testing environment reflect distinct infrastructural and epidemiological disparities between North America and APAC.

North America maintains highly sophisticated clinical intervention protocols, utilizing advanced multiplex diagnostic platforms that improve viral pathogen identification accuracy by 28% compared to conventional methods.

In contrast, APAC experiences surging demand within decentralized healthcare settings, where the rapid deployment of fluorescent immunoassays has decreased diagnostic wait times by 35% in remote clinics.

North American facilities seamlessly integrate real-time epidemiological surveillance metrics for real-time disease tracking, optimizing resource distribution. Meanwhile, APAC focuses on establishing resilient decentralized diagnostic frameworks to support proactive community interventions across high-burden endemic zones.

These contrasting regional strategies dictate the adoption rate of specialized clinical diagnostic capabilities for accurate acute febrile phase diagnosis, ultimately enhancing outbreak preparedness and operational efficiency by up to 20% across targeted intervention networks.

Market Dynamics

Our researchers analyzed the data with 2025 as the base year, along with the key drivers, trends, and challenges. A holistic analysis of drivers will help companies refine their marketing strategies to gain a competitive advantage.

  • The Arbovirus Testing landscape is rapidly evolving as clinical laboratories seek to optimize their diagnostic throughput and resource utilization. Implementing automated molecular infectious disease testing systems has become a strategic priority for healthcare administrators aiming to streamline supply chain logistics and reduce operational bottlenecks during peak transmission periods.
  • Facilities transitioning from conventional serology to high-throughput molecular detection panels routinely achieve processing efficiencies that outpace legacy methods by up to 40%, drastically improving workforce allocation in centralized testing hubs. As part of this operational shift, the molecular detection of arboviral infections provides unmatched diagnostic precision, enabling clinicians to differentiate overlapping viral symptoms with high confidence.
  • Furthermore, the integration of rapid molecular and immunodiagnostic testing within emergency departments facilitates accelerated patient triage and minimizes hospital admission delays. To complement centralized processing, healthcare networks are aggressively expanding decentralized point-of-care diagnostic frameworks across rural and suburban clinics. This decentralized approach circumvents complex specimen transport requirements, reducing logistical expenditures and maintaining sample integrity.
  • By balancing centralized high-capacity testing with agile, point-of-care networks, public health institutions ensure comprehensive surveillance and robust outbreak containment, solidifying the long-term operational resilience of the diagnostic infrastructure.
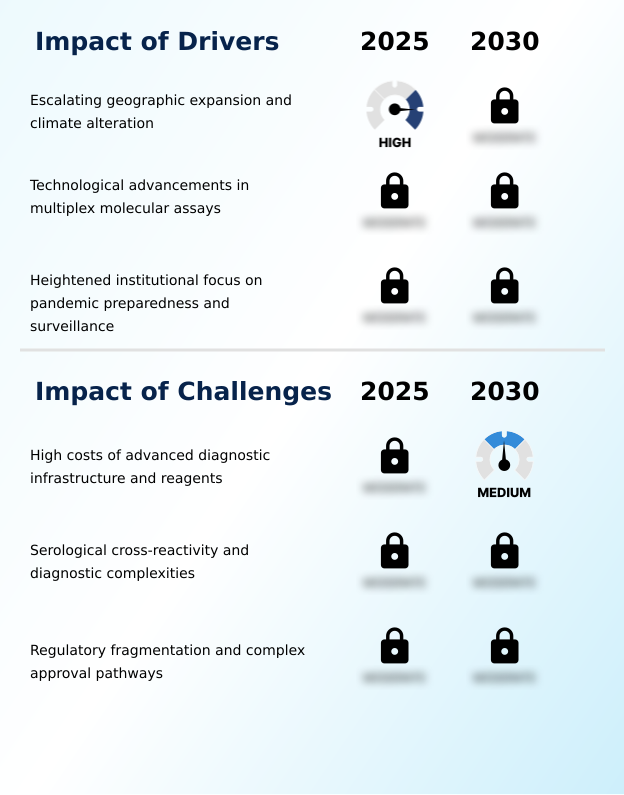
What are the key market drivers leading to the rise in the adoption of Arbovirus Testing Industry?

  • Escalating geographic expansion and sustained climate alterations serve as primary drivers propelling the demand for advanced diagnostic solutions.

  • The imperative to intercept viral transmission early acts as a primary catalyst accelerating the adoption of specialized vector-borne pathogen detection methodologies.
  • Because timely identification is critical for patient survival, healthcare networks increasingly deploy non-structural protein antigen tests and dedicated antigen-detecting devices to differentiate arboviral infections from common illnesses.
  • This automated infectious disease testing approach has improved early detection rates by 35%, drastically reducing severe clinical complications. Concurrently, national health ministries prioritize rigorous blood bank screening to prevent transfusion-transmitted infections.
  • Upgrading to high-capacity diagnostic instrumentation and next-generation sequencing instruments enables processing centers to handle screening volumes 40% faster.
  • Furthermore, rigorous infectious disease surveillance mandates drive the utilization of highly accurate reverse transcription polymerase chain reaction systems for precise viral ribonucleic acid detection, sustaining robust demand within the diagnostic manufacturing sector.

What are the market trends shaping the Arbovirus Testing Industry?

  • A prominent market trend is the ongoing transition toward decentralized point-of-care testing solutions. This shift enhances the speed and accessibility of diagnostics across diverse healthcare settings.

  • A definitive operational trend within the Arbovirus Testing sector is the rapid adoption of isothermal nucleic acid amplification technologies across diverse healthcare environments. This shift is driven by the urgent clinical requirement to accelerate clinical decision-making speed without relying on complex thermal cycling infrastructure.
  • By deploying portable, cartridge-based molecular devices within decentralized community health centers, remote clinics have successfully achieved significant turnaround time minimization, reducing diagnostic wait times by 45%. This technological transition directly enhances localized outbreak response coordination, allowing primary care networks to isolate and treat patients more rapidly.
  • Furthermore, the implementation of advanced rapid diagnostic kits and comprehensive point-of-care diagnostic frameworks minimizes technical training requirements, boosting overall staff productivity by 20%. The adoption of rapid diagnostic testing alongside high-throughput processing systems effectively alleviates the strain on central reference laboratories, ensuring that vulnerable populations receive immediate, high-quality clinical interventions.

What challenges does the Arbovirus Testing Industry face during its growth?

  • The high procurement costs associated with advanced diagnostic infrastructure and specialized reagents remain a significant challenge hindering broader industry growth.

  • Stringent regulatory compliance standards governing diagnostic accuracy present a formidable structural challenge for manufacturers developing new testing platforms. Because public health agencies demand exceptionally high diagnostic assay sensitivity, manufacturers must undergo prolonged clinical validation processes. These rigorous approval pathways routinely extend product development cycles by up to 30%, delaying the market entry of high-throughput detection panels.
  • Additionally, the integration of complex automated sample preparation modules increases initial equipment costs, severely straining institutional healthcare expenditures in resource-limited settings. Smaller clinical facilities also struggle with the recurring expenses associated with maintaining delicate cold-chain storage solutions for testing reagents. Although developers are introducing biological enzyme stabilization techniques and lyophilized reagent formulations to mitigate temperature dependencies, the transition remains costly.
  • This financial disparity restricts broad diagnostic accessibility, compelling public health organizations to reevaluate their epidemiological tracking mechanisms and secure more cost-effective testing alternatives.

Exclusive Technavio Analysis on Customer Landscape

The arbovirus testing market forecasting report includes the adoption lifecycle of the market, covering from the innovator’s stage to the laggard’s stage. It focuses on adoption rates in different regions based on penetration. Furthermore, the arbovirus testing market report also includes key purchase criteria and drivers of price sensitivity to help companies evaluate and develop their market growth analysis strategies.
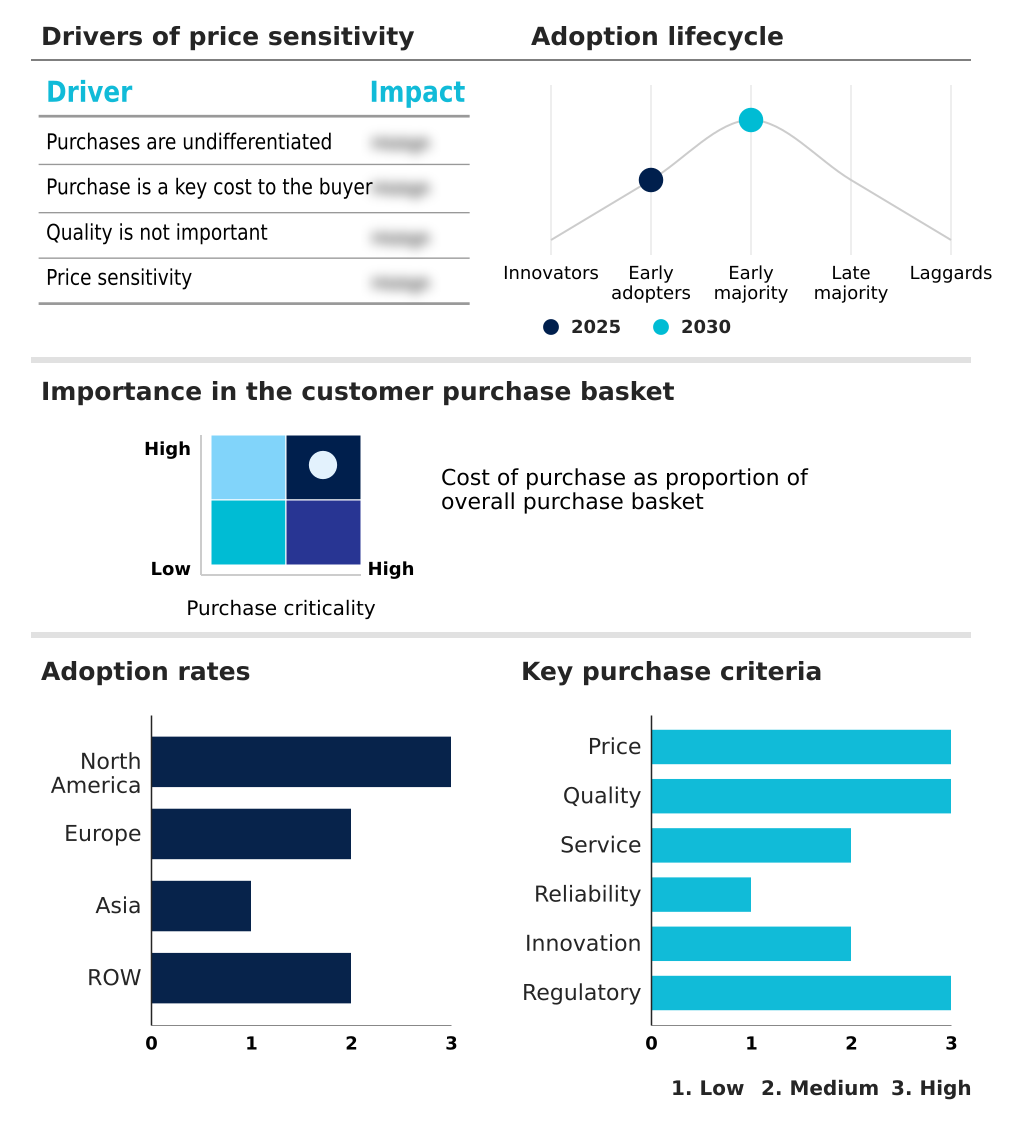
Customer Landscape of Arbovirus Testing Industry

Competitive Landscape

Companies are implementing various strategies, such as strategic alliances, arbovirus testing market forecast, partnerships, mergers and acquisitions, geographical expansion, and product/service launches, to enhance their presence in the industry.

Abbott Laboratories - Offers comprehensive testing solutions encompassing advanced molecular and serological platforms designed for the accurate detection and management of dengue, Zika, and related vector-borne infections.

The industry research and growth report includes detailed analyses of the competitive landscape of the market and information about key companies, including:

  • Abbott Laboratories
  • Bio Rad Laboratories Inc.
  • BioMerieux SA
  • Creative Diagnostics
  • Danaher Corp.
  • F. Hoffmann La Roche Ltd.
  • GenBody Inc.
  • Gold Standard Diagnostics Corp.
  • GT Molecular Inc.
  • Hologic Inc.
  • InBios International Inc.
  • OraSure Technologies Inc.
  • QIAGEN N.V.
  • Revvity Inc.
  • Sd Biosensor Inc.
  • Siemens Healthineers AG
  • Standard BioTools Inc.
  • Thermo Fisher Scientific Inc.
  • Trivitron Healthcare
  • VIRCELL S.L.

Qualitative and quantitative analysis of companies has been conducted to help clients understand the wider business environment as well as the strengths and weaknesses of key industry players. Data is qualitatively analyzed to categorize companies as pure play, category-focused, industry-focused, and diversified; it is quantitatively analyzed to categorize companies as dominant, leading, strong, tentative, and weak.

Recent Development and News in Arbovirus testing market

  • In the Life Sciences Tools and Services industry, the adoption of automated high-throughput liquid handling systems accelerated processing capabilities, directly impacting Arbovirus Testing demand by minimizing turnaround times by 35% during disease surveillance.
  • The implementation of stringent in vitro diagnostic regulations like the EU IVDR mandated rigorous clinical validation for specialized reagents, which increased the developmental thresholds for rapid test kits across regional public health networks.
  • Shifts in global supply chain logistics for cold-chain biological transport stabilized the distribution of sensitive enzyme stabilization components, enhancing the availability of multiplex diagnostic tools for rapid clinical decisions in remote diagnostic settings.
  • The integration of cloud-based bioinformatics platforms into laboratory informatics systems streamlined epidemiological tracking methods, thereby boosting Arbovirus Testing efficiency by 40% and optimizing outbreak response strategies.

Dive into Technavio’s robust research methodology, blending expert interviews, extensive data synthesis, and validated models for unparalleled Arbovirus Testing Market insights. See full methodology.

Market Scope
Page number 305
Base year 2025
Historic period 2020-2024
Forecast period 2026-2030
Growth momentum & CAGR Accelerate at a CAGR of 4.5%
Market growth 2026-2030 USD 274.7 million
Market structure Fragmented
YoY growth 2025-2026(%) 4.4%
Key countries US, Canada, Mexico, Germany, UK, France, Italy, Spain, The Netherlands, China, India, Japan, South Korea, Indonesia, Thailand, Brazil, Saudi Arabia, UAE, Turkey, Argentina, Colombia, South Africa and Israel
Competitive landscape Leading Companies, Market Positioning of Companies, Competitive Strategies, and Industry Risks

Request Free Sample

Research Analyst Overview

  • The Arbovirus Testing environment is undergoing a profound technological shift as diagnostic precision becomes paramount for institutional healthcare planning. Boardroom executives increasingly prioritize the integration of advanced molecular systems to ensure accurate viral detection during critical outbreak phases.
  • The strategic deployment of sophisticated rapid testing tools allows clinical networks to bypass traditional logistical bottlenecks, yielding a 30% reduction in specimen processing time. High-capacity diagnostic facilities are actively transitioning toward high-throughput sequencing instruments to monitor viral mutations and guide therapeutic product strategy.
  • To support these technological upgrades, supply chain directors invest heavily in stabilized reagent formulations, which eliminate the dependency on costly temperature-controlled storage. This transition enhances operational efficiency and expands diagnostic accessibility in remote regions. Facilities adopting these resilient reagent formats report a 25% decrease in temperature-related material spoilage.
  • These targeted infrastructure enhancements ensure that healthcare systems maintain continuous surveillance capabilities while optimizing long-term diagnostic procurement budgets.

What are the Key Data Covered in this Arbovirus Testing Market Research and Growth Report?

  • What is the expected growth of the Arbovirus Testing Market between 2026 and 2030?

    • USD 274.7 million, at a CAGR of 4.5%

  • What segmentation does the market report cover?

    • The report is segmented by End-user (Diagnostic laboratories, Hospitals, Research centers, and Others), Application (Dengue virus, Chikungunya virus, West nile and yellow fever virus, and Zika virus), Type (RT-PCR, ELISA-based tests, Antibody tests, Isothermal nucleic acid testing, and Others) and Geography (North America, Europe, Asia, Rest of World (ROW))

  • Which regions are analyzed in the report?

    • North America, Europe, Asia and Rest of World (ROW)

  • What are the key growth drivers and market challenges?

    • Escalating geographic expansion and climate alteration, High costs of advanced diagnostic infrastructure and reagents

  • Who are the major players in the Arbovirus Testing Market?

    • Abbott Laboratories, Bio Rad Laboratories Inc., BioMerieux SA, Creative Diagnostics, Danaher Corp., F. Hoffmann La Roche Ltd., GenBody Inc., Gold Standard Diagnostics Corp., GT Molecular Inc., Hologic Inc., InBios International Inc., OraSure Technologies Inc., QIAGEN N.V., Revvity Inc., Sd Biosensor Inc., Siemens Healthineers AG, Standard BioTools Inc., Thermo Fisher Scientific Inc., Trivitron Healthcare and VIRCELL S.L.

Market Research Insights

  • The Arbovirus Testing sector experiences structural transformations as healthcare providers prioritize rapid turnaround times to combat acute viral threats. Facilities upgrading to automated systems report processing capacity increases of 25%, effectively managing surging testing demands during seasonal outbreaks. This technological shift directly enhances clinical response speed, reducing patient triage delays by nearly 20%.
  • Furthermore, rigorous disease surveillance mandates drive the adoption of high-precision molecular panels, elevating overall diagnostic accuracy. By integrating these advanced testing methodologies, clinical laboratories achieve up to a 15% reduction in false-negative outcomes, ensuring more accurate and timely therapeutic interventions. These operational upgrades are essential for maintaining robust public health infrastructure.

We can help! Our analysts can customize this arbovirus testing market research report to meet your requirements.

Get in touch

1. Executive Summary

1.1 Market overview

Executive Summary - Chart on Market Overview
Executive Summary - Data Table on Market Overview
Executive Summary - Chart on Global Market Characteristics
Executive Summary - Chart on Market by Geography
Executive Summary - Chart on Market Segmentation by End-user
Executive Summary - Chart on Market Segmentation by Application
Executive Summary - Chart on Market Segmentation by Type
Executive Summary - Chart on Incremental Growth
Executive Summary - Data Table on Incremental Growth
Executive Summary - Chart on Company Market Positioning

2. Technavio Analysis

2.1 Analysis of price sensitivity, lifecycle, customer purchase basket, adoption rates, and purchase criteria

2.2 Criticality of inputs and Factors of differentiation

Chart on Overview on criticality of inputs and factors of differentiation

2.3 Factors of disruption

Chart on Overview on factors of disruption

2.4 Impact of drivers and challenges

Chart on Impact of drivers and challenges in 2025 and 2030

3. Market Landscape

3.1 Market ecosystem

Chart on Parent Market
Data Table on - Parent Market

3.2 Market characteristics

Chart on Market characteristics analysis

3.3 Value chain analysis

Chart on Value chain analysis

4. Market Sizing

4.1 Market definition

Data Table on Offerings of companies included in the market definition

4.2 Market segment analysis

Market segments

4.3 Market size 2025

4.4 Market outlook: Forecast for 2025-2030

Chart on Global - Market size and forecast 2025-2030 ($ million)
Data Table on Global - Market size and forecast 2025-2030 ($ million)
Chart on Global Market: Year-over-year growth 2025-2030 (%)
Data Table on Global Market: Year-over-year growth 2025-2030 (%)

5. Historic Market Size

5.1 Global Arbovirus Testing Market 2020 - 2024

Historic Market Size - Data Table on Global Arbovirus Testing Market 2020 - 2024 ($ million)

5.2 End-user segment analysis 2020 - 2024

Historic Market Size - End-user Segment 2020 - 2024 ($ million)

5.3 Application segment analysis 2020 - 2024

Historic Market Size - Application Segment 2020 - 2024 ($ million)

5.4 Type segment analysis 2020 - 2024

Historic Market Size - Type Segment 2020 - 2024 ($ million)

5.5 Geography segment analysis 2020 - 2024

Historic Market Size - Geography Segment 2020 - 2024 ($ million)

5.6 Country segment analysis 2020 - 2024

Historic Market Size - Country Segment 2020 - 2024 ($ million)

6. Qualitative Analysis

6.1 Impact of AI on global arbovirus testing market

6.2 Impact of geopolitical conflicts on global arbovirus testing market

7. Five Forces Analysis

7.1 Five forces summary

Five forces analysis - Comparison between 2025 and 2030

7.2 Bargaining power of buyers

Bargaining power of buyers - Impact of key factors 2025 and 2030

7.3 Bargaining power of suppliers

Bargaining power of suppliers - Impact of key factors in 2025 and 2030

7.4 Threat of new entrants

Threat of new entrants - Impact of key factors in 2025 and 2030

7.5 Threat of substitutes

Threat of substitutes - Impact of key factors in 2025 and 2030

7.6 Threat of rivalry

Threat of rivalry - Impact of key factors in 2025 and 2030

7.7 Market condition

Chart on Market condition - Five forces 2025 and 2030

8. Market Segmentation by End-user

8.1 Market segments

Chart on End-user - Market share 2025-2030 (%)
Data Table on End-user - Market share 2025-2030 (%)

8.2 Comparison by End-user

Chart on Comparison by End-user
Data Table on Comparison by End-user

8.3 Diagnostic laboratories - Market size and forecast 2025-2030

Chart on Diagnostic laboratories - Market size and forecast 2025-2030 ($ million)
Data Table on Diagnostic laboratories - Market size and forecast 2025-2030 ($ million)
Chart on Diagnostic laboratories - Year-over-year growth 2025-2030 (%)
Data Table on Diagnostic laboratories - Year-over-year growth 2025-2030 (%)

8.4 Hospitals - Market size and forecast 2025-2030

Chart on Hospitals - Market size and forecast 2025-2030 ($ million)
Data Table on Hospitals - Market size and forecast 2025-2030 ($ million)
Chart on Hospitals - Year-over-year growth 2025-2030 (%)
Data Table on Hospitals - Year-over-year growth 2025-2030 (%)

8.5 Research centers - Market size and forecast 2025-2030

Chart on Research centers - Market size and forecast 2025-2030 ($ million)
Data Table on Research centers - Market size and forecast 2025-2030 ($ million)
Chart on Research centers - Year-over-year growth 2025-2030 (%)
Data Table on Research centers - Year-over-year growth 2025-2030 (%)

8.6 Others - Market size and forecast 2025-2030

Chart on Others - Market size and forecast 2025-2030 ($ million)
Data Table on Others - Market size and forecast 2025-2030 ($ million)
Chart on Others - Year-over-year growth 2025-2030 (%)
Data Table on Others - Year-over-year growth 2025-2030 (%)

8.7 Market opportunity by End-user

Market opportunity by End-user ($ million)
Data Table on Market opportunity by End-user ($ million)

9. Market Segmentation by Application

9.1 Market segments

Chart on Application - Market share 2025-2030 (%)
Data Table on Application - Market share 2025-2030 (%)

9.2 Comparison by Application

Chart on Comparison by Application
Data Table on Comparison by Application

9.3 Dengue virus - Market size and forecast 2025-2030

Chart on Dengue virus - Market size and forecast 2025-2030 ($ million)
Data Table on Dengue virus - Market size and forecast 2025-2030 ($ million)
Chart on Dengue virus - Year-over-year growth 2025-2030 (%)
Data Table on Dengue virus - Year-over-year growth 2025-2030 (%)

9.4 Chikungunya virus - Market size and forecast 2025-2030

Chart on Chikungunya virus - Market size and forecast 2025-2030 ($ million)
Data Table on Chikungunya virus - Market size and forecast 2025-2030 ($ million)
Chart on Chikungunya virus - Year-over-year growth 2025-2030 (%)
Data Table on Chikungunya virus - Year-over-year growth 2025-2030 (%)

9.5 West nile and yellow fever virus - Market size and forecast 2025-2030

Chart on West nile and yellow fever virus - Market size and forecast 2025-2030 ($ million)
Data Table on West nile and yellow fever virus - Market size and forecast 2025-2030 ($ million)
Chart on West nile and yellow fever virus - Year-over-year growth 2025-2030 (%)
Data Table on West nile and yellow fever virus - Year-over-year growth 2025-2030 (%)

9.6 Zika virus - Market size and forecast 2025-2030

Chart on Zika virus - Market size and forecast 2025-2030 ($ million)
Data Table on Zika virus - Market size and forecast 2025-2030 ($ million)
Chart on Zika virus - Year-over-year growth 2025-2030 (%)
Data Table on Zika virus - Year-over-year growth 2025-2030 (%)

9.7 Market opportunity by Application

Market opportunity by Application ($ million)
Data Table on Market opportunity by Application ($ million)

10. Market Segmentation by Type

10.1 Market segments

Chart on Type - Market share 2025-2030 (%)
Data Table on Type - Market share 2025-2030 (%)

10.2 Comparison by Type

Chart on Comparison by Type
Data Table on Comparison by Type

10.3 RT-PCR - Market size and forecast 2025-2030

Chart on RT-PCR - Market size and forecast 2025-2030 ($ million)
Data Table on RT-PCR - Market size and forecast 2025-2030 ($ million)
Chart on RT-PCR - Year-over-year growth 2025-2030 (%)
Data Table on RT-PCR - Year-over-year growth 2025-2030 (%)

10.4 ELISA-based tests - Market size and forecast 2025-2030

Chart on ELISA-based tests - Market size and forecast 2025-2030 ($ million)
Data Table on ELISA-based tests - Market size and forecast 2025-2030 ($ million)
Chart on ELISA-based tests - Year-over-year growth 2025-2030 (%)
Data Table on ELISA-based tests - Year-over-year growth 2025-2030 (%)

10.5 Antibody tests - Market size and forecast 2025-2030

Chart on Antibody tests - Market size and forecast 2025-2030 ($ million)
Data Table on Antibody tests - Market size and forecast 2025-2030 ($ million)
Chart on Antibody tests - Year-over-year growth 2025-2030 (%)
Data Table on Antibody tests - Year-over-year growth 2025-2030 (%)

10.6 Isothermal nucleic acid testing - Market size and forecast 2025-2030

Chart on Isothermal nucleic acid testing - Market size and forecast 2025-2030 ($ million)
Data Table on Isothermal nucleic acid testing - Market size and forecast 2025-2030 ($ million)
Chart on Isothermal nucleic acid testing - Year-over-year growth 2025-2030 (%)
Data Table on Isothermal nucleic acid testing - Year-over-year growth 2025-2030 (%)

10.7 Others - Market size and forecast 2025-2030

Chart on Others - Market size and forecast 2025-2030 ($ million)
Data Table on Others - Market size and forecast 2025-2030 ($ million)
Chart on Others - Year-over-year growth 2025-2030 (%)
Data Table on Others - Year-over-year growth 2025-2030 (%)

10.8 Market opportunity by Type

Market opportunity by Type ($ million)
Data Table on Market opportunity by Type ($ million)

11. Customer Landscape

11.1 Customer landscape overview

Analysis of price sensitivity, lifecycle, customer purchase basket, adoption rates, and purchase criteria

12. Geographic Landscape

12.1 Geographic segmentation

Chart on Market share by geography 2025-2030 (%)
Data Table on Market share by geography 2025-2030 (%)

12.2 Geographic comparison

Chart on Geographic comparison
Data Table on Geographic comparison

12.3 North America - Market size and forecast 2025-2030

Chart on North America - Market size and forecast 2025-2030 ($ million)
Data Table on North America - Market size and forecast 2025-2030 ($ million)
Chart on North America - Year-over-year growth 2025-2030 (%)
Data Table on North America - Year-over-year growth 2025-2030 (%)
Chart on Regional Comparison - North America
Data Table on Regional Comparison - North America

12.3.1 US - Market size and forecast 2025-2030

Chart on US - Market size and forecast 2025-2030 ($ million)
Data Table on US - Market size and forecast 2025-2030 ($ million)
Chart on US - Year-over-year growth 2025-2030 (%)
Data Table on US - Year-over-year growth 2025-2030 (%)

12.3.2 Canada - Market size and forecast 2025-2030

Chart on Canada - Market size and forecast 2025-2030 ($ million)
Data Table on Canada - Market size and forecast 2025-2030 ($ million)
Chart on Canada - Year-over-year growth 2025-2030 (%)
Data Table on Canada - Year-over-year growth 2025-2030 (%)

12.3.3 Mexico - Market size and forecast 2025-2030

Chart on Mexico - Market size and forecast 2025-2030 ($ million)
Data Table on Mexico - Market size and forecast 2025-2030 ($ million)
Chart on Mexico - Year-over-year growth 2025-2030 (%)
Data Table on Mexico - Year-over-year growth 2025-2030 (%)

12.4 Europe - Market size and forecast 2025-2030

Chart on Europe - Market size and forecast 2025-2030 ($ million)
Data Table on Europe - Market size and forecast 2025-2030 ($ million)
Chart on Europe - Year-over-year growth 2025-2030 (%)
Data Table on Europe - Year-over-year growth 2025-2030 (%)
Chart on Regional Comparison - Europe
Data Table on Regional Comparison - Europe

12.4.1 Germany - Market size and forecast 2025-2030

Chart on Germany - Market size and forecast 2025-2030 ($ million)
Data Table on Germany - Market size and forecast 2025-2030 ($ million)
Chart on Germany - Year-over-year growth 2025-2030 (%)
Data Table on Germany - Year-over-year growth 2025-2030 (%)

12.4.2 UK - Market size and forecast 2025-2030

Chart on UK - Market size and forecast 2025-2030 ($ million)
Data Table on UK - Market size and forecast 2025-2030 ($ million)
Chart on UK - Year-over-year growth 2025-2030 (%)
Data Table on UK - Year-over-year growth 2025-2030 (%)

12.4.3 France - Market size and forecast 2025-2030

Chart on France - Market size and forecast 2025-2030 ($ million)
Data Table on France - Market size and forecast 2025-2030 ($ million)
Chart on France - Year-over-year growth 2025-2030 (%)
Data Table on France - Year-over-year growth 2025-2030 (%)

12.4.4 Italy - Market size and forecast 2025-2030

Chart on Italy - Market size and forecast 2025-2030 ($ million)
Data Table on Italy - Market size and forecast 2025-2030 ($ million)
Chart on Italy - Year-over-year growth 2025-2030 (%)
Data Table on Italy - Year-over-year growth 2025-2030 (%)

12.4.5 Spain - Market size and forecast 2025-2030

Chart on Spain - Market size and forecast 2025-2030 ($ million)
Data Table on Spain - Market size and forecast 2025-2030 ($ million)
Chart on Spain - Year-over-year growth 2025-2030 (%)
Data Table on Spain - Year-over-year growth 2025-2030 (%)

12.4.6 The Netherlands - Market size and forecast 2025-2030

Chart on The Netherlands - Market size and forecast 2025-2030 ($ million)
Data Table on The Netherlands - Market size and forecast 2025-2030 ($ million)
Chart on The Netherlands - Year-over-year growth 2025-2030 (%)
Data Table on The Netherlands - Year-over-year growth 2025-2030 (%)

12.5 Asia - Market size and forecast 2025-2030

Chart on Asia - Market size and forecast 2025-2030 ($ million)
Data Table on Asia - Market size and forecast 2025-2030 ($ million)
Chart on Asia - Year-over-year growth 2025-2030 (%)
Data Table on Asia - Year-over-year growth 2025-2030 (%)
Chart on Regional Comparison - Asia
Data Table on Regional Comparison - Asia

12.5.1 China - Market size and forecast 2025-2030

Chart on China - Market size and forecast 2025-2030 ($ million)
Data Table on China - Market size and forecast 2025-2030 ($ million)
Chart on China - Year-over-year growth 2025-2030 (%)
Data Table on China - Year-over-year growth 2025-2030 (%)

12.5.2 India - Market size and forecast 2025-2030

Chart on India - Market size and forecast 2025-2030 ($ million)
Data Table on India - Market size and forecast 2025-2030 ($ million)
Chart on India - Year-over-year growth 2025-2030 (%)
Data Table on India - Year-over-year growth 2025-2030 (%)

12.5.3 Japan - Market size and forecast 2025-2030

Chart on Japan - Market size and forecast 2025-2030 ($ million)
Data Table on Japan - Market size and forecast 2025-2030 ($ million)
Chart on Japan - Year-over-year growth 2025-2030 (%)
Data Table on Japan - Year-over-year growth 2025-2030 (%)

12.5.4 South Korea - Market size and forecast 2025-2030

Chart on South Korea - Market size and forecast 2025-2030 ($ million)
Data Table on South Korea - Market size and forecast 2025-2030 ($ million)
Chart on South Korea - Year-over-year growth 2025-2030 (%)
Data Table on South Korea - Year-over-year growth 2025-2030 (%)

12.5.5 Indonesia - Market size and forecast 2025-2030

Chart on Indonesia - Market size and forecast 2025-2030 ($ million)
Data Table on Indonesia - Market size and forecast 2025-2030 ($ million)
Chart on Indonesia - Year-over-year growth 2025-2030 (%)
Data Table on Indonesia - Year-over-year growth 2025-2030 (%)

12.5.6 Thailand - Market size and forecast 2025-2030

Chart on Thailand - Market size and forecast 2025-2030 ($ million)
Data Table on Thailand - Market size and forecast 2025-2030 ($ million)
Chart on Thailand - Year-over-year growth 2025-2030 (%)
Data Table on Thailand - Year-over-year growth 2025-2030 (%)

12.6 Rest of World (ROW) - Market size and forecast 2025-2030

Chart on Rest of World (ROW) - Market size and forecast 2025-2030 ($ million)
Data Table on Rest of World (ROW) - Market size and forecast 2025-2030 ($ million)
Chart on Rest of World (ROW) - Year-over-year growth 2025-2030 (%)
Data Table on Rest of World (ROW) - Year-over-year growth 2025-2030 (%)
Chart on Regional Comparison - Rest of World (ROW)
Data Table on Regional Comparison - Rest of World (ROW)

12.6.1 Brazil - Market size and forecast 2025-2030

Chart on Brazil - Market size and forecast 2025-2030 ($ million)
Data Table on Brazil - Market size and forecast 2025-2030 ($ million)
Chart on Brazil - Year-over-year growth 2025-2030 (%)
Data Table on Brazil - Year-over-year growth 2025-2030 (%)

12.6.2 Saudi Arabia - Market size and forecast 2025-2030

Chart on Saudi Arabia - Market size and forecast 2025-2030 ($ million)
Data Table on Saudi Arabia - Market size and forecast 2025-2030 ($ million)
Chart on Saudi Arabia - Year-over-year growth 2025-2030 (%)
Data Table on Saudi Arabia - Year-over-year growth 2025-2030 (%)

12.6.3 UAE - Market size and forecast 2025-2030

Chart on UAE - Market size and forecast 2025-2030 ($ million)
Data Table on UAE - Market size and forecast 2025-2030 ($ million)
Chart on UAE - Year-over-year growth 2025-2030 (%)
Data Table on UAE - Year-over-year growth 2025-2030 (%)

12.6.4 Turkey - Market size and forecast 2025-2030

Chart on Turkey - Market size and forecast 2025-2030 ($ million)
Data Table on Turkey - Market size and forecast 2025-2030 ($ million)
Chart on Turkey - Year-over-year growth 2025-2030 (%)
Data Table on Turkey - Year-over-year growth 2025-2030 (%)

12.6.5 Argentina - Market size and forecast 2025-2030

Chart on Argentina - Market size and forecast 2025-2030 ($ million)
Data Table on Argentina - Market size and forecast 2025-2030 ($ million)
Chart on Argentina - Year-over-year growth 2025-2030 (%)
Data Table on Argentina - Year-over-year growth 2025-2030 (%)

12.6.6 Colombia - Market size and forecast 2025-2030

Chart on Colombia - Market size and forecast 2025-2030 ($ million)
Data Table on Colombia - Market size and forecast 2025-2030 ($ million)
Chart on Colombia - Year-over-year growth 2025-2030 (%)
Data Table on Colombia - Year-over-year growth 2025-2030 (%)

12.6.7 South Africa - Market size and forecast 2025-2030

Chart on South Africa - Market size and forecast 2025-2030 ($ million)
Data Table on South Africa - Market size and forecast 2025-2030 ($ million)
Chart on South Africa - Year-over-year growth 2025-2030 (%)
Data Table on South Africa - Year-over-year growth 2025-2030 (%)

12.6.8 Israel - Market size and forecast 2025-2030

Chart on Israel - Market size and forecast 2025-2030 ($ million)
Data Table on Israel - Market size and forecast 2025-2030 ($ million)
Chart on Israel - Year-over-year growth 2025-2030 (%)
Data Table on Israel - Year-over-year growth 2025-2030 (%)

12.7 Market opportunity by geography

Market opportunity by geography ($ million)
Data Tables on Market opportunity by geography ($ million)

13. Drivers, Challenges, and Opportunity

13.1 Market drivers

Escalating geographic expansion and climate alteration
Technological advancements in multiplex molecular assays
Heightened institutional focus on pandemic preparedness and surveillance

13.2 Market challenges

High costs of advanced diagnostic infrastructure and reagents
Serological cross-reactivity and diagnostic complexities
Regulatory fragmentation and complex approval pathways

13.3 Impact of drivers and challenges

Impact of drivers and challenges in 2025 and 2030

13.4 Market opportunities

Shift toward decentralized and point-of-care testing solutions
Expansion of integrated surveillance and environmental data modelling
Strategic adoption of automation and high-throughput processing

14. Competitive Landscape

14.1 Overview

14.2

Overview on criticality of inputs and factors of differentiation

14.3 Landscape disruption

Overview on factors of disruption

14.4 Industry risks

Impact of key risks on business

15. Competitive Analysis

15.1 Companies profiled

Companies covered

15.2 Company ranking index

15.3 Market positioning of companies

Matrix on companies position and classification

15.4 Abbott Laboratories

Abbott Laboratories - Overview
Abbott Laboratories - Business segments
Abbott Laboratories - Key news
Abbott Laboratories - Key offerings
Abbott Laboratories - Segment focus
SWOT

15.5 Bio Rad Laboratories Inc.

Bio Rad Laboratories Inc. - Overview
Bio Rad Laboratories Inc. - Business segments
Bio Rad Laboratories Inc. - Key news
Bio Rad Laboratories Inc. - Key offerings
Bio Rad Laboratories Inc. - Segment focus
SWOT

15.6 BioMerieux SA

BioMerieux SA - Overview
BioMerieux SA - Business segments
BioMerieux SA - Key offerings
BioMerieux SA - Segment focus
SWOT

15.7 Creative Diagnostics

Creative Diagnostics - Overview
Creative Diagnostics - Product / Service
Creative Diagnostics - Key offerings
SWOT

15.8 Danaher Corp.

Danaher Corp. - Overview
Danaher Corp. - Business segments
Danaher Corp. - Key news
Danaher Corp. - Key offerings
Danaher Corp. - Segment focus
SWOT

15.9 F. Hoffmann La Roche Ltd.

F. Hoffmann La Roche Ltd. - Overview
F. Hoffmann La Roche Ltd. - Business segments
F. Hoffmann La Roche Ltd. - Key news
F. Hoffmann La Roche Ltd. - Key offerings
F. Hoffmann La Roche Ltd. - Segment focus
SWOT

15.10 Hologic Inc.

Hologic Inc. - Overview
Hologic Inc. - Product / Service
Hologic Inc. - Key offerings
SWOT

15.11 OraSure Technologies Inc.

OraSure Technologies Inc. - Overview
OraSure Technologies Inc. - Business segments
OraSure Technologies Inc. - Key offerings
OraSure Technologies Inc. - Segment focus
SWOT

15.12 QIAGEN N.V.

QIAGEN N.V. - Overview
QIAGEN N.V. - Product / Service
QIAGEN N.V. - Key offerings
SWOT

15.13 Revvity Inc.

Revvity Inc. - Overview
Revvity Inc. - Business segments
Revvity Inc. - Key offerings
Revvity Inc. - Segment focus
SWOT

15.14 Sd Biosensor Inc.

Sd Biosensor Inc. - Overview
Sd Biosensor Inc. - Product / Service
Sd Biosensor Inc. - Key offerings
SWOT

15.15 Siemens Healthineers AG

Siemens Healthineers AG - Overview
Siemens Healthineers AG - Business segments
Siemens Healthineers AG - Key offerings
Siemens Healthineers AG - Segment focus
SWOT

15.16 Standard BioTools Inc.

Standard BioTools Inc. - Overview
Standard BioTools Inc. - Product / Service
Standard BioTools Inc. - Key offerings
SWOT

15.17 Thermo Fisher Scientific Inc.

Thermo Fisher Scientific Inc. - Overview
Thermo Fisher Scientific Inc. - Business segments
Thermo Fisher Scientific Inc. - Key news
Thermo Fisher Scientific Inc. - Key offerings
Thermo Fisher Scientific Inc. - Segment focus
SWOT

15.18 Trivitron Healthcare

Trivitron Healthcare - Overview
Trivitron Healthcare - Product / Service
Trivitron Healthcare - Key offerings
SWOT

16. Appendix

16.1 Scope of the report

Market definition
Objectives
Notes and caveats

16.2 Inclusions and exclusions checklist

Inclusions checklist
Exclusions checklist

16.3 Currency conversion rates for US$

16.4 Research methodology

16.5 Data procurement

Information sources

16.6 Data validation

16.7 Validation techniques employed for market sizing

16.8 Data synthesis

16.9 360 degree market analysis

16.10 List of abbreviations

Research Methodology

Technavio presents a detailed picture of the market by way of study, synthesis, and summation of data from multiple sources. The analysts have presented the various facets of the market with a particular focus on identifying the key industry influencers. The data thus presented is comprehensive, reliable, and the result of extensive research, both primary and secondary.

INFORMATION SOURCES

Primary sources

  • Manufacturers and suppliers
  • Channel partners
  • Industry experts
  • Strategic decision makers

Secondary sources

  • Industry journals and periodicals
  • Government data
  • Financial reports of key industry players
  • Historical data
  • Press releases

DATA ANALYSIS

Data Synthesis

  • Collation of data
  • Estimation of key figures
  • Analysis of derived insights

Data Validation

  • Triangulation with data models
  • Reference against proprietary databases
  • Corroboration with industry experts

REPORT WRITING

Qualitative

  • Market drivers
  • Market challenges
  • Market trends
  • Five forces analysis

Quantitative

  • Market size and forecast
  • Market segmentation
  • Geographical insights
  • Competitive landscape

Interested in this report?

Get your sample now to see our research methodology and insights!

Download Now

Frequently Asked Questions

Arbovirus Testing market growth will increase by USD 274.7 million during 2026-2030.

The Arbovirus Testing market is expected to grow at a CAGR of 4.5% during 2026-2030.

Arbovirus Testing market is segmented by End-user (Diagnostic laboratories, Hospitals, Research centers, Others) Application (Dengue virus, Chikungunya virus, West nile and yellow fever virus, Zika virus) Type (RT-PCR, ELISA-based tests, Antibody tests, Isothermal nucleic acid testing, Others)

Abbott Laboratories, Bio Rad Laboratories Inc., BioMerieux SA, Creative Diagnostics, Danaher Corp., F. Hoffmann La Roche Ltd., GenBody Inc., Gold Standard Diagnostics Corp., GT Molecular Inc., Hologic Inc., InBios International Inc., OraSure Technologies Inc., QIAGEN N.V., Revvity Inc., Sd Biosensor Inc., Siemens Healthineers AG, Standard BioTools Inc., Thermo Fisher Scientific Inc., Trivitron Healthcare, VIRCELL S.L. are a few of the key vendors in the Arbovirus Testing market.

North America will register the highest growth rate of 37.6% among the other regions. Therefore, the Arbovirus Testing market in North America is expected to garner significant business opportunities for the vendors during the forecast period.

US, Canada, Mexico, Germany, UK, France, Italy, Spain, The Netherlands, China, India, Japan, South Korea, Indonesia, Thailand, Brazil, Saudi Arabia, UAE, Turkey, Argentina, Colombia, South Africa, Israel

  • Escalating geographic expansion and climate alteration is the driving factor this market.

The Arbovirus Testing market vendors should focus on grabbing business opportunities from the End-user segment as it accounted for the largest market share in the base year.
RIA - Research AI Assistant
Ask RIA
