Art Tourism Market Analysis, Size, and Forecast 2026-2030: Europe (UK, France, and Germany), North America (US, Canada, and Mexico), APAC (China, Japan, and India), South America (Brazil, Argentina, and Colombia), Middle East and Africa (Saudi Arabia, UAE, and South Africa), and Rest of World (ROW)

Art Tourism Market Analysis, Size, and Forecast 2026-2030:
Europe (UK, France, and Germany), North America (US, Canada, and Mexico), APAC (China, Japan, and India), South America (Brazil, Argentina, and Colombia), Middle East and Africa (Saudi Arabia, UAE, and South Africa), and Rest of World (ROW)

Published: Mar 2026 279 Pages SKU: IRTNTR77251

Market Overview at a Glance

$9.30 B
Market Opportunity
3.7%
CAGR 2025 - 2030
36%
Europe Growth
$22.04 B
Events and exhibitions segment 2024

Art Tourism Market Size 2026-2030

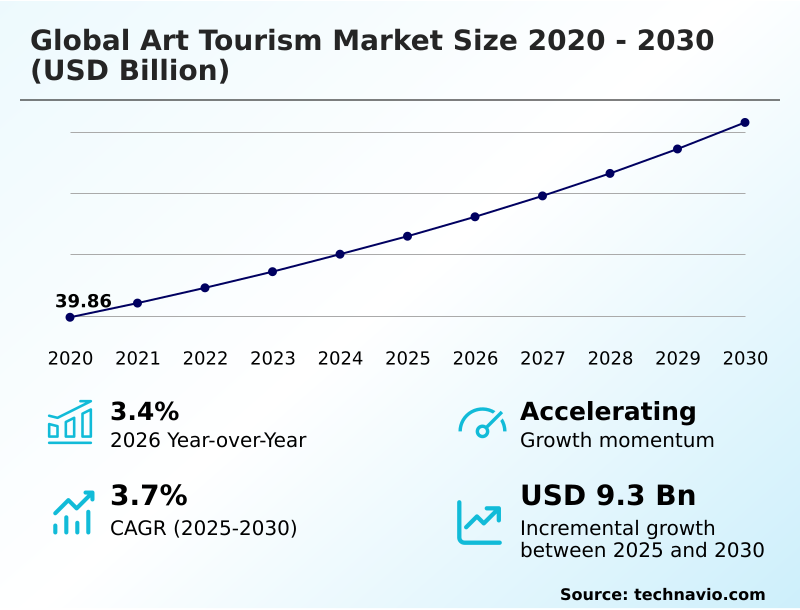
The art tourism market size is valued to increase by USD 9.30 billion, at a CAGR of 3.7% from 2025 to 2030. Increasing interest in cultural experiences and heritage exploration will drive the art tourism market.

Major Market Trends & Insights

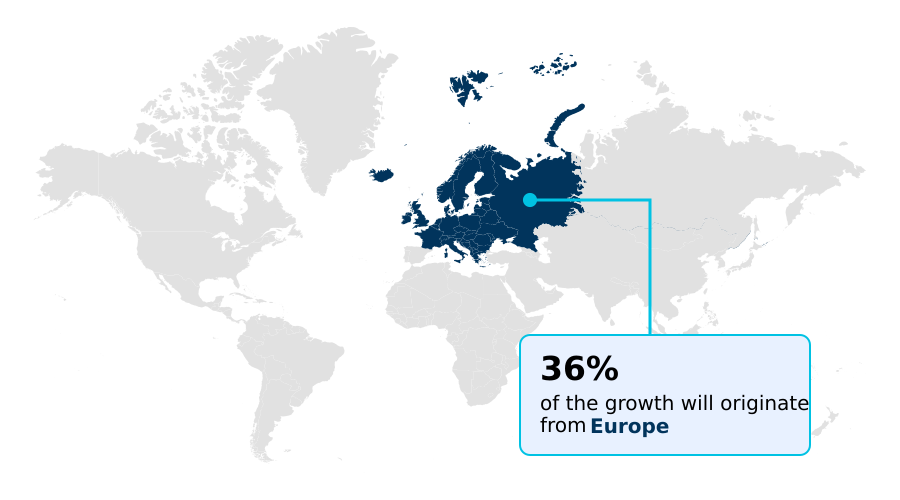
  • Europe dominated the market and accounted for a 36% growth during the forecast period.
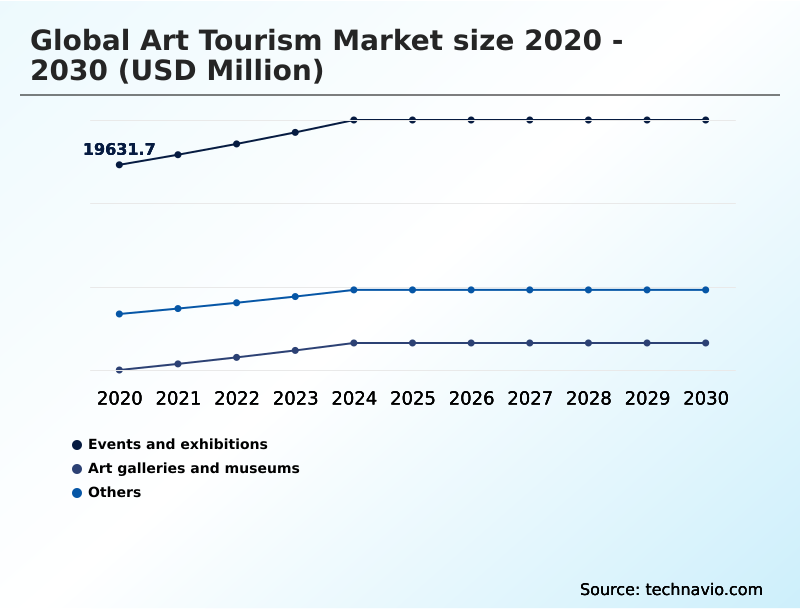
  • By Type - Events and exhibitions segment was valued at USD 22.04 billion in 2024
  • By Consumer - International segment accounted for the largest market revenue share in 2024

Market Size & Forecast

  • Market Opportunities: USD 15.93 billion
  • Market Future Opportunities: USD 9.30 billion
  • CAGR from 2025 to 2030 : 3.7%

Market Summary

  • The art tourism market is undergoing a significant transformation, driven by a global demand for authentic, educational, and immersive travel. This shift moves beyond simple sightseeing toward deep engagement with a destination's creative identity and history.
  • Key drivers include a rising interest in cultural heritage and the pursuit of unique experiences, which are now more accessible through digital platforms and specialized tour operators. Trends such as the development of large-scale digital art installations and virtual reality museum tours are redefining visitor engagement, making art more interactive and appealing to younger, tech-savvy demographics.
  • For instance, a cultural institution can leverage data analytics to optimize visitor flow during a major exhibition, reducing wait times and enhancing the overall experience, which directly impacts satisfaction and repeat visits. However, the market faces challenges from high travel costs and the need for sustainable practices to protect heritage sites from overtourism.
  • As the industry evolves, success hinges on balancing accessibility, authenticity, and preservation, creating a vibrant ecosystem that supports both cultural exchange and local economies. This dynamic environment encourages innovation in how cultural narratives are presented and consumed globally.

What will be the Size of the Art Tourism Market during the forecast period?

Get Key Insights on Market Forecast (PDF) Request Free Sample

How is the Art Tourism Market Segmented?

The art tourism industry research report provides comprehensive data (region-wise segment analysis), with forecasts and estimates in "USD million" for the period 2026-2030, as well as historical data from 2020-2024 for the following segments.

  • Type
    • Events and exhibitions
    • Art galleries and museums
    • Others
  • Consumer
    • International
    • Domestic
  • Mode of booking
    • Offline
    • Online
  • Geography
    • Europe
      • UK
      • France
      • Germany
    • North America
      • US
      • Canada
      • Mexico
    • APAC
      • China
      • Japan
      • India
    • South America
      • Brazil
      • Argentina
      • Colombia
    • Middle East and Africa
      • Saudi Arabia
      • UAE
      • South Africa
    • Rest of World (ROW)

By Type Insights

The events and exhibitions segment is estimated to witness significant growth during the forecast period.

The events and exhibitions segment is a primary driver for the global art tourism market, focusing on short-term art fairs, biennales, and large-scale curated displays. These gatherings, central to cultural diplomacy programs, attract a global audience, creating seasonal travel spikes.

The success of this segment hinges on its ability to generate significant media attention and cultural prestige for host cities, motivating travel for unique installations and performances.

The temporary nature of these events, including art biennales and public art walks, creates a sense of urgency.

Host regions often invest in temporary infrastructure, supported by cultural event logistics, to manage an influx of visitors who contribute substantially to the local economy.

For instance, well-promoted art festival circuits have been shown to increase local hospitality spending by over 25% during event periods, attracting both art vacation packages and student art trips.

Request Free Sample

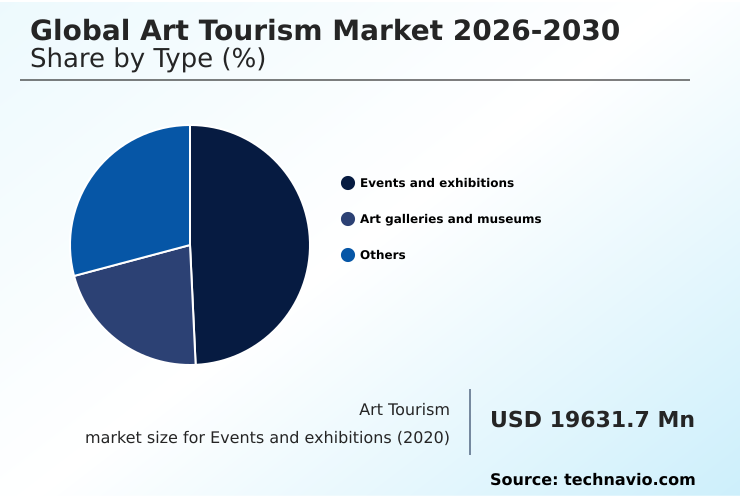
The Events and exhibitions segment was valued at USD 22.04 billion in 2024 and showed a gradual increase during the forecast period.

Request Free Sample

Regional Analysis

Europe is estimated to contribute 36% to the growth of the global market during the forecast period.Technavio’s analysts have elaborately explained the regional trends and drivers that shape the market during the forecast period.

See How Art Tourism Market Demand is Rising in Europe Request Free Sample

The geographic landscape of the art tourism market is characterized by a mix of established and emerging destinations, each contributing to the industry's dynamic growth.

Europe remains a dominant region, accounting for approximately 36% of the market's incremental growth, driven by its rich density of historical assets and world-renowned institutions.

Cities in countries like Italy and France leverage centuries of artistic legacy, supported by a sophisticated tourism infrastructure that facilitates culinary art travel and literary tourism.

North America follows, with a strong market in the US and Canada focused on contemporary art fairs and vibrant urban art scenes.

Meanwhile, the APAC region is the fastest-growing, with its growth rate outpacing Europe's by more than a full percentage point, fueled by government investment in cultural district development and a rising middle class interested in cultural consumption.

This global distribution underscores the importance of both cultural heritage preservation and innovation in performing arts tourism to attract diverse traveler segments.

Market Dynamics

Our researchers analyzed the data with 2025 as the base year, along with the key drivers, trends, and challenges. A holistic analysis of drivers will help companies refine their marketing strategies to gain a competitive advantage.

  • The global art tourism market is undergoing a strategic evolution, influenced heavily by the impact of digital media on art tourism. An in-depth analysis of marketing strategies for cultural destinations reveals a significant pivot toward online engagement.
  • The role of social media in cultural travel is no longer supplemental but central to attracting visitors, with platforms shaping itineraries and creating viral interest in specific sites. A key area of focus is promoting sustainable practices in heritage tourism to mitigate the challenges of overtourism at heritage sites.
  • The rise of booking platforms for specialized art tours has democratized access, allowing travelers to compare private vs group museum tour benefits and find niche offerings. For operators, creating authentic cultural travel experiences is paramount. This involves integrating technology in cultural heritage, such as virtual reality applications in museums, which offer new narrative forms.
  • The economic impact of art festivals is substantial, prompting exploration into developing art tourism in emerging markets. This expansion must consider accessibility in art tourism for disabled travelers and cater to niche art tourism market segments, such as art therapy and wellness travel. For high-value segments, luxury art travel for collectors remains a lucrative focus.
  • Success is increasingly defined by how well providers meet diverse needs, from art tour packages for senior travelers to programs for art tourism for educational institutions. Measuring success in cultural tourism now requires sophisticated analytics, moving beyond visitor numbers to gauge engagement and satisfaction, with leading operators reporting a 20% higher retention rate when personalized digital content is integrated.
  • Finally, comparing art biennales globally provides benchmarks for innovation and quality.

What are the key market drivers leading to the rise in the adoption of Art Tourism Industry?

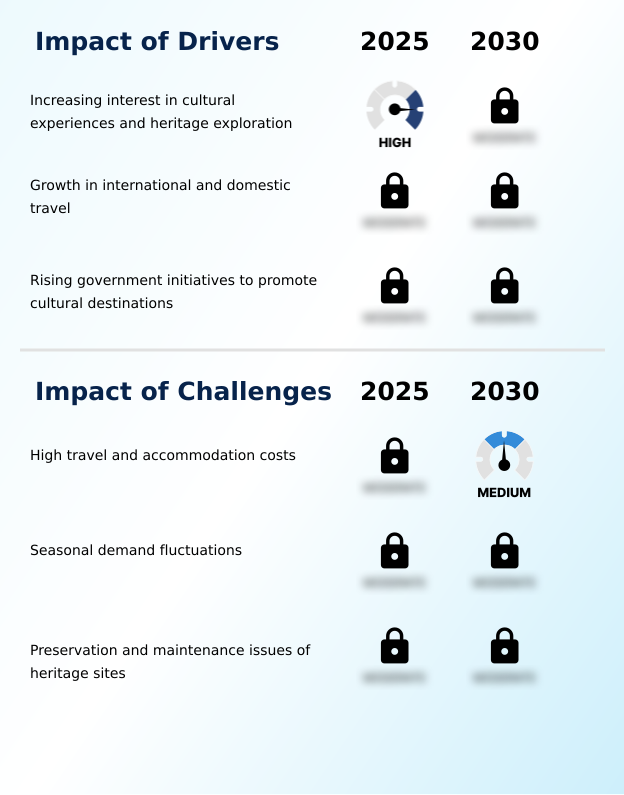
  • A growing interest in cultural experiences and heritage exploration is a key driver for market growth.

  • The market is propelled by an increasing consumer interest in cultural experiences and heritage exploration, reflecting a move toward more meaningful travel. Modern travelers are actively seeking authentic cultural experiences through heritage site tourism and educational travel programs.
  • This intellectual curiosity supports the development of curated tours, including art history education tours and architectural tours, which offer deeper engagement with a destination's creative identity.
  • This demand for authenticity is a primary motivator for long-haul travel, with culturally motivated trips accounting for a 30% longer average stay than general leisure trips.
  • This driver also fuels growth in niche segments such as film-induced tourism, which leverages storytelling to attract visitors.
  • As cultural literacy becomes a priority, destinations offering rich, narrative-driven experiences are gaining a significant competitive edge, with some reporting a 25% increase in bookings for small group art tours.

What are the market trends shaping the Art Tourism Industry?

  • The increasing development of immersive and experiential art events represents a significant upcoming trend shaping the market.

  • A significant trend transforming the art tourism market is the rapid development of immersive art events, which are redefining visitor engagement. Utilizing digital art installations and advanced projection mapping, these experiences shift the paradigm from passive observation to active participation, a model that resonates strongly with younger demographics. These events often achieve visitor engagement rates 40% higher than traditional exhibits.
  • Furthermore, the use of unconventional venues like repurposed industrial spaces makes the artistic experience more accessible and shareable, amplifying destination visibility through social media. This trend is fostering innovation within the creative economy tourism sector, as seen with the expansion of art residency programs and culinary art travel.
  • The ability to create traveling exhibitions also democratizes access to art, a strategy that has proven to increase audience reach by over 60% compared to stationary collections, promoting both art gallery hopping and urban exploration tours.

What challenges does the Art Tourism Industry face during its growth?

  • High travel and accommodation costs pose a significant challenge to the industry's growth trajectory.

  • A primary restraint on the art tourism market is the high cost of travel and accommodation, which creates a significant barrier to entry for many potential visitors. Escalating prices in major art capitals can lead to a concentration of visitors in the luxury cultural travel segment, while pricing out budget-conscious travelers.
  • International flights and premium lodging can inflate the cost of a trip by over 50% compared to domestic travel options. This economic pressure also affects the sustainability of smaller, regional galleries that struggle to attract visitors who are already facing high expenses.
  • Moreover, economic volatility and fluctuating exchange rates introduce uncertainty into travel planning, impacting both solo traveler art tours and family art travel. These high fixed costs, combined with a 15% rise in operational expenses for hospitality providers in key cities, challenge the sector's goal of fostering inclusive and accessible cultural engagement through offerings like cultural heritage tours.

Exclusive Technavio Analysis on Customer Landscape

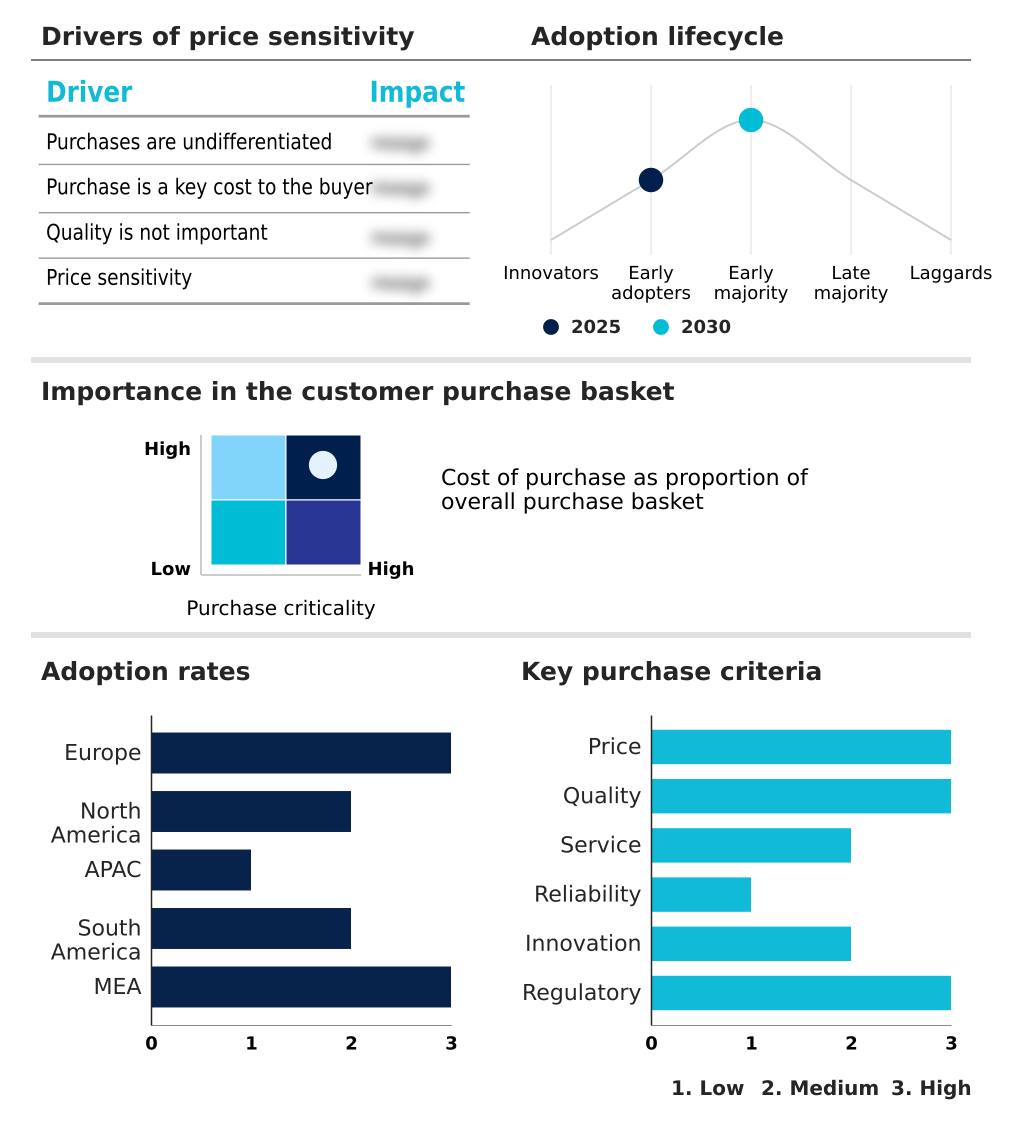
The art tourism market forecasting report includes the adoption lifecycle of the market, covering from the innovator’s stage to the laggard’s stage. It focuses on adoption rates in different regions based on penetration. Furthermore, the art tourism market report also includes key purchase criteria and drivers of price sensitivity to help companies evaluate and develop their market growth analysis strategies.

Customer Landscape of Art Tourism Industry

Competitive Landscape

Companies are implementing various strategies, such as strategic alliances, art tourism market forecast, partnerships, mergers and acquisitions, geographical expansion, and product/service launches, to enhance their presence in the industry.

A and K Travel Group Ltd. - Specializes in curated museum tours and luxury culture-focused travel itineraries, offering bespoke package holidays, cruises, and exclusive villas for discerning individuals and groups.

The industry research and growth report includes detailed analyses of the competitive landscape of the market and information about key companies, including:

  • A and K Travel Group Ltd.
  • Art of Travel
  • Arts and Leisure Tours.
  • ArtSmart
  • Bookmundi ApS
  • Context Travel LLC
  • Imago Artis Travel Srl
  • Intrepid Group Pty Ltd.
  • Juma Art Tours
  • Martin Randall Travel Ltd.
  • Paint Away Tours LLC
  • Reality Tours and Travel
  • Shearings Holidays
  • The Blue Walk
  • The Travel Corp.
  • Thomas Cook India Ltd.
  • TourRadar GmbH
  • TripAdvisor Inc.
  • Ultimate Travel Company Ltd.
  • WorldStrides Inc.

Qualitative and quantitative analysis of companies has been conducted to help clients understand the wider business environment as well as the strengths and weaknesses of key industry players. Data is qualitatively analyzed to categorize companies as pure play, category-focused, industry-focused, and diversified; it is quantitatively analyzed to categorize companies as dominant, leading, strong, tentative, and weak.

Recent Development and News in Art tourism market

  • In August 2024, Context Travel LLC announced the launch of a new series of scholar-led digital tours, utilizing augmented reality to provide immersive historical context for major European art collections, as detailed in their quarterly investor briefing.
  • In March 2025, The UNESCO World Conference on Cultural Policies and Sustainable Development released a report highlighting that over 40% of all international travel arrivals are motivated by cultural heritage exploration and artistic engagement, according to a UNESCO press release.
  • In April 2025, The opening of the Expo 2025 in Osaka, Japan, featured a massive, dedicated Art Pavilion showcasing high-resolution immersive installations that merged traditional Japanese aesthetics with cutting-edge digital projections, reported by the Expo's official media channels.
  • In May 2025, The European Travel Commission noted in its seasonal outlook report that hotel prices in major artistic cities like Paris and Venice have risen by over 15% due to increased operating costs and high demand from international art enthusiasts.

Dive into Technavio’s robust research methodology, blending expert interviews, extensive data synthesis, and validated models for unparalleled Art Tourism Market insights. See full methodology.

Market Scope
Page number 279
Base year 2025
Historic period 2020-2024
Forecast period 2026-2030
Growth momentum & CAGR Accelerate at a CAGR of 3.7%
Market growth 2026-2030 USD 9304.7 million
Market structure Fragmented
YoY growth 2025-2026(%) 3.4%
Key countries UK, France, Germany, Italy, Spain, The Netherlands, US, Canada, Mexico, China, Japan, India, South Korea, Australia, Indonesia, Brazil, Argentina, Colombia, Saudi Arabia, UAE, South Africa, Israel and Turkey
Competitive landscape Leading Companies, Market Positioning of Companies, Competitive Strategies, and Industry Risks

Request Free Sample

Research Analyst Overview

  • The art tourism market is defined by a dynamic interplay between heritage and innovation, where cultural immersion travel is increasingly sought after by a global audience. This sector's growth is supported by a diverse ecosystem offering everything from archeological art tours to contemporary art fairs, with a notable shift towards bespoke art itineraries and experiential engagement.
  • The integration of technologies like virtual reality museum experience and augmented reality art guide is revolutionizing how consumers interact with cultural content, making private gallery access and artist studio visits more accessible. As a boardroom-level concern, sustainable cultural tourism is now a critical factor in long-term strategy, influencing decisions on investment in cultural heritage preservation.
  • Data indicates that destinations integrating robust sustainability and digital engagement strategies see visitor satisfaction scores improve by up to 30%. This reflects a market where curated digital content and authentic experiences, such as craft and artisan workshops and thematic cultural routes, are paramount for competitive differentiation and achieving strategic growth objectives.

What are the Key Data Covered in this Art Tourism Market Research and Growth Report?

  • What is the expected growth of the Art Tourism Market between 2026 and 2030?

    • USD 9.30 billion, at a CAGR of 3.7%

  • What segmentation does the market report cover?

    • The report is segmented by Type (Events and exhibitions, Art galleries and museums, and Others), Consumer (International, and Domestic), Mode of Booking (Offline, and Online) and Geography (Europe, North America, APAC, South America, Middle East and Africa)

  • Which regions are analyzed in the report?

    • Europe, North America, APAC, South America and Middle East and Africa

  • What are the key growth drivers and market challenges?

    • Increasing interest in cultural experiences and heritage exploration, High travel and accommodation costs

  • Who are the major players in the Art Tourism Market?

    • A and K Travel Group Ltd., Art of Travel, Arts and Leisure Tours., ArtSmart, Bookmundi ApS, Context Travel LLC, Imago Artis Travel Srl, Intrepid Group Pty Ltd., Juma Art Tours, Martin Randall Travel Ltd., Paint Away Tours LLC, Reality Tours and Travel, Shearings Holidays, The Blue Walk, The Travel Corp., Thomas Cook India Ltd., TourRadar GmbH, TripAdvisor Inc., Ultimate Travel Company Ltd. and WorldStrides Inc.

Market Research Insights

  • The dynamics of the art tourism market are increasingly shaped by evolving consumer preferences for authenticity and experiential depth. Travelers are actively seeking out curated travel experiences that offer more than passive observation, a trend substantiated by data showing that over 40% of international arrivals are now motivated by cultural and heritage interests.
  • This demand has spurred a diversification of offerings, from art and design tours to behind-the-scenes museum access. However, operators face significant economic pressures. For example, a 15% year-over-year increase in accommodation costs in prime cultural hubs directly impacts pricing strategies and accessibility for budget-conscious segments.
  • This tension between premium demand and cost barriers is forcing providers to innovate with tiered pricing and digital-first engagement models to maintain competitiveness and broaden their audience base.

We can help! Our analysts can customize this art tourism market research report to meet your requirements.

Get in touch

1. Executive Summary

1.1 Market overview

Executive Summary - Chart on Market Overview
Executive Summary - Data Table on Market Overview
Executive Summary - Chart on Global Market Characteristics
Executive Summary - Chart on Market by Geography
Executive Summary - Chart on Market Segmentation by Type
Executive Summary - Chart on Market Segmentation by Consumer
Executive Summary - Chart on Market Segmentation by Mode of Booking
Executive Summary - Chart on Incremental Growth
Executive Summary - Data Table on Incremental Growth
Executive Summary - Chart on Company Market Positioning

2. Technavio Analysis

2.1 Analysis of price sensitivity, lifecycle, customer purchase basket, adoption rates, and purchase criteria

2.2 Criticality of inputs and Factors of differentiation

Chart on Overview on criticality of inputs and factors of differentiation

2.3 Factors of disruption

Chart on Overview on factors of disruption

2.4 Impact of drivers and challenges

Chart on Impact of drivers and challenges in 2025 and 2030

3. Market Landscape

3.1 Market ecosystem

Chart on Parent Market
Data Table on - Parent Market

3.2 Market characteristics

Chart on Market characteristics analysis

3.3 Value chain analysis

Chart on Value chain analysis

4. Market Sizing

4.1 Market definition

Data Table on Offerings of companies included in the market definition

4.2 Market segment analysis

Market segments

4.3 Market size 2025

4.4 Market outlook: Forecast for 2025-2030

Chart on Global - Market size and forecast 2025-2030 ($ million)
Data Table on Global - Market size and forecast 2025-2030 ($ million)
Chart on Global Market: Year-over-year growth 2025-2030 (%)
Data Table on Global Market: Year-over-year growth 2025-2030 (%)

5. Historic Market Size

5.1 Global Art Tourism Market 2020 - 2024

Historic Market Size - Data Table on Global Art Tourism Market 2020 - 2024 ($ million)

5.2 Type segment analysis 2020 - 2024

Historic Market Size - Type Segment 2020 - 2024 ($ million)

5.3 Consumer segment analysis 2020 - 2024

Historic Market Size - Consumer Segment 2020 - 2024 ($ million)

5.4 Mode of Booking segment analysis 2020 - 2024

Historic Market Size - Mode of Booking Segment 2020 - 2024 ($ million)

5.5 Geography segment analysis 2020 - 2024

Historic Market Size - Geography Segment 2020 - 2024 ($ million)

5.6 Country segment analysis 2020 - 2024

Historic Market Size - Country Segment 2020 - 2024 ($ million)

6. Qualitative Analysis

6.1 Impact of AI on Global Art Tourism Market

7. Five Forces Analysis

7.1 Five forces summary

Five forces analysis - Comparison between 2025 and 2030

7.2 Bargaining power of buyers

Bargaining power of buyers - Impact of key factors 2025 and 2030

7.3 Bargaining power of suppliers

Bargaining power of suppliers - Impact of key factors in 2025 and 2030

7.4 Threat of new entrants

Threat of new entrants - Impact of key factors in 2025 and 2030

7.5 Threat of substitutes

Threat of substitutes - Impact of key factors in 2025 and 2030

7.6 Threat of rivalry

Threat of rivalry - Impact of key factors in 2025 and 2030

7.7 Market condition

Chart on Market condition - Five forces 2025 and 2030

8. Market Segmentation by Type

8.1 Market segments

Chart on Type - Market share 2025-2030 (%)
Data Table on Type - Market share 2025-2030 (%)

8.2 Comparison by Type

Chart on Comparison by Type
Data Table on Comparison by Type

8.3 Events and exhibitions - Market size and forecast 2025-2030

Chart on Events and exhibitions - Market size and forecast 2025-2030 ($ million)
Data Table on Events and exhibitions - Market size and forecast 2025-2030 ($ million)
Chart on Events and exhibitions - Year-over-year growth 2025-2030 (%)
Data Table on Events and exhibitions - Year-over-year growth 2025-2030 (%)

8.4 Art galleries and museums - Market size and forecast 2025-2030

Chart on Art galleries and museums - Market size and forecast 2025-2030 ($ million)
Data Table on Art galleries and museums - Market size and forecast 2025-2030 ($ million)
Chart on Art galleries and museums - Year-over-year growth 2025-2030 (%)
Data Table on Art galleries and museums - Year-over-year growth 2025-2030 (%)

8.5 Others - Market size and forecast 2025-2030

Chart on Others - Market size and forecast 2025-2030 ($ million)
Data Table on Others - Market size and forecast 2025-2030 ($ million)
Chart on Others - Year-over-year growth 2025-2030 (%)
Data Table on Others - Year-over-year growth 2025-2030 (%)

8.6 Market opportunity by Type

Market opportunity by Type ($ million)
Data Table on Market opportunity by Type ($ million)

9. Market Segmentation by Consumer

9.1 Market segments

Chart on Consumer - Market share 2025-2030 (%)
Data Table on Consumer - Market share 2025-2030 (%)

9.2 Comparison by Consumer

Chart on Comparison by Consumer
Data Table on Comparison by Consumer

9.3 International - Market size and forecast 2025-2030

Chart on International - Market size and forecast 2025-2030 ($ million)
Data Table on International - Market size and forecast 2025-2030 ($ million)
Chart on International - Year-over-year growth 2025-2030 (%)
Data Table on International - Year-over-year growth 2025-2030 (%)

9.4 Domestic - Market size and forecast 2025-2030

Chart on Domestic - Market size and forecast 2025-2030 ($ million)
Data Table on Domestic - Market size and forecast 2025-2030 ($ million)
Chart on Domestic - Year-over-year growth 2025-2030 (%)
Data Table on Domestic - Year-over-year growth 2025-2030 (%)

9.5 Market opportunity by Consumer

Market opportunity by Consumer ($ million)
Data Table on Market opportunity by Consumer ($ million)

10. Market Segmentation by Mode of Booking

10.1 Market segments

Chart on Mode of Booking - Market share 2025-2030 (%)
Data Table on Mode of Booking - Market share 2025-2030 (%)

10.2 Comparison by Mode of Booking

Chart on Comparison by Mode of Booking
Data Table on Comparison by Mode of Booking

10.3 Offline - Market size and forecast 2025-2030

Chart on Offline - Market size and forecast 2025-2030 ($ million)
Data Table on Offline - Market size and forecast 2025-2030 ($ million)
Chart on Offline - Year-over-year growth 2025-2030 (%)
Data Table on Offline - Year-over-year growth 2025-2030 (%)

10.4 Online - Market size and forecast 2025-2030

Chart on Online - Market size and forecast 2025-2030 ($ million)
Data Table on Online - Market size and forecast 2025-2030 ($ million)
Chart on Online - Year-over-year growth 2025-2030 (%)
Data Table on Online - Year-over-year growth 2025-2030 (%)

10.5 Market opportunity by Mode of Booking

Market opportunity by Mode of Booking ($ million)
Data Table on Market opportunity by Mode of Booking ($ million)

11. Customer Landscape

11.1 Customer landscape overview

Analysis of price sensitivity, lifecycle, customer purchase basket, adoption rates, and purchase criteria

12. Geographic Landscape

12.1 Geographic segmentation

Chart on Market share by geography 2025-2030 (%)
Data Table on Market share by geography 2025-2030 (%)

12.2 Geographic comparison

Chart on Geographic comparison
Data Table on Geographic comparison

12.3 Europe - Market size and forecast 2025-2030

Chart on Europe - Market size and forecast 2025-2030 ($ million)
Data Table on Europe - Market size and forecast 2025-2030 ($ million)
Chart on Europe - Year-over-year growth 2025-2030 (%)
Data Table on Europe - Year-over-year growth 2025-2030 (%)
Chart on Regional Comparison - Europe
Data Table on Regional Comparison - Europe

12.3.1 UK - Market size and forecast 2025-2030

Chart on UK - Market size and forecast 2025-2030 ($ million)
Data Table on UK - Market size and forecast 2025-2030 ($ million)
Chart on UK - Year-over-year growth 2025-2030 (%)
Data Table on UK - Year-over-year growth 2025-2030 (%)

12.3.2 France - Market size and forecast 2025-2030

Chart on France - Market size and forecast 2025-2030 ($ million)
Data Table on France - Market size and forecast 2025-2030 ($ million)
Chart on France - Year-over-year growth 2025-2030 (%)
Data Table on France - Year-over-year growth 2025-2030 (%)

12.3.3 Germany - Market size and forecast 2025-2030

Chart on Germany - Market size and forecast 2025-2030 ($ million)
Data Table on Germany - Market size and forecast 2025-2030 ($ million)
Chart on Germany - Year-over-year growth 2025-2030 (%)
Data Table on Germany - Year-over-year growth 2025-2030 (%)

12.3.4 Italy - Market size and forecast 2025-2030

Chart on Italy - Market size and forecast 2025-2030 ($ million)
Data Table on Italy - Market size and forecast 2025-2030 ($ million)
Chart on Italy - Year-over-year growth 2025-2030 (%)
Data Table on Italy - Year-over-year growth 2025-2030 (%)

12.3.5 Spain - Market size and forecast 2025-2030

Chart on Spain - Market size and forecast 2025-2030 ($ million)
Data Table on Spain - Market size and forecast 2025-2030 ($ million)
Chart on Spain - Year-over-year growth 2025-2030 (%)
Data Table on Spain - Year-over-year growth 2025-2030 (%)

12.3.6 The Netherlands - Market size and forecast 2025-2030

Chart on The Netherlands - Market size and forecast 2025-2030 ($ million)
Data Table on The Netherlands - Market size and forecast 2025-2030 ($ million)
Chart on The Netherlands - Year-over-year growth 2025-2030 (%)
Data Table on The Netherlands - Year-over-year growth 2025-2030 (%)

12.4 North America - Market size and forecast 2025-2030

Chart on North America - Market size and forecast 2025-2030 ($ million)
Data Table on North America - Market size and forecast 2025-2030 ($ million)
Chart on North America - Year-over-year growth 2025-2030 (%)
Data Table on North America - Year-over-year growth 2025-2030 (%)
Chart on Regional Comparison - North America
Data Table on Regional Comparison - North America

12.4.1 US - Market size and forecast 2025-2030

Chart on US - Market size and forecast 2025-2030 ($ million)
Data Table on US - Market size and forecast 2025-2030 ($ million)
Chart on US - Year-over-year growth 2025-2030 (%)
Data Table on US - Year-over-year growth 2025-2030 (%)

12.4.2 Canada - Market size and forecast 2025-2030

Chart on Canada - Market size and forecast 2025-2030 ($ million)
Data Table on Canada - Market size and forecast 2025-2030 ($ million)
Chart on Canada - Year-over-year growth 2025-2030 (%)
Data Table on Canada - Year-over-year growth 2025-2030 (%)

12.4.3 Mexico - Market size and forecast 2025-2030

Chart on Mexico - Market size and forecast 2025-2030 ($ million)
Data Table on Mexico - Market size and forecast 2025-2030 ($ million)
Chart on Mexico - Year-over-year growth 2025-2030 (%)
Data Table on Mexico - Year-over-year growth 2025-2030 (%)

12.5 APAC - Market size and forecast 2025-2030

Chart on APAC - Market size and forecast 2025-2030 ($ million)
Data Table on APAC - Market size and forecast 2025-2030 ($ million)
Chart on APAC - Year-over-year growth 2025-2030 (%)
Data Table on APAC - Year-over-year growth 2025-2030 (%)
Chart on Regional Comparison - APAC
Data Table on Regional Comparison - APAC

12.5.1 China - Market size and forecast 2025-2030

Chart on China - Market size and forecast 2025-2030 ($ million)
Data Table on China - Market size and forecast 2025-2030 ($ million)
Chart on China - Year-over-year growth 2025-2030 (%)
Data Table on China - Year-over-year growth 2025-2030 (%)

12.5.2 Japan - Market size and forecast 2025-2030

Chart on Japan - Market size and forecast 2025-2030 ($ million)
Data Table on Japan - Market size and forecast 2025-2030 ($ million)
Chart on Japan - Year-over-year growth 2025-2030 (%)
Data Table on Japan - Year-over-year growth 2025-2030 (%)

12.5.3 India - Market size and forecast 2025-2030

Chart on India - Market size and forecast 2025-2030 ($ million)
Data Table on India - Market size and forecast 2025-2030 ($ million)
Chart on India - Year-over-year growth 2025-2030 (%)
Data Table on India - Year-over-year growth 2025-2030 (%)

12.5.4 South Korea - Market size and forecast 2025-2030

Chart on South Korea - Market size and forecast 2025-2030 ($ million)
Data Table on South Korea - Market size and forecast 2025-2030 ($ million)
Chart on South Korea - Year-over-year growth 2025-2030 (%)
Data Table on South Korea - Year-over-year growth 2025-2030 (%)

12.5.5 Australia - Market size and forecast 2025-2030

Chart on Australia - Market size and forecast 2025-2030 ($ million)
Data Table on Australia - Market size and forecast 2025-2030 ($ million)
Chart on Australia - Year-over-year growth 2025-2030 (%)
Data Table on Australia - Year-over-year growth 2025-2030 (%)

12.5.6 Indonesia - Market size and forecast 2025-2030

Chart on Indonesia - Market size and forecast 2025-2030 ($ million)
Data Table on Indonesia - Market size and forecast 2025-2030 ($ million)
Chart on Indonesia - Year-over-year growth 2025-2030 (%)
Data Table on Indonesia - Year-over-year growth 2025-2030 (%)

12.6 South America - Market size and forecast 2025-2030

Chart on South America - Market size and forecast 2025-2030 ($ million)
Data Table on South America - Market size and forecast 2025-2030 ($ million)
Chart on South America - Year-over-year growth 2025-2030 (%)
Data Table on South America - Year-over-year growth 2025-2030 (%)
Chart on Regional Comparison - South America
Data Table on Regional Comparison - South America

12.6.1 Brazil - Market size and forecast 2025-2030

Chart on Brazil - Market size and forecast 2025-2030 ($ million)
Data Table on Brazil - Market size and forecast 2025-2030 ($ million)
Chart on Brazil - Year-over-year growth 2025-2030 (%)
Data Table on Brazil - Year-over-year growth 2025-2030 (%)

12.6.2 Argentina - Market size and forecast 2025-2030

Chart on Argentina - Market size and forecast 2025-2030 ($ million)
Data Table on Argentina - Market size and forecast 2025-2030 ($ million)
Chart on Argentina - Year-over-year growth 2025-2030 (%)
Data Table on Argentina - Year-over-year growth 2025-2030 (%)

12.6.3 Colombia - Market size and forecast 2025-2030

Chart on Colombia - Market size and forecast 2025-2030 ($ million)
Data Table on Colombia - Market size and forecast 2025-2030 ($ million)
Chart on Colombia - Year-over-year growth 2025-2030 (%)
Data Table on Colombia - Year-over-year growth 2025-2030 (%)

12.7 Middle East and Africa - Market size and forecast 2025-2030

Chart on Middle East and Africa - Market size and forecast 2025-2030 ($ million)
Data Table on Middle East and Africa - Market size and forecast 2025-2030 ($ million)
Chart on Middle East and Africa - Year-over-year growth 2025-2030 (%)
Data Table on Middle East and Africa - Year-over-year growth 2025-2030 (%)
Chart on Regional Comparison - Middle East and Africa
Data Table on Regional Comparison - Middle East and Africa

12.7.1 Saudi Arabia - Market size and forecast 2025-2030

Chart on Saudi Arabia - Market size and forecast 2025-2030 ($ million)
Data Table on Saudi Arabia - Market size and forecast 2025-2030 ($ million)
Chart on Saudi Arabia - Year-over-year growth 2025-2030 (%)
Data Table on Saudi Arabia - Year-over-year growth 2025-2030 (%)

12.7.2 UAE - Market size and forecast 2025-2030

Chart on UAE - Market size and forecast 2025-2030 ($ million)
Data Table on UAE - Market size and forecast 2025-2030 ($ million)
Chart on UAE - Year-over-year growth 2025-2030 (%)
Data Table on UAE - Year-over-year growth 2025-2030 (%)

12.7.3 South Africa - Market size and forecast 2025-2030

Chart on South Africa - Market size and forecast 2025-2030 ($ million)
Data Table on South Africa - Market size and forecast 2025-2030 ($ million)
Chart on South Africa - Year-over-year growth 2025-2030 (%)
Data Table on South Africa - Year-over-year growth 2025-2030 (%)

12.7.4 Israel - Market size and forecast 2025-2030

Chart on Israel - Market size and forecast 2025-2030 ($ million)
Data Table on Israel - Market size and forecast 2025-2030 ($ million)
Chart on Israel - Year-over-year growth 2025-2030 (%)
Data Table on Israel - Year-over-year growth 2025-2030 (%)

12.7.5 Turkey - Market size and forecast 2025-2030

Chart on Turkey - Market size and forecast 2025-2030 ($ million)
Data Table on Turkey - Market size and forecast 2025-2030 ($ million)
Chart on Turkey - Year-over-year growth 2025-2030 (%)
Data Table on Turkey - Year-over-year growth 2025-2030 (%)

12.8 Market opportunity by geography

Market opportunity by geography ($ million)
Data Tables on Market opportunity by geography ($ million)

13. Drivers, Challenges, and Opportunity

13.1 Market drivers

Increasing interest in cultural experiences and heritage exploration
Growth in international and domestic travel
Rising government initiatives to promote cultural destinations

13.2 Market challenges

High travel and accommodation costs
Seasonal demand fluctuations
Preservation and maintenance issues of heritage sites

13.3 Impact of drivers and challenges

Impact of drivers and challenges in 2025 and 2030

13.4 Market opportunities

Rising development of immersive and experiential art events
Rapid digital promotion through social media and virtual tours
Expansion of art festivals and cross border cultural collaborations

14. Competitive Landscape

14.1 Overview

14.2

Overview on criticality of inputs and factors of differentiation

14.3 Landscape disruption

Overview on factors of disruption

14.4 Industry risks

Impact of key risks on business

15. Competitive Analysis

15.1 Companies profiled

Companies covered

15.2 Company ranking index

15.3 Market positioning of companies

Matrix on companies position and classification

15.4 A and K Travel Group Ltd.

A and K Travel Group Ltd. - Overview
A and K Travel Group Ltd. - Product / Service
A and K Travel Group Ltd. - Key offerings
SWOT

15.5 Art of Travel

Art of Travel - Overview
Art of Travel - Product / Service
Art of Travel - Key offerings
SWOT

15.6 Arts and Leisure Tours.

Arts and Leisure Tours. - Overview
Arts and Leisure Tours. - Product / Service
Arts and Leisure Tours. - Key offerings
SWOT

15.7 ArtSmart

ArtSmart - Overview
ArtSmart - Product / Service
ArtSmart - Key offerings
SWOT

15.8 Bookmundi ApS

Bookmundi ApS - Overview
Bookmundi ApS - Product / Service
Bookmundi ApS - Key offerings
SWOT

15.9 Context Travel LLC

Context Travel LLC - Overview
Context Travel LLC - Product / Service
Context Travel LLC - Key offerings
SWOT

15.10 Imago Artis Travel Srl

Imago Artis Travel Srl - Overview
Imago Artis Travel Srl - Product / Service
Imago Artis Travel Srl - Key offerings
SWOT

15.11 Juma Art Tours

Juma Art Tours - Overview
Juma Art Tours - Product / Service
Juma Art Tours - Key offerings
SWOT

15.12 Shearings Holidays

Shearings Holidays - Overview
Shearings Holidays - Product / Service
Shearings Holidays - Key offerings
SWOT

15.13 The Travel Corp.

The Travel Corp. - Overview
The Travel Corp. - Product / Service
The Travel Corp. - Key offerings
SWOT

15.14 Thomas Cook India Ltd.

Thomas Cook India Ltd. - Overview
Thomas Cook India Ltd. - Business segments
Thomas Cook India Ltd. - Key offerings
Thomas Cook India Ltd. - Segment focus
SWOT

15.15 TourRadar GmbH

TourRadar GmbH - Overview
TourRadar GmbH - Product / Service
TourRadar GmbH - Key offerings
SWOT

15.16 TripAdvisor Inc.

TripAdvisor Inc. - Overview
TripAdvisor Inc. - Business segments
TripAdvisor Inc. - Key offerings
TripAdvisor Inc. - Segment focus
SWOT

15.17 Ultimate Travel Company Ltd.

Ultimate Travel Company Ltd. - Overview
Ultimate Travel Company Ltd. - Product / Service
Ultimate Travel Company Ltd. - Key offerings
SWOT

15.18 WorldStrides Inc.

WorldStrides Inc. - Overview
WorldStrides Inc. - Product / Service
WorldStrides Inc. - Key offerings
SWOT

16. Appendix

16.1 Scope of the report

Market definition
Objectives
Notes and caveats

16.2 Inclusions and exclusions checklist

Inclusions checklist
Exclusions checklist

16.3 Currency conversion rates for US$

16.4 Research methodology

16.5 Data procurement

Information sources

16.6 Data validation

16.7 Validation techniques employed for market sizing

16.8 Data synthesis

16.9 360 degree market analysis

16.10 List of abbreviations

Research Methodology

Technavio presents a detailed picture of the market by way of study, synthesis, and summation of data from multiple sources. The analysts have presented the various facets of the market with a particular focus on identifying the key industry influencers. The data thus presented is comprehensive, reliable, and the result of extensive research, both primary and secondary.

INFORMATION SOURCES

Primary sources

  • Manufacturers and suppliers
  • Channel partners
  • Industry experts
  • Strategic decision makers

Secondary sources

  • Industry journals and periodicals
  • Government data
  • Financial reports of key industry players
  • Historical data
  • Press releases

DATA ANALYSIS

Data Synthesis

  • Collation of data
  • Estimation of key figures
  • Analysis of derived insights

Data Validation

  • Triangulation with data models
  • Reference against proprietary databases
  • Corroboration with industry experts

REPORT WRITING

Qualitative

  • Market drivers
  • Market challenges
  • Market trends
  • Five forces analysis

Quantitative

  • Market size and forecast
  • Market segmentation
  • Geographical insights
  • Competitive landscape

Interested in this report?

Get your sample now to see our research methodology and insights!

Download Now

Frequently Asked Questions

Art Tourism market growth will increase by USD 9304.7 million during 2026-2030.

The Art Tourism market is expected to grow at a CAGR of 3.7% during 2026-2030.

Art Tourism market is segmented by Type (Events and exhibitions, Art galleries and museums, Others) Consumer (International, Domestic) Mode of booking (Offline, Online)

A and K Travel Group Ltd., Art of Travel, Arts and Leisure Tours., ArtSmart, Bookmundi ApS, Context Travel LLC, Imago Artis Travel Srl, Intrepid Group Pty Ltd., Juma Art Tours, Martin Randall Travel Ltd., Paint Away Tours LLC, Reality Tours and Travel, Shearings Holidays, The Blue Walk, The Travel Corp., Thomas Cook India Ltd., TourRadar GmbH, TripAdvisor Inc., Ultimate Travel Company Ltd., WorldStrides Inc. are a few of the key vendors in the Art Tourism market.

Europe will register the highest growth rate of 36% among the other regions. Therefore, the Art Tourism market in Europe is expected to garner significant business opportunities for the vendors during the forecast period.

UK, France, Germany, Italy, Spain, The Netherlands, US, Canada, Mexico, China, Japan, India, South Korea, Australia, Indonesia, Brazil, Argentina, Colombia, Saudi Arabia, UAE, South Africa, Israel, Turkey

  • Increasing interest in cultural experiences and heritage exploration is the driving factor this market.

The Art Tourism market vendors should focus on grabbing business opportunities from the Type segment as it accounted for the largest market share in the base year.
RIA - Research AI Assistant
Ask RIA