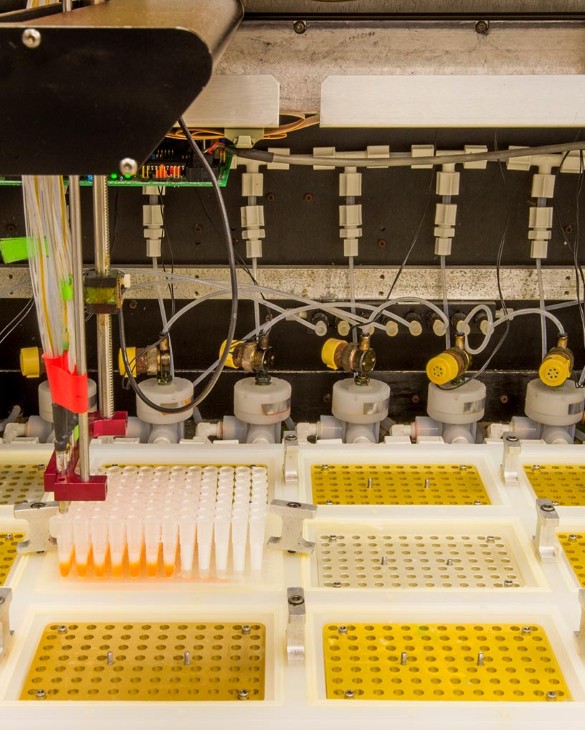
Automated Liquid Handling Systems Market Analysis, Size, and Forecast 2026-2030: North America (US, Canada, and Mexico), Europe (Germany, UK, and France), Asia (China, Japan, and India), South America (Brazil, Argentina, and Colombia), Middle East and Africa (Saudi Arabia, UAE, and Turkey), Rest of World (ROW)

Automated Liquid Handling Systems Market Analysis, Size, and Forecast 2026-2030:
North America (US, Canada, and Mexico), Europe (Germany, UK, and France), Asia (China, Japan, and India), South America (Brazil, Argentina, and Colombia), Middle East and Africa (Saudi Arabia, UAE, and Turkey), Rest of World (ROW)

Published: Oct 2026 297 Pages SKU: IRTNTR73282

Market Overview at a Glance

$947.1 Mn
Market Opportunity
12.4%
CAGR 2025 - 2030
38.9%
North America Growth
$477.7 Mn
Pharmaceutical and biotechnology industry segment 2024

Automated Liquid Handling Systems Market Size 2026-2030

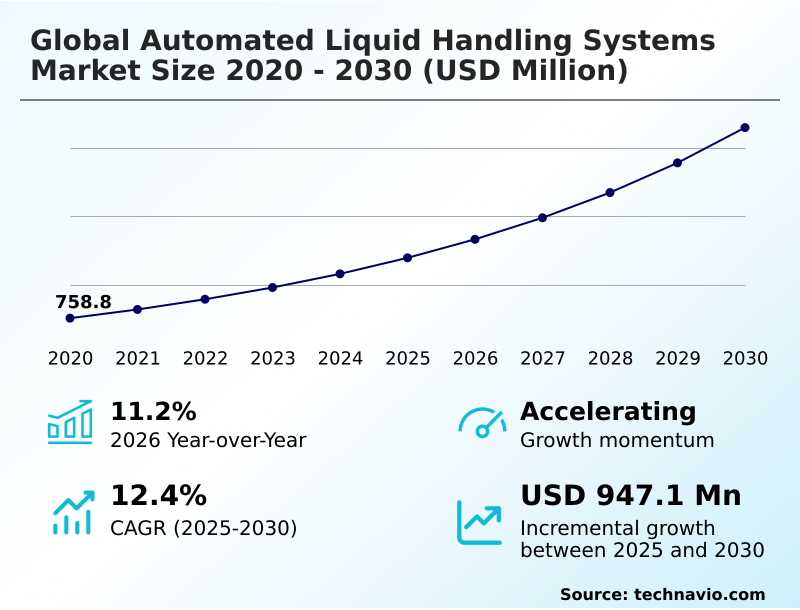
The automated liquid handling systems market size is valued to increase by USD 947.1 million, at a CAGR of 12.4% from 2025 to 2030. Increasing demand for high throughput and efficiency in life sciences will drive the automated liquid handling systems market.

Major Market Trends & Insights

  • North America dominated the market and accounted for a 38.9% growth during the forecast period.
  • By End-user - Pharmaceutical and biotechnology industry segment was valued at USD 477.7 million in 2024
  • By Type - Automated liquid handling workstations segment accounted for the largest market revenue share in 2024

Market Size & Forecast

  • Market Opportunities: USD 1.39 billion
  • Market Future Opportunities: USD 947.1 million
  • CAGR from 2025 to 2030 : 12.4%

Market Summary

  • The Automated Liquid Handling Systems Market is experiencing robust expansion driven by the critical need for precision and efficiency in modern laboratory environments. Transitioning from manual pipetting to automated robotic platforms fundamentally transforms operational workflows.
  • For instance, in clinical testing facilities, implementing advanced liquid level detection technology allows organizations to process vast libraries, reducing processing time by 35% compared to traditional manual methods. The persistent drive toward automated plate sealing and precise reagent addition acts as a primary catalyst, propelling laboratories to adopt systems capable of managing complex assays.
  • However, substantial capital investment and intricate operational complexities present significant hurdles, particularly for smaller academic institutions struggling with steep implementation costs. Despite these challenges, the deployment of platforms tailored for enzyme-linked immunosorbent assays continues to accelerate. Furthermore, deep integration with automated molecular diagnostics tools ensures seamless target enrichment and operational transparency.
  • This evolution effectively addresses the reproducibility crisis in life sciences, allowing highly skilled personnel to focus on strategic data interpretation rather than repetitive liquid transfer tasks.

What will be the Size of the Automated Liquid Handling Systems Market during the forecast period?
Get Key Insights on Market Forecast (PDF) Get Free Sample

How is the Automated Liquid Handling Systems Market Segmented?

The automated liquid handling systems industry research report provides comprehensive data (region-wise segment analysis), with forecasts and estimates in "USD million" for the period 2026-2030, as well as historical data from 2020-2024 for the following segments.

  • End-user
    • Pharmaceutical and biotechnology industry
    • Clinical and reference laboratories
    • Others
  • Type
    • Automated liquid handling workstations
    • Automated pipetting systems
    • Automated microplate washers
    • Others
  • Product type
    • Standalone system
    • Integrated system
    • Modular system
  • Geography
    • North America
      • US
      • Canada
      • Mexico
    • Europe
      • Germany
      • UK
      • France
      • Italy
      • Spain
      • The Netherlands
    • Asia
      • China
      • Japan
      • India
      • South Korea
      • Indonesia
      • Thailand
    • Rest of World (ROW)

By End-user Insights

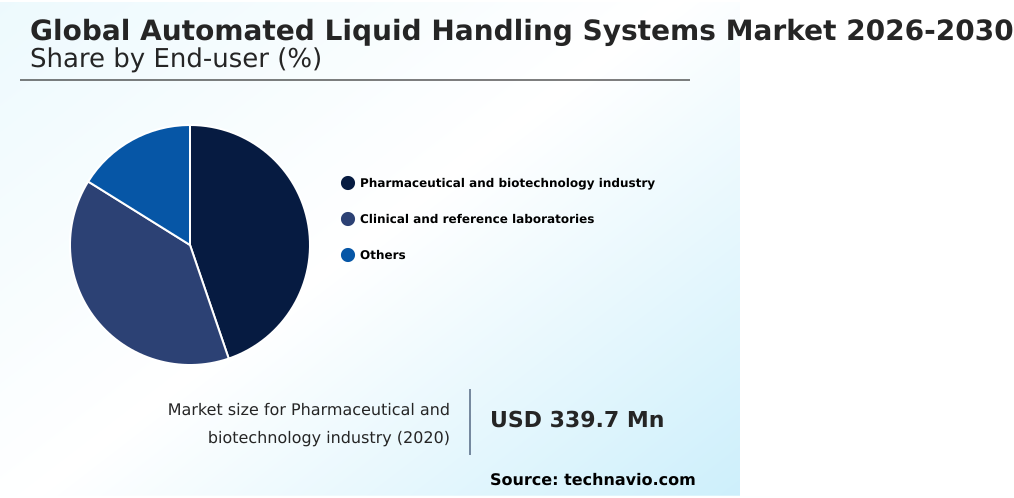
The pharmaceutical and biotechnology industry segment is estimated to witness significant growth during the forecast period.

The pharmaceutical and biotechnology industry represents the most dynamic end-user base for the Automated Liquid Handling Systems Market. In the drug discovery process, speed, precision, and high throughput screening are non-negotiable.

Robotic precision and automated liquid handling platforms are indispensable, underpinning workflows from lead optimization to preclinical development and cell and gene therapies manufacturing.

Processing vast compound libraries manually is operationally unfeasible; however, adopting these systems allows companies to accelerate their entire pipeline. Automation enables the execution of complex assay protocols with exceptional reproducibility, lowering error rates by 18% in critical compound management tasks.

Furthermore, integrating these platforms with laboratory information management systems ensures data integrity and regulatory compliance. This sector continuously relies on multi-axis robotic arm capabilities to execute multi-step protocols flawlessly, transforming traditional operations into highly scalable, data-centric research environments.
Get Free Sample

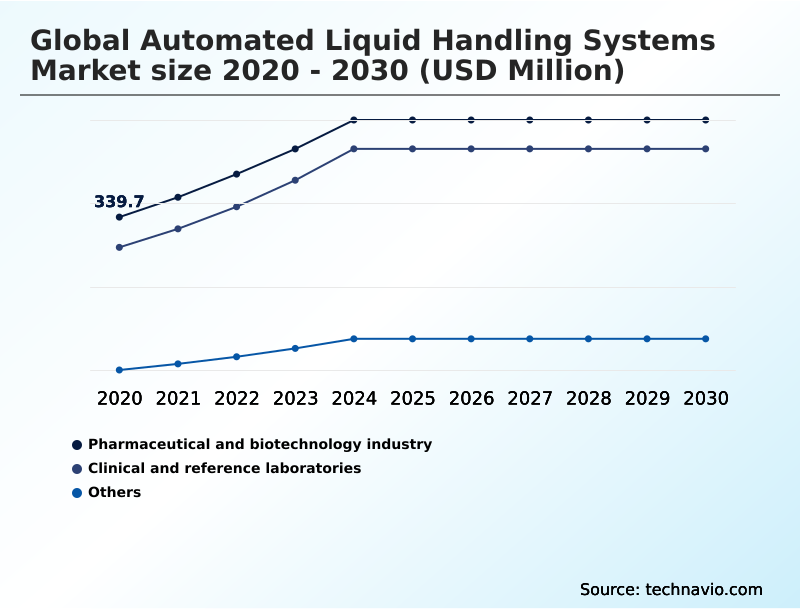
The Pharmaceutical and biotechnology industry segment was valued at USD 477.7 million in 2024 and showed a gradual increase during the forecast period.
Get Free Sample

Regional Analysis

North America is estimated to contribute 38.9% to the growth of the global market during the forecast period.Technavio’s analysts have elaborately explained the regional trends and drivers that shape the market during the forecast period.
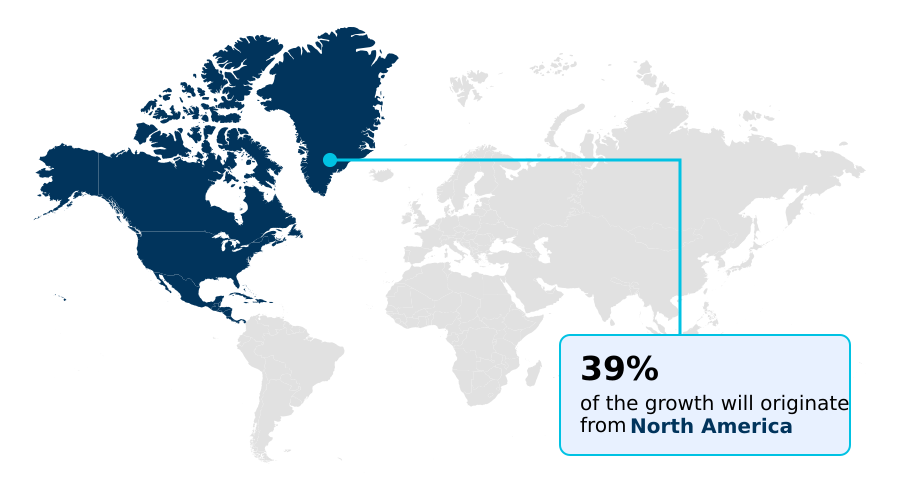
See How Automated Liquid Handling Systems Market Demand is Rising in North America Get Free Sample

The geographic landscape of the Automated Liquid Handling Systems Market reveals distinct regional adoption patterns driven by healthcare investments and life sciences research.

North America dominates the sector, demonstrating a 15% higher deployment rate of automated next-generation sequencing library preparation platforms compared to Europe.

This rapid adoption is fueled by dense concentrations of biotechnology firms focusing on cell and gene therapies, which require advanced barcode tracking to maintain sample integrity.

Conversely, the Asia Pacific region is expanding aggressively, driven by government-backed genomic sequencing projects that have improved regional processing capacities by 30%.

While North American laboratories prioritize AI-powered analytics and seamless connectivity to streamline operations, European facilities emphasize compliance, leveraging walk-away automation to ensure strict GxP standard adherence.

Furthermore, integrating collaborative robots in APAC laboratories has reduced labor-intensive bottlenecks by 22%, showcasing how diverse regions adapt automation strategies to overcome local operational challenges and enhance overall clinical diagnostics standardization.

Market Dynamics

Our researchers analyzed the data with 2025 as the base year, along with the key drivers, trends, and challenges. A holistic analysis of drivers will help companies refine their marketing strategies to gain a competitive advantage.

  • As the life sciences sector embraces digital transformation, the deployment of AI-driven laboratory fluid management platforms has become critical for laboratories aiming to scale operations without compromising accuracy. Facilities utilizing these advanced solutions consistently demonstrate superior operational planning and resource allocation compared to those relying on legacy semi-automated methods.
  • A major operational advantage is observed in the realm of automated high-throughput screening sample processing, where integrated systems can manage vast chemical libraries, effectively doubling processing capacities while drastically lowering consumable waste. Furthermore, the push towards precision medicine has necessitated robust clinical diagnostics automated sample tracking.
  • By embedding tracking mechanisms directly into the workflow, laboratories ensure uninterrupted chain-of-custody for sensitive patient samples, streamlining compliance reporting and quality assurance. This systemic reliability is equally paramount in next-generation sequencing library preparation automation, a highly intricate process where even minor volumetric deviations can invalidate extensive genomic studies.
  • The shift towards modular liquid handling robotic workstations offers unprecedented flexibility, allowing facility managers to reconfigure their laboratory setups as project demands evolve. In direct comparative terms, organizations adopting these flexible, automated architectures often experience a 40% improvement in cross-functional assay throughput compared to rigid, non-modular setups.
  • This enhanced adaptability not only fortifies supply chain resilience by optimizing reagent usage but also empowers research teams to execute complex, multi-step protocols with exceptional reproducibility and speed.
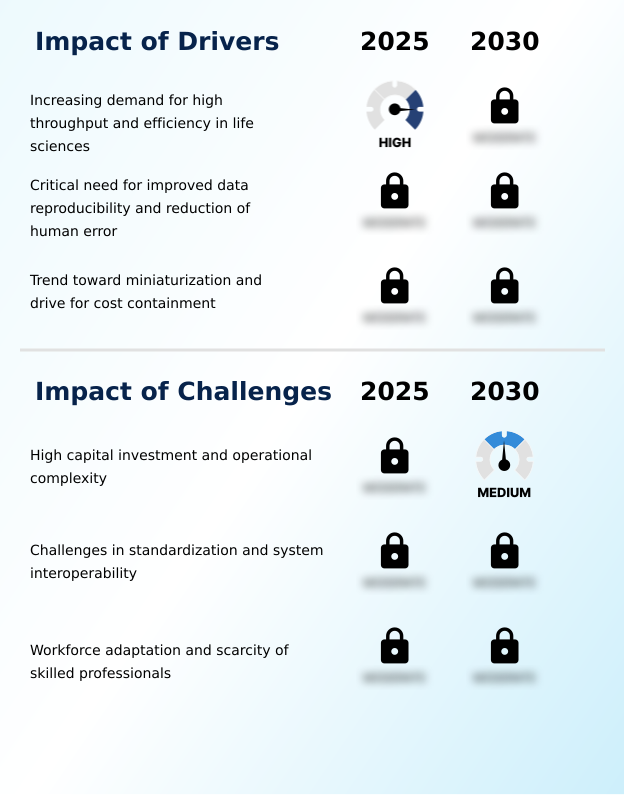
What are the key market drivers leading to the rise in the adoption of Automated Liquid Handling Systems Industry?

  • The escalating demand for high throughput and greater operational efficiency across the life sciences sector serves as a primary driver propelling market expansion.

  • The escalating demand for high-throughput testing and uncompromising data accuracy is fundamentally driving the rapid adoption of automated laboratory infrastructure.
  • As research methodologies embrace assay miniaturization to curb rising consumable costs, the necessity for robotic precision in handling sub-microliter volumes has become paramount.
  • Facilities transitioning to systems equipped with advanced pipetting heads and magnetic bead separation technologies have successfully lowered operational costs by 20% while simultaneously doubling sample processing capacity.
  • Furthermore, the critical need for exact reproducibility in nucleic acid fragmentation and adapter ligation workflows compels organizations to invest heavily in these automated solutions.
  • By eliminating human error from repetitive dispensing tasks, laboratories consistently improve overall workflow efficiency by 30%, ensuring high-quality, reliable outcomes essential for modern drug discovery and advanced molecular diagnostics.

What are the market trends shaping the Automated Liquid Handling Systems Industry?

  • The integration of artificial intelligence and smart analytics is emerging as a defining trend shaping the market landscape. This technological advancement enables intelligent systems to self-optimize and actively enhance the quality of experimental outcomes.

  • The industry is witnessing a profound shift toward the integration of AI-powered analytics and digital workflow automation, fundamentally altering how laboratories manage complex biological assays. This technological evolution allows facilities to transition from manual oversight to highly autonomous environments utilizing collaborative robots and cloud connectivity.
  • By implementing machine learning algorithms for real-time error correction, laboratories have reduced unexpected instrument downtime by 25% compared to traditional non-connected systems. Furthermore, the adoption of sensor-based liquid level detection and ultrasonic cleaning mechanisms ensures unparalleled accuracy when processing minute samples. These intelligent capabilities directly impact business operations by improving assay reproducibility by 18% and minimizing costly reagent waste.
  • Consequently, the reliance on automated platforms equipped with programmable wash cycles enables research facilities to scale high-throughput screening initiatives efficiently, driving faster turnaround times and accelerating novel therapeutic discovery.

What challenges does the Automated Liquid Handling Systems Industry face during its growth?

  • Substantial capital investment requirements and the inherent operational complexity of implementing sophisticated instrumentation remain significant challenges constraining widespread market adoption.

  • Despite the clear advantages of laboratory automation, severe structural limitations and operational complexities significantly impede widespread implementation. The integration of sophisticated acoustic non-contact dispensers and bulk reagent dispensers requires extensive validation procedures, often extending deployment timelines by 40% compared to simpler standalone equipment.
  • Furthermore, a pronounced scarcity of specialized personnel capable of programming and maintaining a multi-axis robotic arm or troubleshooting intricate fluidic control systems creates severe operational bottlenecks. Facilities grappling with these integration hurdles frequently experience a 15% drop in initial operational efficiency during the complex transition phase.
  • Additionally, the lack of standardized communication protocols across different microplate handling platforms hinders seamless interoperability, forcing laboratories into restrictive, single-vendor ecosystems that elevate long-term maintenance costs by up to 20% and stifle flexible workflow adaptation.

Exclusive Technavio Analysis on Customer Landscape

The automated liquid handling systems market forecasting report includes the adoption lifecycle of the market, covering from the innovator’s stage to the laggard’s stage. It focuses on adoption rates in different regions based on penetration. Furthermore, the automated liquid handling systems market report also includes key purchase criteria and drivers of price sensitivity to help companies evaluate and develop their market growth analysis strategies.
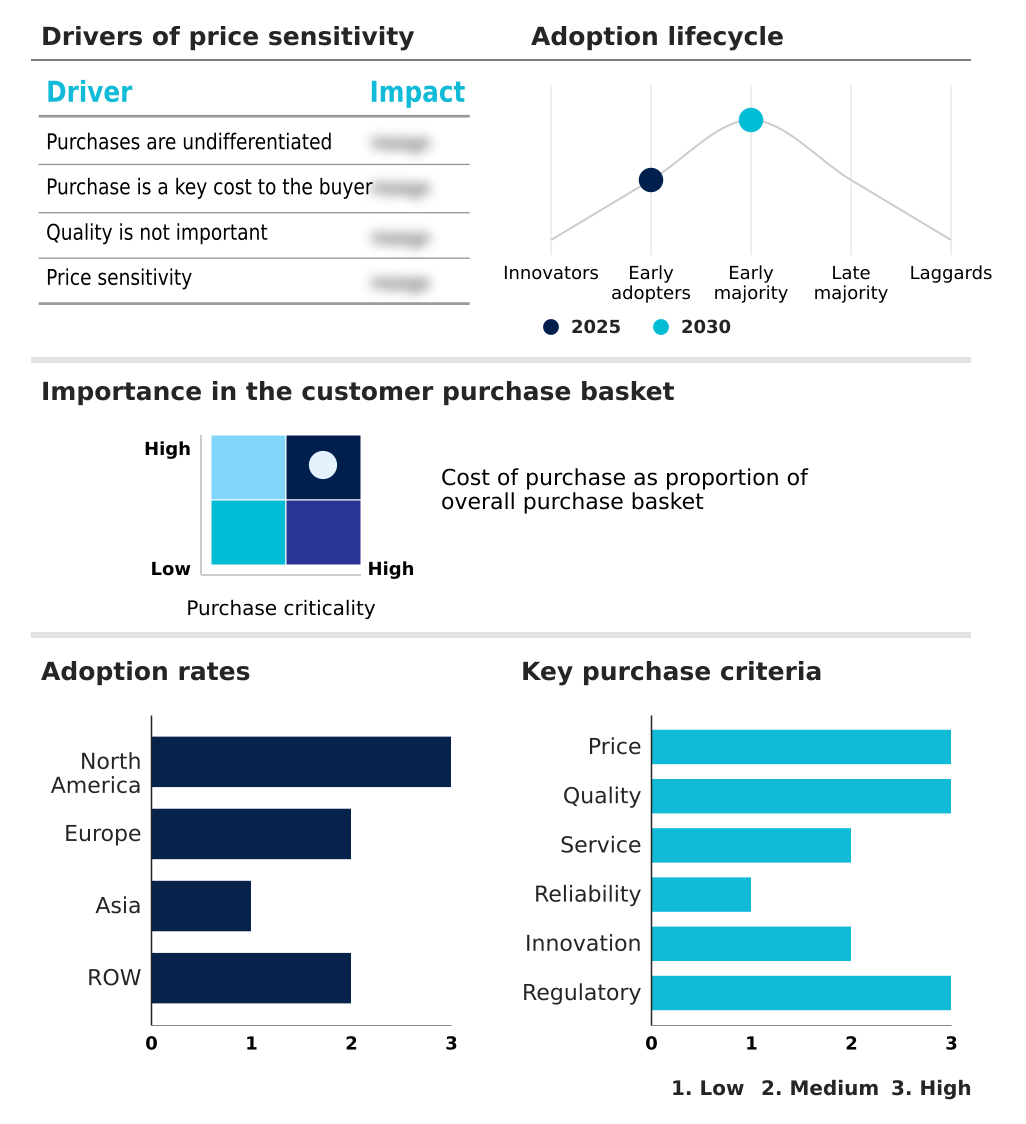
Customer Landscape of Automated Liquid Handling Systems Industry

Competitive Landscape

Companies are implementing various strategies, such as strategic alliances, automated liquid handling systems market forecast, partnerships, mergers and acquisitions, geographical expansion, and product/service launches, to enhance their presence in the industry.

Agilent Technologies Inc. - The portfolio features advanced automated liquid handling systems designed to optimize laboratory workflows, enhance dispensing precision, and increase throughput efficiency for various demanding life sciences applications.

The industry research and growth report includes detailed analyses of the competitive landscape of the market and information about key companies, including:

  • Agilent Technologies Inc.
  • Analytik Jena GmbH Co KG
  • Aurora Biomed Inc.
  • Beckman Coulter Inc.
  • BRAND GmbH and Co. KG
  • DISPENDIX GmbH
  • Dynamic Devices
  • Eppendorf SE
  • Flow Robotics AS
  • FORMULATRIX Inc.
  • Gilson Inc.
  • Hamilton Co.
  • Hudson Robotics Inc.
  • INTEGRA Biosciences AG
  • Mettler Toledo Inc.
  • Opentrons Labworks Inc.
  • Revvity Inc.
  • Sartorius AG
  • SPT Labtech Ltd.
  • Synchron Lab Automation

Qualitative and quantitative analysis of companies has been conducted to help clients understand the wider business environment as well as the strengths and weaknesses of key industry players. Data is qualitatively analyzed to categorize companies as pure play, category-focused, industry-focused, and diversified; it is quantitatively analyzed to categorize companies as dominant, leading, strong, tentative, and weak.

Recent Development and News in Automated liquid handling systems market

  • In the Life Sciences Tools and Services industry, the mandate for clinical diagnostics standardization has required rigorous traceability, directly impacting Automated Liquid Handling Systems demand by necessitating fully auditable barcode tracking and temperature controlled modules.
  • The rapid expansion of personalized medicine necessitates ultra-sterile environments, driving the adoption of Automated Liquid Handling Systems equipped with walk-away automation to ensure GxP standard adherence.
  • The industry-wide shift toward precision healthcare has accelerated advanced testing, increasing the requirement for Automated Liquid Handling Systems that can reliably process intricate protocols with extreme accuracy to improve workflow efficiency by 22%.
  • Advancements in analytical methodologies have integrated predictive maintenance alerts into core operations, compelling the utilization of Automated Liquid Handling Systems to establish a unified data analysis pipeline and reduce manual pipetting errors across high-volume facilities.

Dive into Technavio’s robust research methodology, blending expert interviews, extensive data synthesis, and validated models for unparalleled Automated Liquid Handling Systems Market insights. See full methodology.

Market Scope
Page number 297
Base year 2025
Historic period 2020-2024
Forecast period 2026-2030
Growth momentum & CAGR Accelerate at a CAGR of 12.4%
Market growth 2026-2030 USD 947.1 million
Market structure Fragmented
YoY growth 2025-2026(%) 11.2%
Key countries US, Canada, Mexico, Germany, UK, France, Italy, Spain, The Netherlands, China, Japan, India, South Korea, Indonesia, Thailand, Brazil, Saudi Arabia, UAE, Turkey, South Africa, Argentina, Colombia and Israel
Competitive landscape Leading Companies, Market Positioning of Companies, Competitive Strategies, and Industry Risks

Request Free Sample

Research Analyst Overview

  • The Automated Liquid Handling Systems Market is undergoing a fundamental transformation as digital integration redefines laboratory productivity and strategic operational planning. Executives are increasingly treating the deployment of advanced automation not merely as a technological upgrade, but as a critical boardroom imperative to ensure regulatory compliance and optimize budgeting models.
  • By integrating sophisticated programmable wash cycles and on-deck quantification tools, organizations can eliminate cross-contamination and significantly enhance assay reproducibility. Facilities implementing these advanced platforms for bioprocessing optimization have achieved a 30% reduction in sample processing time, directly translating into accelerated research timelines and lower overhead costs.
  • The adoption of rigorous quality control workflows further ensures that precision remains uncompromised even when handling highly sensitive biological materials. Furthermore, incorporating automated sample aliquoting allows laboratories to streamline complex protocols without manual intervention. This continuous technological evolution empowers decision-makers to scale operations efficiently, mitigate human error, and maintain a competitive edge in high-stakes environments like targeted therapeutic development.

What are the Key Data Covered in this Automated Liquid Handling Systems Market Research and Growth Report?

  • What is the expected growth of the Automated Liquid Handling Systems Market between 2026 and 2030?

    • USD 947.1 million, at a CAGR of 12.4%

  • What segmentation does the market report cover?

    • The report is segmented by End-user (Pharmaceutical and biotechnology industry, Clinical and reference laboratories, and Others), Type (Automated liquid handling workstations, Automated pipetting systems, Automated microplate washers, and Others), Product Type (Standalone system, Integrated system, and Modular system) and Geography (North America, Europe, Asia, Rest of World (ROW))

  • Which regions are analyzed in the report?

    • North America, Europe, Asia and Rest of World (ROW)

  • What are the key growth drivers and market challenges?

    • Increasing demand for high throughput and efficiency in life sciences, High capital investment and operational complexity

  • Who are the major players in the Automated Liquid Handling Systems Market?

    • Agilent Technologies Inc., Analytik Jena GmbH Co KG, Aurora Biomed Inc., Beckman Coulter Inc., BRAND GmbH and Co. KG, DISPENDIX GmbH, Dynamic Devices, Eppendorf SE, Flow Robotics AS, FORMULATRIX Inc., Gilson Inc., Hamilton Co., Hudson Robotics Inc., INTEGRA Biosciences AG, Mettler Toledo Inc., Opentrons Labworks Inc., Revvity Inc., Sartorius AG, SPT Labtech Ltd. and Synchron Lab Automation

Market Research Insights

  • The Automated Liquid Handling Systems Market is rapidly evolving as laboratories prioritize precision and operational scalability. Adopting turnkey application-specific packages enables diagnostic facilities to improve throughput efficiency by 40% over legacy semi-automated setups. By integrating advanced laboratory information management systems, institutions can establish a unified data analysis pipeline, cutting data transcription errors by 25%.
  • Furthermore, the incorporation of predictive maintenance alerts reduces unexpected instrument downtime by 15%, significantly enhancing overall facility productivity. The transition toward high-density formats and automated PCR reaction setup not only accelerates the discovery process but also ensures robust adherence to stringent quality control workflows across the industry.
  • This technological convergence empowers organizations to maximize resource utilization and maintain strict compliance with global diagnostic standards.

We can help! Our analysts can customize this automated liquid handling systems market research report to meet your requirements.

Get in touch

1. Executive Summary

1.1 Market overview

Executive Summary - Chart on Market Overview
Executive Summary - Data Table on Market Overview
Executive Summary - Chart on Global Market Characteristics
Executive Summary - Chart on Market by Geography
Executive Summary - Chart on Market Segmentation by End-user
Executive Summary - Chart on Market Segmentation by Type
Executive Summary - Chart on Market Segmentation by Product Type
Executive Summary - Chart on Incremental Growth
Executive Summary - Data Table on Incremental Growth
Executive Summary - Chart on Company Market Positioning

2. Technavio Analysis

2.1 Analysis of price sensitivity, lifecycle, customer purchase basket, adoption rates, and purchase criteria

2.2 Criticality of inputs and Factors of differentiation

Chart on Overview on criticality of inputs and factors of differentiation

2.3 Factors of disruption

Chart on Overview on factors of disruption

2.4 Impact of drivers and challenges

Chart on Impact of drivers and challenges in 2025 and 2030

3. Market Landscape

3.1 Market ecosystem

Chart on Parent Market
Data Table on - Parent Market

3.2 Market characteristics

Chart on Market characteristics analysis

3.3 Value chain analysis

Chart on Value chain analysis

4. Market Sizing

4.1 Market definition

Data Table on Offerings of companies included in the market definition

4.2 Market segment analysis

Market segments

4.3 Market size 2025

4.4 Market outlook: Forecast for 2025-2030

Chart on Global - Market size and forecast 2025-2030 ($ million)
Data Table on Global - Market size and forecast 2025-2030 ($ million)
Chart on Global Market: Year-over-year growth 2025-2030 (%)
Data Table on Global Market: Year-over-year growth 2025-2030 (%)

5. Historic Market Size

5.1 Global Automated Liquid Handling Systems Market 2020 - 2024

Historic Market Size - Data Table on Global Automated Liquid Handling Systems Market 2020 - 2024 ($ million)

5.2 End-user segment analysis 2020 - 2024

Historic Market Size - End-user Segment 2020 - 2024 ($ million)

5.3 Type segment analysis 2020 - 2024

Historic Market Size - Type Segment 2020 - 2024 ($ million)

5.4 Product Type segment analysis 2020 - 2024

Historic Market Size - Product Type Segment 2020 - 2024 ($ million)

5.5 Geography segment analysis 2020 - 2024

Historic Market Size - Geography Segment 2020 - 2024 ($ million)

5.6 Country segment analysis 2020 - 2024

Historic Market Size - Country Segment 2020 - 2024 ($ million)

6. Qualitative Analysis

6.1 Impact of AI on Global Automated Liquid Handling Systems Market

6.2 Impact of Geopolitical Conflicts on Global Automated Liquid Handling Systems Market

7. Five Forces Analysis

7.1 Five forces summary

Five forces analysis - Comparison between 2025 and 2030

7.2 Bargaining power of buyers

Bargaining power of buyers - Impact of key factors 2025 and 2030

7.3 Bargaining power of suppliers

Bargaining power of suppliers - Impact of key factors in 2025 and 2030

7.4 Threat of new entrants

Threat of new entrants - Impact of key factors in 2025 and 2030

7.5 Threat of substitutes

Threat of substitutes - Impact of key factors in 2025 and 2030

7.6 Threat of rivalry

Threat of rivalry - Impact of key factors in 2025 and 2030

7.7 Market condition

Chart on Market condition - Five forces 2025 and 2030

8. Market Segmentation by End-user

8.1 Market segments

Chart on End-user - Market share 2025-2030 (%)
Data Table on End-user - Market share 2025-2030 (%)

8.2 Comparison by End-user

Chart on Comparison by End-user
Data Table on Comparison by End-user

8.3 Pharmaceutical and biotechnology industry - Market size and forecast 2025-2030

Chart on Pharmaceutical and biotechnology industry - Market size and forecast 2025-2030 ($ million)
Data Table on Pharmaceutical and biotechnology industry - Market size and forecast 2025-2030 ($ million)
Chart on Pharmaceutical and biotechnology industry - Year-over-year growth 2025-2030 (%)
Data Table on Pharmaceutical and biotechnology industry - Year-over-year growth 2025-2030 (%)

8.4 Clinical and reference laboratories - Market size and forecast 2025-2030

Chart on Clinical and reference laboratories - Market size and forecast 2025-2030 ($ million)
Data Table on Clinical and reference laboratories - Market size and forecast 2025-2030 ($ million)
Chart on Clinical and reference laboratories - Year-over-year growth 2025-2030 (%)
Data Table on Clinical and reference laboratories - Year-over-year growth 2025-2030 (%)

8.5 Others - Market size and forecast 2025-2030

Chart on Others - Market size and forecast 2025-2030 ($ million)
Data Table on Others - Market size and forecast 2025-2030 ($ million)
Chart on Others - Year-over-year growth 2025-2030 (%)
Data Table on Others - Year-over-year growth 2025-2030 (%)

8.6 Market opportunity by End-user

Market opportunity by End-user ($ million)
Data Table on Market opportunity by End-user ($ million)

9. Market Segmentation by Type

9.1 Market segments

Chart on Type - Market share 2025-2030 (%)
Data Table on Type - Market share 2025-2030 (%)

9.2 Comparison by Type

Chart on Comparison by Type
Data Table on Comparison by Type

9.3 Automated liquid handling workstations - Market size and forecast 2025-2030

Chart on Automated liquid handling workstations - Market size and forecast 2025-2030 ($ million)
Data Table on Automated liquid handling workstations - Market size and forecast 2025-2030 ($ million)
Chart on Automated liquid handling workstations - Year-over-year growth 2025-2030 (%)
Data Table on Automated liquid handling workstations - Year-over-year growth 2025-2030 (%)

9.4 Automated pipetting systems - Market size and forecast 2025-2030

Chart on Automated pipetting systems - Market size and forecast 2025-2030 ($ million)
Data Table on Automated pipetting systems - Market size and forecast 2025-2030 ($ million)
Chart on Automated pipetting systems - Year-over-year growth 2025-2030 (%)
Data Table on Automated pipetting systems - Year-over-year growth 2025-2030 (%)

9.5 Automated microplate washers - Market size and forecast 2025-2030

Chart on Automated microplate washers - Market size and forecast 2025-2030 ($ million)
Data Table on Automated microplate washers - Market size and forecast 2025-2030 ($ million)
Chart on Automated microplate washers - Year-over-year growth 2025-2030 (%)
Data Table on Automated microplate washers - Year-over-year growth 2025-2030 (%)

9.6 Others - Market size and forecast 2025-2030

Chart on Others - Market size and forecast 2025-2030 ($ million)
Data Table on Others - Market size and forecast 2025-2030 ($ million)
Chart on Others - Year-over-year growth 2025-2030 (%)
Data Table on Others - Year-over-year growth 2025-2030 (%)

9.7 Market opportunity by Type

Market opportunity by Type ($ million)
Data Table on Market opportunity by Type ($ million)

10. Market Segmentation by Product Type

10.1 Market segments

Chart on Product Type - Market share 2025-2030 (%)
Data Table on Product Type - Market share 2025-2030 (%)

10.2 Comparison by Product Type

Chart on Comparison by Product Type
Data Table on Comparison by Product Type

10.3 Standalone system - Market size and forecast 2025-2030

Chart on Standalone system - Market size and forecast 2025-2030 ($ million)
Data Table on Standalone system - Market size and forecast 2025-2030 ($ million)
Chart on Standalone system - Year-over-year growth 2025-2030 (%)
Data Table on Standalone system - Year-over-year growth 2025-2030 (%)

10.4 Integrated system - Market size and forecast 2025-2030

Chart on Integrated system - Market size and forecast 2025-2030 ($ million)
Data Table on Integrated system - Market size and forecast 2025-2030 ($ million)
Chart on Integrated system - Year-over-year growth 2025-2030 (%)
Data Table on Integrated system - Year-over-year growth 2025-2030 (%)

10.5 Modular system - Market size and forecast 2025-2030

Chart on Modular system - Market size and forecast 2025-2030 ($ million)
Data Table on Modular system - Market size and forecast 2025-2030 ($ million)
Chart on Modular system - Year-over-year growth 2025-2030 (%)
Data Table on Modular system - Year-over-year growth 2025-2030 (%)

10.6 Market opportunity by Product Type

Market opportunity by Product Type ($ million)
Data Table on Market opportunity by Product Type ($ million)

11. Customer Landscape

11.1 Customer landscape overview

Analysis of price sensitivity, lifecycle, customer purchase basket, adoption rates, and purchase criteria

12. Geographic Landscape

12.1 Geographic segmentation

Chart on Market share by geography 2025-2030 (%)
Data Table on Market share by geography 2025-2030 (%)

12.2 Geographic comparison

Chart on Geographic comparison
Data Table on Geographic comparison

12.3 North America - Market size and forecast 2025-2030

Chart on North America - Market size and forecast 2025-2030 ($ million)
Data Table on North America - Market size and forecast 2025-2030 ($ million)
Chart on North America - Year-over-year growth 2025-2030 (%)
Data Table on North America - Year-over-year growth 2025-2030 (%)
Chart on Regional Comparison - North America
Data Table on Regional Comparison - North America

12.3.1 US - Market size and forecast 2025-2030

Chart on US - Market size and forecast 2025-2030 ($ million)
Data Table on US - Market size and forecast 2025-2030 ($ million)
Chart on US - Year-over-year growth 2025-2030 (%)
Data Table on US - Year-over-year growth 2025-2030 (%)

12.3.2 Canada - Market size and forecast 2025-2030

Chart on Canada - Market size and forecast 2025-2030 ($ million)
Data Table on Canada - Market size and forecast 2025-2030 ($ million)
Chart on Canada - Year-over-year growth 2025-2030 (%)
Data Table on Canada - Year-over-year growth 2025-2030 (%)

12.3.3 Mexico - Market size and forecast 2025-2030

Chart on Mexico - Market size and forecast 2025-2030 ($ million)
Data Table on Mexico - Market size and forecast 2025-2030 ($ million)
Chart on Mexico - Year-over-year growth 2025-2030 (%)
Data Table on Mexico - Year-over-year growth 2025-2030 (%)

12.4 Europe - Market size and forecast 2025-2030

Chart on Europe - Market size and forecast 2025-2030 ($ million)
Data Table on Europe - Market size and forecast 2025-2030 ($ million)
Chart on Europe - Year-over-year growth 2025-2030 (%)
Data Table on Europe - Year-over-year growth 2025-2030 (%)
Chart on Regional Comparison - Europe
Data Table on Regional Comparison - Europe

12.4.1 Germany - Market size and forecast 2025-2030

Chart on Germany - Market size and forecast 2025-2030 ($ million)
Data Table on Germany - Market size and forecast 2025-2030 ($ million)
Chart on Germany - Year-over-year growth 2025-2030 (%)
Data Table on Germany - Year-over-year growth 2025-2030 (%)

12.4.2 UK - Market size and forecast 2025-2030

Chart on UK - Market size and forecast 2025-2030 ($ million)
Data Table on UK - Market size and forecast 2025-2030 ($ million)
Chart on UK - Year-over-year growth 2025-2030 (%)
Data Table on UK - Year-over-year growth 2025-2030 (%)

12.4.3 France - Market size and forecast 2025-2030

Chart on France - Market size and forecast 2025-2030 ($ million)
Data Table on France - Market size and forecast 2025-2030 ($ million)
Chart on France - Year-over-year growth 2025-2030 (%)
Data Table on France - Year-over-year growth 2025-2030 (%)

12.4.4 Italy - Market size and forecast 2025-2030

Chart on Italy - Market size and forecast 2025-2030 ($ million)
Data Table on Italy - Market size and forecast 2025-2030 ($ million)
Chart on Italy - Year-over-year growth 2025-2030 (%)
Data Table on Italy - Year-over-year growth 2025-2030 (%)

12.4.5 Spain - Market size and forecast 2025-2030

Chart on Spain - Market size and forecast 2025-2030 ($ million)
Data Table on Spain - Market size and forecast 2025-2030 ($ million)
Chart on Spain - Year-over-year growth 2025-2030 (%)
Data Table on Spain - Year-over-year growth 2025-2030 (%)

12.4.6 The Netherlands - Market size and forecast 2025-2030

Chart on The Netherlands - Market size and forecast 2025-2030 ($ million)
Data Table on The Netherlands - Market size and forecast 2025-2030 ($ million)
Chart on The Netherlands - Year-over-year growth 2025-2030 (%)
Data Table on The Netherlands - Year-over-year growth 2025-2030 (%)

12.5 Asia - Market size and forecast 2025-2030

Chart on Asia - Market size and forecast 2025-2030 ($ million)
Data Table on Asia - Market size and forecast 2025-2030 ($ million)
Chart on Asia - Year-over-year growth 2025-2030 (%)
Data Table on Asia - Year-over-year growth 2025-2030 (%)
Chart on Regional Comparison - Asia
Data Table on Regional Comparison - Asia

12.5.1 China - Market size and forecast 2025-2030

Chart on China - Market size and forecast 2025-2030 ($ million)
Data Table on China - Market size and forecast 2025-2030 ($ million)
Chart on China - Year-over-year growth 2025-2030 (%)
Data Table on China - Year-over-year growth 2025-2030 (%)

12.5.2 Japan - Market size and forecast 2025-2030

Chart on Japan - Market size and forecast 2025-2030 ($ million)
Data Table on Japan - Market size and forecast 2025-2030 ($ million)
Chart on Japan - Year-over-year growth 2025-2030 (%)
Data Table on Japan - Year-over-year growth 2025-2030 (%)

12.5.3 India - Market size and forecast 2025-2030

Chart on India - Market size and forecast 2025-2030 ($ million)
Data Table on India - Market size and forecast 2025-2030 ($ million)
Chart on India - Year-over-year growth 2025-2030 (%)
Data Table on India - Year-over-year growth 2025-2030 (%)

12.5.4 South Korea - Market size and forecast 2025-2030

Chart on South Korea - Market size and forecast 2025-2030 ($ million)
Data Table on South Korea - Market size and forecast 2025-2030 ($ million)
Chart on South Korea - Year-over-year growth 2025-2030 (%)
Data Table on South Korea - Year-over-year growth 2025-2030 (%)

12.5.5 Indonesia - Market size and forecast 2025-2030

Chart on Indonesia - Market size and forecast 2025-2030 ($ million)
Data Table on Indonesia - Market size and forecast 2025-2030 ($ million)
Chart on Indonesia - Year-over-year growth 2025-2030 (%)
Data Table on Indonesia - Year-over-year growth 2025-2030 (%)

12.5.6 Thailand - Market size and forecast 2025-2030

Chart on Thailand - Market size and forecast 2025-2030 ($ million)
Data Table on Thailand - Market size and forecast 2025-2030 ($ million)
Chart on Thailand - Year-over-year growth 2025-2030 (%)
Data Table on Thailand - Year-over-year growth 2025-2030 (%)

12.6 Rest of World (ROW) - Market size and forecast 2025-2030

Chart on Rest of World (ROW) - Market size and forecast 2025-2030 ($ million)
Data Table on Rest of World (ROW) - Market size and forecast 2025-2030 ($ million)
Chart on Rest of World (ROW) - Year-over-year growth 2025-2030 (%)
Data Table on Rest of World (ROW) - Year-over-year growth 2025-2030 (%)
Chart on Regional Comparison - Rest of World (ROW)
Data Table on Regional Comparison - Rest of World (ROW)

12.6.1 Brazil - Market size and forecast 2025-2030

Chart on Brazil - Market size and forecast 2025-2030 ($ million)
Data Table on Brazil - Market size and forecast 2025-2030 ($ million)
Chart on Brazil - Year-over-year growth 2025-2030 (%)
Data Table on Brazil - Year-over-year growth 2025-2030 (%)

12.6.2 Saudi Arabia - Market size and forecast 2025-2030

Chart on Saudi Arabia - Market size and forecast 2025-2030 ($ million)
Data Table on Saudi Arabia - Market size and forecast 2025-2030 ($ million)
Chart on Saudi Arabia - Year-over-year growth 2025-2030 (%)
Data Table on Saudi Arabia - Year-over-year growth 2025-2030 (%)

12.6.3 UAE - Market size and forecast 2025-2030

Chart on UAE - Market size and forecast 2025-2030 ($ million)
Data Table on UAE - Market size and forecast 2025-2030 ($ million)
Chart on UAE - Year-over-year growth 2025-2030 (%)
Data Table on UAE - Year-over-year growth 2025-2030 (%)

12.6.4 Turkey - Market size and forecast 2025-2030

Chart on Turkey - Market size and forecast 2025-2030 ($ million)
Data Table on Turkey - Market size and forecast 2025-2030 ($ million)
Chart on Turkey - Year-over-year growth 2025-2030 (%)
Data Table on Turkey - Year-over-year growth 2025-2030 (%)

12.6.5 South Africa - Market size and forecast 2025-2030

Chart on South Africa - Market size and forecast 2025-2030 ($ million)
Data Table on South Africa - Market size and forecast 2025-2030 ($ million)
Chart on South Africa - Year-over-year growth 2025-2030 (%)
Data Table on South Africa - Year-over-year growth 2025-2030 (%)

12.6.6 Argentina - Market size and forecast 2025-2030

Chart on Argentina - Market size and forecast 2025-2030 ($ million)
Data Table on Argentina - Market size and forecast 2025-2030 ($ million)
Chart on Argentina - Year-over-year growth 2025-2030 (%)
Data Table on Argentina - Year-over-year growth 2025-2030 (%)

12.6.7 Colombia - Market size and forecast 2025-2030

Chart on Colombia - Market size and forecast 2025-2030 ($ million)
Data Table on Colombia - Market size and forecast 2025-2030 ($ million)
Chart on Colombia - Year-over-year growth 2025-2030 (%)
Data Table on Colombia - Year-over-year growth 2025-2030 (%)

12.6.8 Israel - Market size and forecast 2025-2030

Chart on Israel - Market size and forecast 2025-2030 ($ million)
Data Table on Israel - Market size and forecast 2025-2030 ($ million)
Chart on Israel - Year-over-year growth 2025-2030 (%)
Data Table on Israel - Year-over-year growth 2025-2030 (%)

12.7 Market opportunity by geography

Market opportunity by geography ($ million)
Data Tables on Market opportunity by geography ($ million)

13. Drivers, Challenges, and Opportunity

13.1 Market drivers

Increasing demand for high throughput and efficiency in life sciences
Critical need for improved data reproducibility and reduction of human error
Trend toward miniaturization and drive for cost containment

13.2 Market challenges

High capital investment and operational complexity
Challenges in standardization and system interoperability
Workforce adaptation and scarcity of skilled professionals

13.3 Impact of drivers and challenges

Impact of drivers and challenges in 2025 and 2030

13.4 Market opportunities

Integration of AI and smart analytics
Emergence of application-specific, turnkey solutions
Focus on system miniaturization and enhanced user experience

14. Competitive Landscape

14.1 Overview

14.2

Overview on criticality of inputs and factors of differentiation

14.3 Landscape disruption

Overview on factors of disruption

14.4 Industry risks

Impact of key risks on business

15. Competitive Analysis

15.1 Companies profiled

Companies covered

15.2 Company ranking index

15.3 Market positioning of companies

Matrix on companies position and classification

15.4 Agilent Technologies Inc.

Agilent Technologies Inc. - Overview
Agilent Technologies Inc. - Business segments
Agilent Technologies Inc. - Key news
Agilent Technologies Inc. - Key offerings
Agilent Technologies Inc. - Segment focus
SWOT

15.5 Analytik Jena GmbH Co KG

Analytik Jena GmbH Co KG - Overview
Analytik Jena GmbH Co KG - Product / Service
Analytik Jena GmbH Co KG - Key offerings
SWOT

15.6 Aurora Biomed Inc.

Aurora Biomed Inc. - Overview
Aurora Biomed Inc. - Product / Service
Aurora Biomed Inc. - Key offerings
SWOT

15.7 Beckman Coulter Inc.

Beckman Coulter Inc. - Overview
Beckman Coulter Inc. - Product / Service
Beckman Coulter Inc. - Key offerings
SWOT

15.8 BRAND GmbH and Co. KG

BRAND GmbH and Co. KG - Overview
BRAND GmbH and Co. KG - Product / Service
BRAND GmbH and Co. KG - Key offerings
SWOT

15.9 Dynamic Devices

Dynamic Devices - Overview
Dynamic Devices - Product / Service
Dynamic Devices - Key offerings
SWOT

15.10 Eppendorf SE

Eppendorf SE - Overview
Eppendorf SE - Product / Service
Eppendorf SE - Key offerings
SWOT

15.11 FORMULATRIX Inc.

FORMULATRIX Inc. - Overview
FORMULATRIX Inc. - Product / Service
FORMULATRIX Inc. - Key offerings
SWOT

15.12 Gilson Inc.

Gilson Inc. - Overview
Gilson Inc. - Product / Service
Gilson Inc. - Key offerings
SWOT

15.13 Hamilton Co.

Hamilton Co. - Overview
Hamilton Co. - Product / Service
Hamilton Co. - Key offerings
SWOT

15.14 Hudson Robotics Inc.

Hudson Robotics Inc. - Overview
Hudson Robotics Inc. - Product / Service
Hudson Robotics Inc. - Key offerings
SWOT

15.15 INTEGRA Biosciences AG

INTEGRA Biosciences AG - Overview
INTEGRA Biosciences AG - Product / Service
INTEGRA Biosciences AG - Key offerings
SWOT

15.16 Mettler Toledo Inc.

Mettler Toledo Inc. - Overview
Mettler Toledo Inc. - Business segments
Mettler Toledo Inc. - Key offerings
Mettler Toledo Inc. - Segment focus
SWOT

15.17 Revvity Inc.

Revvity Inc. - Overview
Revvity Inc. - Business segments
Revvity Inc. - Key offerings
Revvity Inc. - Segment focus
SWOT

15.18 Sartorius AG

Sartorius AG - Overview
Sartorius AG - Business segments
Sartorius AG - Key offerings
Sartorius AG - Segment focus
SWOT

16. Appendix

16.1 Scope of the report

Market definition
Objectives
Notes and caveats

16.2 Inclusions and exclusions checklist

Inclusions checklist
Exclusions checklist

16.3 Currency conversion rates for US$

16.4 Research methodology

16.5 Data procurement

Information sources

16.6 Data validation

16.7 Validation techniques employed for market sizing

16.8 Data synthesis

16.9 360 degree market analysis

16.10 List of abbreviations

Research Methodology

Technavio presents a detailed picture of the market by way of study, synthesis, and summation of data from multiple sources. The analysts have presented the various facets of the market with a particular focus on identifying the key industry influencers. The data thus presented is comprehensive, reliable, and the result of extensive research, both primary and secondary.

INFORMATION SOURCES

Primary sources

  • Manufacturers and suppliers
  • Channel partners
  • Industry experts
  • Strategic decision makers

Secondary sources

  • Industry journals and periodicals
  • Government data
  • Financial reports of key industry players
  • Historical data
  • Press releases

DATA ANALYSIS

Data Synthesis

  • Collation of data
  • Estimation of key figures
  • Analysis of derived insights

Data Validation

  • Triangulation with data models
  • Reference against proprietary databases
  • Corroboration with industry experts

REPORT WRITING

Qualitative

  • Market drivers
  • Market challenges
  • Market trends
  • Five forces analysis

Quantitative

  • Market size and forecast
  • Market segmentation
  • Geographical insights
  • Competitive landscape

Interested in this report?

Get your sample now to see our research methodology and insights!

Download Now

Frequently Asked Questions

Automated Liquid Handling Systems market growth will increase by USD 947.1 million during 2026-2030.

The Automated Liquid Handling Systems market is expected to grow at a CAGR of 12.4% during 2026-2030.

Automated Liquid Handling Systems market is segmented by End-user (Pharmaceutical and biotechnology industry, Clinical and reference laboratories, Others) Type (Automated liquid handling workstations, Automated pipetting systems, Automated microplate washers, Others) Product type (Standalone system, Integrated system, Modular system)

Agilent Technologies Inc., Analytik Jena GmbH Co KG, Aurora Biomed Inc., Beckman Coulter Inc., BRAND GmbH and Co. KG, DISPENDIX GmbH, Dynamic Devices, Eppendorf SE, Flow Robotics AS, FORMULATRIX Inc., Gilson Inc., Hamilton Co., Hudson Robotics Inc., INTEGRA Biosciences AG, Mettler Toledo Inc., Opentrons Labworks Inc., Revvity Inc., Sartorius AG, SPT Labtech Ltd., Synchron Lab Automation are a few of the key vendors in the Automated Liquid Handling Systems market.

North America will register the highest growth rate of 38.9% among the other regions. Therefore, the Automated Liquid Handling Systems market in North America is expected to garner significant business opportunities for the vendors during the forecast period.

US, Canada, Mexico, Germany, UK, France, Italy, Spain, The Netherlands, China, Japan, India, South Korea, Indonesia, Thailand, Brazil, Saudi Arabia, UAE, Turkey, South Africa, Argentina, Colombia, Israel

  • Increasing demand for high throughput and efficiency in life sciences is the driving factor this market.

The Automated Liquid Handling Systems market vendors should focus on grabbing business opportunities from the End-user segment as it accounted for the largest market share in the base year.
RIA - Research AI Assistant
Ask RIA
