Anatomic Pathology Track And Trace Solutions Market Analysis, Size, and Forecast 2026-2030: North America (US, Canada, and Mexico), Europe (Germany, UK, and France), APAC (China, Japan, and India), South America (Brazil, Argentina, and Colombia), Middle East and Africa (South Africa, Saudi Arabia, and UAE), Asia, Rest of World (ROW)

Anatomic Pathology Track And Trace Solutions Market Analysis, Size, and Forecast 2026-2030:
North America (US, Canada, and Mexico), Europe (Germany, UK, and France), APAC (China, Japan, and India), South America (Brazil, Argentina, and Colombia), Middle East and Africa (South Africa, Saudi Arabia, and UAE), Asia, Rest of World (ROW)

Published: May 2026 306 Pages SKU: IRTNTR40179

Market Overview at a Glance

$2.76 B
Market Opportunity
27.5%
CAGR 2025 - 2030
37.3%
North America Growth
$472.2 Mn
Hospital laboratories segment 2024

Anatomic Pathology Track And Trace Solutions Market Size 2026-2030

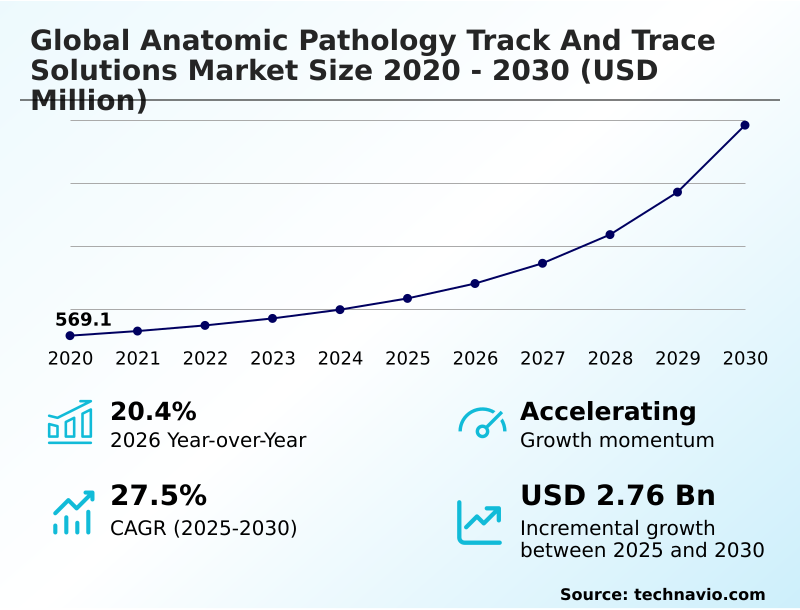
The anatomic pathology track and trace solutions market size is valued to increase by USD 2.76 billion, at a CAGR of 27.5% from 2025 to 2030. Escalating diagnostic volumes and need for enhanced laboratory efficiency will drive the anatomic pathology track and trace solutions market.

Major Market Trends & Insights

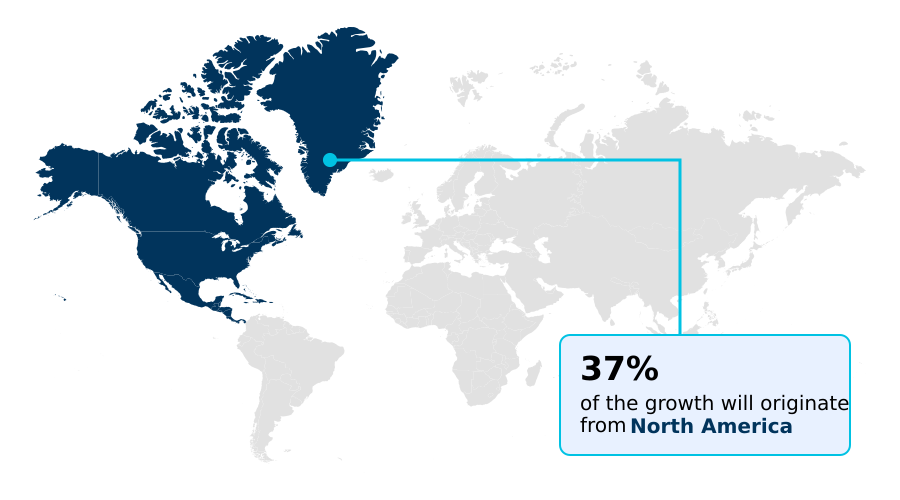
  • North America dominated the market and accounted for a 37.3% growth during the forecast period.
  • By End-user - Hospital laboratories segment was valued at USD 472.2 million in 2024
  • By Technology - Barcode segment accounted for the largest market revenue share in 2024

Market Size & Forecast

  • Market Opportunities: USD 3.35 billion
  • Market Future Opportunities: USD 2.76 billion
  • CAGR from 2025 to 2030 : 27.5%

Market Summary

  • The anatomic pathology track and trace solutions market is fundamentally shaped by the urgent need for diagnostic accuracy and operational efficiency. Escalating specimen volumes, driven by the rising prevalence of chronic diseases, have rendered manual tracking methods obsolete.
  • Modern laboratories are compelled to adopt solutions that provide a verifiable digital chain of custody, ensuring each specimen is accurately identified and monitored from collection to diagnosis. For example, a large reference laboratory processing thousands of biopsies daily can leverage an integrated system to automate specimen accessioning, reducing the risk of human error and improving diagnostic turnaround times.
  • The institutionalization of digital pathology further propels this market, as the integrity of a digital image is entirely dependent on the verifiable identity of the physical slide.
  • Challenges such as the high cost of implementation and the complexities of integrating with legacy systems persist, but the push for regulatory compliance and patient safety continues to drive investment in these critical technologies.

What will be the Size of the Anatomic Pathology Track And Trace Solutions Market during the forecast period?

Get Key Insights on Market Forecast (PDF) Request Free Sample

How is the Anatomic Pathology Track And Trace Solutions Market Segmented?

The anatomic pathology track and trace solutions industry research report provides comprehensive data (region-wise segment analysis), with forecasts and estimates in "USD million" for the period 2026-2030, as well as historical data from 2020-2024 for the following segments.
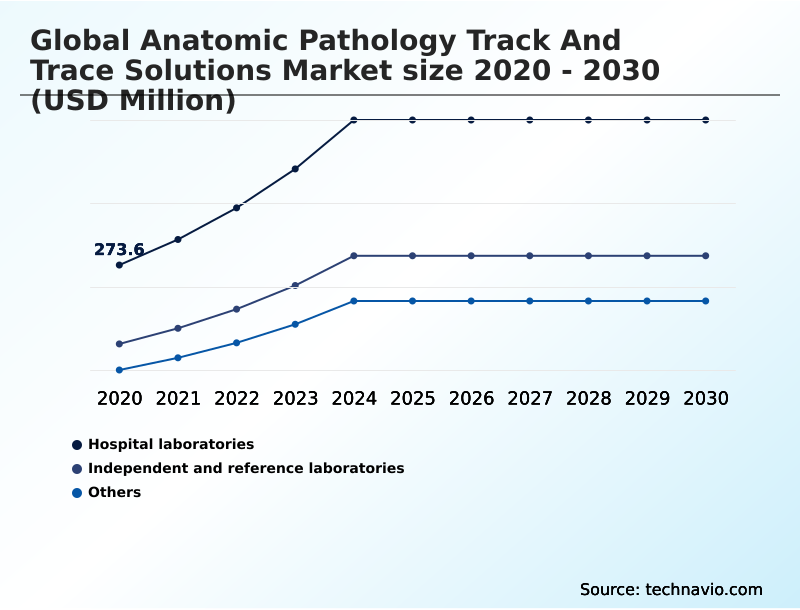
  • End-user
    • Hospital laboratories
    • Independent and reference laboratories
    • Others
  • Technology
    • Barcode
    • RFID
  • Product
    • Software
    • Hardware
    • Consumables
  • Application
    • Slides tracking
    • Tissue cassettes and blocks tracking
    • Specimen tracking
  • Geography
    • North America
      • US
      • Canada
      • Mexico
    • Europe
      • Germany
      • UK
      • France
    • Asia
    • Rest of World (ROW)

By End-user Insights

The hospital laboratories segment is estimated to witness significant growth during the forecast period.

Hospital laboratories are a foundational end-user segment, where the primary goal of implementing track and trace technology is to eliminate pre-analytical errors.

These settings require a robust digital chain of custody, and the integration of these systems helps administrators optimize labor and monitor diagnostic turnaround time with precision.

The use of automated verification, a key component of specimen traceability systems, at each analytical workstation minimizes the risk of human error, which has been shown to reduce specimen misidentification by over 95%.

This focus on error reduction technology and patient safety protocols is critical in high-volume settings. The anatomic pathology workflow benefits from lab workflow optimization and positive patient identification, ensuring diagnostic accuracy and maintaining patient safety within the broader hospital ecosystem.

Request Free Sample

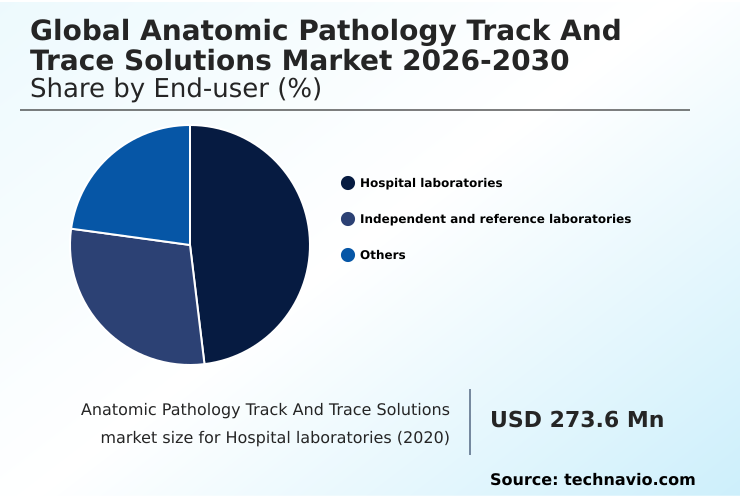
The Hospital laboratories segment was valued at USD 472.2 million in 2024 and showed a gradual increase during the forecast period.

Request Free Sample

Regional Analysis

North America is estimated to contribute 37.3% to the growth of the global market during the forecast period.Technavio’s analysts have elaborately explained the regional trends and drivers that shape the market during the forecast period.

See How Anatomic Pathology Track And Trace Solutions Market Demand is Rising in North America Request Free Sample

North America maintains a definitive leadership position, characterized by an advanced diagnostic infrastructure and early institutionalization of high-throughput digital workflows.

The regional focus on eliminating specimen misidentification has led to adoption rates of automated specimen tracking solutions that are 35% higher than in other developed regions.

European markets are also mature, with a strong emphasis on process standardization and interoperability standards to support large, consolidated laboratory networks. This has resulted in a 25% improvement in operational throughput in facilities that have fully integrated digital pathology integration.

Meanwhile, the Asia region is experiencing rapid growth, driven by massive government investments in healthcare modernization, creating significant opportunities for vendors providing end-to-end specimen tracking and real-time location systems.

Market Dynamics

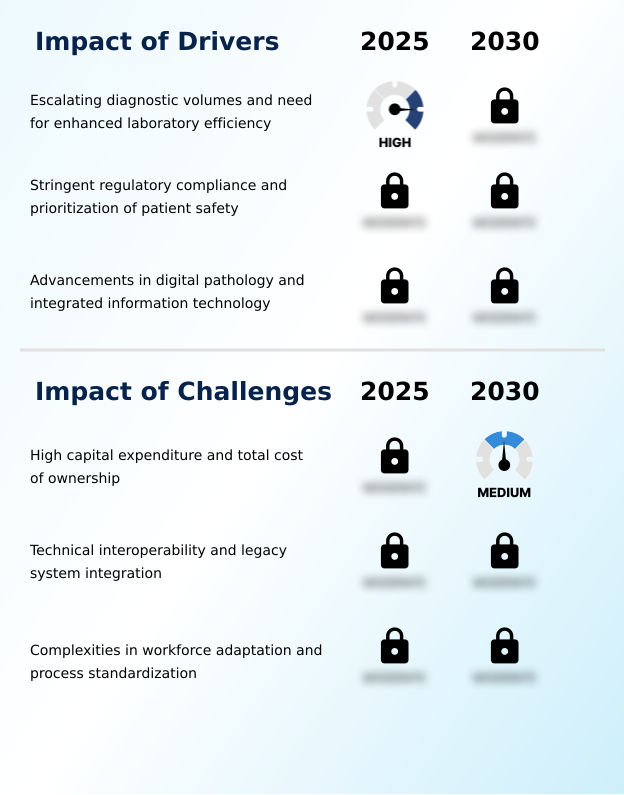
Our researchers analyzed the data with 2025 as the base year, along with the key drivers, trends, and challenges. A holistic analysis of drivers will help companies refine their marketing strategies to gain a competitive advantage.

  • The strategic implementation of modern tracking solutions is reshaping laboratory operations, with a focus on delivering a verifiable and secure chain of custody for biopsies. The debate over barcode vs RFID in pathology labs continues, but the impact of RFID on specimen archival is undeniable, offering superior speed for inventory management.
  • Stakeholders are conducting a thorough cost-benefit analysis of pathology automation to justify investments. Key to this is understanding the ROI of anatomic pathology tracking systems, which frequently demonstrate significant reductions in diagnostic errors. The adoption of anatomic pathology workflow optimization software is crucial for managing workloads, while software for tracking tissue blocks ensures sample integrity through processing.
  • Integrating LIS with automated tracking hardware remains a technical focal point, overcoming challenges of legacy system integration. The goal is to achieve end-to-end traceability in cancer diagnostics, enhancing patient safety in lab diagnostics. This involves automated labeling for histology slides, workflow management for digital pathology, and real-time specimen location monitoring systems.
  • The market is also driven by the need for compliance with CAP specimen handling standards, pushing laboratories toward hardware for positive patient identification. Ultimately, the move to cloud-based platforms for multi-site labs and the automation of quality control in histology are key trends improving turnaround time with tracking solutions.

What are the key market drivers leading to the rise in the adoption of Anatomic Pathology Track And Trace Solutions Industry?

  • The escalating volume of diagnostic tests, coupled with the critical need for enhanced laboratory efficiency, serves as a primary driver for market growth.

  • The primary market driver is the systemic increase in diagnostic volumes, compelling laboratories to adopt automated solutions to enhance operational throughput and laboratory efficiency.
  • Adopting an automated accessioning system can increase a lab's processing capacity by up to 50% without a proportional increase in staff.
  • A second powerful driver is the stringent regulatory landscape mandating a verifiable chain of custody verification to ensure patient safety and mitigate legal risks.
  • Track and trace solutions provide a definitive audit trail creation, satisfying compliance with agencies that have reported a 30% increase in scrutiny over specimen integrity.
  • Finally, the rapid institutionalization of digital pathology acts as a key enabler, requiring a clean, real-time data stream from automated tracking systems for effective data harmonization and workflow bottleneck identification.

What are the market trends shaping the Anatomic Pathology Track And Trace Solutions Industry?

  • The integration of artificial intelligence for predictive quality control is an emerging market trend, allowing for the proactive identification of potential errors in specimen preparation.

  • A dominant trend is the integration of artificial intelligence for predictive quality control, which moves beyond simple identification toward proactive error detection. Systems with vision-based AI can automatically verify tissue quality, with leading platforms reducing manual slide reworks by up to 60%. This shift toward intelligent, automated quality control is vital for achieving first-pass diagnostic confidence.
  • Concurrently, the transition toward RFID and contactless tracking is gaining momentum in high-value applications, offering bulk reading capabilities that accelerate inventory management by over 75% compared to line-of-sight barcode systems. Furthermore, the deployment of cloud-based orchestration platforms is enabling interconnected diagnostic ecosystems, centralizing specimen tracking data for multi-site laboratory networks and ensuring a seamless digital thread for telepathology enablement.

What challenges does the Anatomic Pathology Track And Trace Solutions Industry face during its growth?

  • Significant capital expenditure and the total cost of ownership present a key challenge, potentially impeding industry growth for smaller facilities.

  • The primary market challenge remains the high capital expenditure and total cost of ownership, which can be a significant barrier for smaller facilities. A comprehensive system can require an upfront investment that is 2-3 times that of traditional equipment. Another significant hurdle is achieving seamless technical interoperability and legacy system integration.
  • Many labs operate with disparate systems, and the absence of universal data security in healthcare and interoperability standards can lead to data silos, compromising the integrity of the digital thread for pathology. This lack of connectivity can increase implementation times by over 40%. Finally, complexities in workforce adaptation and process standardization present organizational challenges.
  • The transition to automated protocols requires rigorous training and overcoming resistance to change, which can temporarily disrupt laboratory throughput and strain personnel resources.

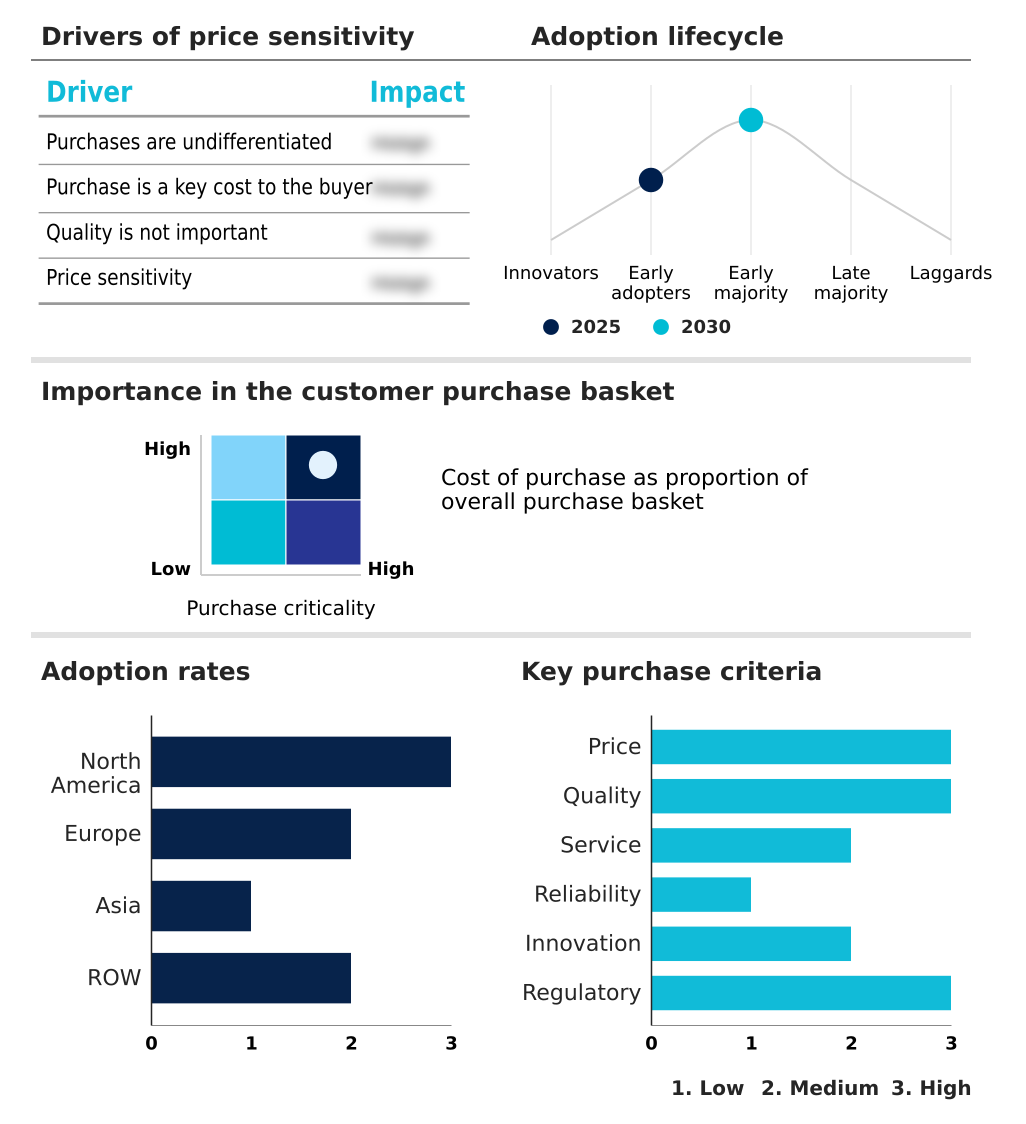
Exclusive Technavio Analysis on Customer Landscape

The anatomic pathology track and trace solutions market forecasting report includes the adoption lifecycle of the market, covering from the innovator’s stage to the laggard’s stage. It focuses on adoption rates in different regions based on penetration. Furthermore, the anatomic pathology track and trace solutions market report also includes key purchase criteria and drivers of price sensitivity to help companies evaluate and develop their market growth analysis strategies.

Customer Landscape of Anatomic Pathology Track And Trace Solutions Industry

Competitive Landscape

Companies are implementing various strategies, such as strategic alliances, anatomic pathology track and trace solutions market forecast, partnerships, mergers and acquisitions, geographical expansion, and product/service launches, to enhance their presence in the industry.

Agilent Technologies Inc. - Offers integrated solutions for anatomic pathology tracking, featuring automated workflow management and specimen identification to enhance diagnostic integrity and laboratory efficiency.

The industry research and growth report includes detailed analyses of the competitive landscape of the market and information about key companies, including:

  • Agilent Technologies Inc.
  • Cerebrum Corp.
  • Cirdan
  • Clinisys Inc.
  • CompuGroup Medical SE and Co.
  • Computype Inc.
  • Epredia
  • F. Hoffmann La Roche Ltd.
  • General Data Co. Inc.
  • Leica Biosystems Nussloch GmbH
  • LigoLab Information Systems
  • NovoPath Inc.
  • Powered Milestone Srl
  • Psyche Systems Corp.
  • Sakura Finetek USA Inc.
  • Siemens Healthineers AG
  • Soft Computer Consultants Inc.
  • StatLab Medical Products
  • XIFIN Inc.
  • Zebra Technologies Corp.

Qualitative and quantitative analysis of companies has been conducted to help clients understand the wider business environment as well as the strengths and weaknesses of key industry players. Data is qualitatively analyzed to categorize companies as pure play, category-focused, industry-focused, and diversified; it is quantitatively analyzed to categorize companies as dominant, leading, strong, tentative, and weak.

Recent Development and News in Anatomic pathology track and trace solutions market

  • In September 2024, Agilent Technologies Inc. announced a strategic agreement to acquire Biocare Medical, a move designed to expand its portfolio of clinical and research pathology solutions and unify the tracking of advanced therapeutics.
  • In November 2024, Sakura Finetek Europe and Hamamatsu Photonics K.K. announced a strategic global partnership to standardize the entire workflow from histology slide preparation to digital imaging, aiming to reduce specimen rework in European laboratories.
  • In January 2025, Agilent Technologies Inc. launched the S540MD Slide Scanner System in key European markets, enhancing high-throughput digital workflows through automated barcode-driven scanning and AI-assisted tissue detection.
  • In March 2025, Leica Biosystems, a Danaher company, introduced the Aperio GT Elite scanner and Aperio iQC software in the US, utilizing barcode-driven automation to accelerate slide processing and reduce manual quality control review times.

Dive into Technavio’s robust research methodology, blending expert interviews, extensive data synthesis, and validated models for unparalleled Anatomic Pathology Track And Trace Solutions Market insights. See full methodology.

Market Scope
Page number 306
Base year 2025
Historic period 2020-2024
Forecast period 2026-2030
Growth momentum & CAGR Accelerate at a CAGR of 27.5%
Market growth 2026-2030 USD 2756.2 million
Market structure Fragmented
YoY growth 2025-2026(%) 20.4%
Key countries US, Canada, Mexico, Germany, UK, France, Italy, Spain, The Netherlands, China, Japan, India, South Korea, Indonesia, Thailand, Brazil, Argentina, South Africa, Saudi Arabia, Colombia, UAE, Turkey and Israel
Competitive landscape Leading Companies, Market Positioning of Companies, Competitive Strategies, and Industry Risks

Request Free Sample

Research Analyst Overview

  • The market is defined by a critical transition toward fully automated, interconnected laboratory environments. The core objective is mitigating diagnostic risk through a verifiable digital chain of custody, achieved with advanced specimen identification systems. This push is driven by the need for regulatory compliance documentation and enhanced anatomic pathology workflow.
  • The adoption of barcode labeling systems and RFID specimen tracking is foundational, enabling pathology slide tracking and tissue cassette tracking. Laboratory information system integration with workflow orchestration software is central to achieving high-throughput digital workflows and lab workflow optimization. For executive decision-making, the pivot to digital pathology integration directly impacts budgeting for automated slide printing and other error reduction technology.
  • This shift has enabled some leading institutions to reduce diagnostic turnaround time by over 40%. Ultimately, implementing end-to-end specimen tracking and automated quality control through robust specimen traceability systems provides the positive patient identification necessary for modern, high-volume diagnostics and ensures effective specimen lifecycle management.

What are the Key Data Covered in this Anatomic Pathology Track And Trace Solutions Market Research and Growth Report?

  • What is the expected growth of the Anatomic Pathology Track And Trace Solutions Market between 2026 and 2030?

    • USD 2.76 billion, at a CAGR of 27.5%

  • What segmentation does the market report cover?

    • The report is segmented by End-user (Hospital laboratories, Independent and reference laboratories, and Others), Technology (Barcode, and RFID), Product (Software, Hardware, and Consumables), Application (Slides tracking, Tissue cassettes and blocks tracking, and Specimen tracking) and Geography (North America, Europe, Asia, Rest of World (ROW))

  • Which regions are analyzed in the report?

    • North America, Europe, Asia and Rest of World (ROW)

  • What are the key growth drivers and market challenges?

    • Escalating diagnostic volumes and need for enhanced laboratory efficiency, High capital expenditure and total cost of ownership

  • Who are the major players in the Anatomic Pathology Track And Trace Solutions Market?

    • Agilent Technologies Inc., Cerebrum Corp., Cirdan, Clinisys Inc., CompuGroup Medical SE and Co., Computype Inc., Epredia, F. Hoffmann La Roche Ltd., General Data Co. Inc., Leica Biosystems Nussloch GmbH, LigoLab Information Systems, NovoPath Inc., Powered Milestone Srl, Psyche Systems Corp., Sakura Finetek USA Inc., Siemens Healthineers AG, Soft Computer Consultants Inc., StatLab Medical Products, XIFIN Inc. and Zebra Technologies Corp.

Market Research Insights

  • The market's momentum is sustained by a push for greater laboratory efficiency and diagnostic accuracy. Adoption of automated systems has been shown to reduce specimen handling errors by up to 90%, while improving turnaround times by 40%.
  • The shift toward telepathology enablement is also significant, with interconnected systems allowing for remote pathology consultation, which can expand diagnostic access by over 60% in underserved regions. This interconnectedness, facilitated by cloud-based orchestration, ensures a verifiable audit trail creation, critical for both patient safety protocols and regulatory adherence.
  • The focus on process standardization and reducing the total cost of ownership drives companies to offer scalable asset traceability platforms, making advanced tracking accessible beyond large institutions.

We can help! Our analysts can customize this anatomic pathology track and trace solutions market research report to meet your requirements.

Get in touch

1. Executive Summary

1.1 Market overview

Executive Summary - Chart on Market Overview
Executive Summary - Data Table on Market Overview
Executive Summary - Chart on Global Market Characteristics
Executive Summary - Chart on Market by Geography
Executive Summary - Chart on Market Segmentation by End-user
Executive Summary - Chart on Market Segmentation by Technology
Executive Summary - Chart on Market Segmentation by Product
Executive Summary - Chart on Market Segmentation by Application
Executive Summary - Chart on Incremental Growth
Executive Summary - Data Table on Incremental Growth
Executive Summary - Chart on Company Market Positioning

2. Technavio Analysis

2.1 Analysis of price sensitivity, lifecycle, customer purchase basket, adoption rates, and purchase criteria

2.2 Criticality of inputs and Factors of differentiation

Chart on Overview on criticality of inputs and factors of differentiation

2.3 Factors of disruption

Chart on Overview on factors of disruption

2.4 Impact of drivers and challenges

Chart on Impact of drivers and challenges in 2025 and 2030

3. Market Landscape

3.1 Market ecosystem

Chart on Parent Market
Data Table on - Parent Market

3.2 Market characteristics

Chart on Market characteristics analysis

3.3 Value chain analysis

Chart on Value chain analysis

4. Market Sizing

4.1 Market definition

Data Table on Offerings of companies included in the market definition

4.2 Market segment analysis

Market segments

4.3 Market size 2025

4.4 Market outlook: Forecast for 2025-2030

Chart on Global - Market size and forecast 2025-2030 ($ million)
Data Table on Global - Market size and forecast 2025-2030 ($ million)
Chart on Global Market: Year-over-year growth 2025-2030 (%)
Data Table on Global Market: Year-over-year growth 2025-2030 (%)

5. Historic Market Size

5.1 Global Anatomic Pathology Track And Trace Solutions Market 2020 - 2024

Historic Market Size - Data Table on Global Anatomic Pathology Track And Trace Solutions Market 2020 - 2024 ($ million)

5.2 End-user segment analysis 2020 - 2024

Historic Market Size - End-user Segment 2020 - 2024 ($ million)

5.3 Technology segment analysis 2020 - 2024

Historic Market Size - Technology Segment 2020 - 2024 ($ million)

5.4 Product segment analysis 2020 - 2024

Historic Market Size - Product Segment 2020 - 2024 ($ million)

5.5 Application segment analysis 2020 - 2024

Historic Market Size - Application Segment 2020 - 2024 ($ million)

5.6 Geography segment analysis 2020 - 2024

Historic Market Size - Geography Segment 2020 - 2024 ($ million)

5.7 Country segment analysis 2020 - 2024

Historic Market Size - Country Segment 2020 - 2024 ($ million)

6. Qualitative Analysis

6.1 Impact of AI on global anatomic pathology track and trace solutions market

6.2 Impact of geopolitical conflicts on global anatomic pathology track and trace solutions market

7. Five Forces Analysis

7.1 Five forces summary

Five forces analysis - Comparison between 2025 and 2030

7.2 Bargaining power of buyers

Bargaining power of buyers - Impact of key factors 2025 and 2030

7.3 Bargaining power of suppliers

Bargaining power of suppliers - Impact of key factors in 2025 and 2030

7.4 Threat of new entrants

Threat of new entrants - Impact of key factors in 2025 and 2030

7.5 Threat of substitutes

Threat of substitutes - Impact of key factors in 2025 and 2030

7.6 Threat of rivalry

Threat of rivalry - Impact of key factors in 2025 and 2030

7.7 Market condition

Chart on Market condition - Five forces 2025 and 2030

8. Market Segmentation by End-user

8.1 Market segments

Chart on End-user - Market share 2025-2030 (%)
Data Table on End-user - Market share 2025-2030 (%)

8.2 Comparison by End-user

Chart on Comparison by End-user
Data Table on Comparison by End-user

8.3 Hospital laboratories - Market size and forecast 2025-2030

Chart on Hospital laboratories - Market size and forecast 2025-2030 ($ million)
Data Table on Hospital laboratories - Market size and forecast 2025-2030 ($ million)
Chart on Hospital laboratories - Year-over-year growth 2025-2030 (%)
Data Table on Hospital laboratories - Year-over-year growth 2025-2030 (%)

8.4 Independent and reference laboratories - Market size and forecast 2025-2030

Chart on Independent and reference laboratories - Market size and forecast 2025-2030 ($ million)
Data Table on Independent and reference laboratories - Market size and forecast 2025-2030 ($ million)
Chart on Independent and reference laboratories - Year-over-year growth 2025-2030 (%)
Data Table on Independent and reference laboratories - Year-over-year growth 2025-2030 (%)

8.5 Others - Market size and forecast 2025-2030

Chart on Others - Market size and forecast 2025-2030 ($ million)
Data Table on Others - Market size and forecast 2025-2030 ($ million)
Chart on Others - Year-over-year growth 2025-2030 (%)
Data Table on Others - Year-over-year growth 2025-2030 (%)

8.6 Market opportunity by End-user

Market opportunity by End-user ($ million)
Data Table on Market opportunity by End-user ($ million)

9. Market Segmentation by Technology

9.1 Market segments

Chart on Technology - Market share 2025-2030 (%)
Data Table on Technology - Market share 2025-2030 (%)

9.2 Comparison by Technology

Chart on Comparison by Technology
Data Table on Comparison by Technology

9.3 Barcode - Market size and forecast 2025-2030

Chart on Barcode - Market size and forecast 2025-2030 ($ million)
Data Table on Barcode - Market size and forecast 2025-2030 ($ million)
Chart on Barcode - Year-over-year growth 2025-2030 (%)
Data Table on Barcode - Year-over-year growth 2025-2030 (%)

9.4 RFID - Market size and forecast 2025-2030

Chart on RFID - Market size and forecast 2025-2030 ($ million)
Data Table on RFID - Market size and forecast 2025-2030 ($ million)
Chart on RFID - Year-over-year growth 2025-2030 (%)
Data Table on RFID - Year-over-year growth 2025-2030 (%)

9.5 Market opportunity by Technology

Market opportunity by Technology ($ million)
Data Table on Market opportunity by Technology ($ million)

10. Market Segmentation by Product

10.1 Market segments

Chart on Product - Market share 2025-2030 (%)
Data Table on Product - Market share 2025-2030 (%)

10.2 Comparison by Product

Chart on Comparison by Product
Data Table on Comparison by Product

10.3 Software - Market size and forecast 2025-2030

Chart on Software - Market size and forecast 2025-2030 ($ million)
Data Table on Software - Market size and forecast 2025-2030 ($ million)
Chart on Software - Year-over-year growth 2025-2030 (%)
Data Table on Software - Year-over-year growth 2025-2030 (%)

10.4 Hardware - Market size and forecast 2025-2030

Chart on Hardware - Market size and forecast 2025-2030 ($ million)
Data Table on Hardware - Market size and forecast 2025-2030 ($ million)
Chart on Hardware - Year-over-year growth 2025-2030 (%)
Data Table on Hardware - Year-over-year growth 2025-2030 (%)

10.5 Consumables - Market size and forecast 2025-2030

Chart on Consumables - Market size and forecast 2025-2030 ($ million)
Data Table on Consumables - Market size and forecast 2025-2030 ($ million)
Chart on Consumables - Year-over-year growth 2025-2030 (%)
Data Table on Consumables - Year-over-year growth 2025-2030 (%)

10.6 Market opportunity by Product

Market opportunity by Product ($ million)
Data Table on Market opportunity by Product ($ million)

11. Market Segmentation by Application

11.1 Market segments

Chart on Application - Market share 2025-2030 (%)
Data Table on Application - Market share 2025-2030 (%)

11.2 Comparison by Application

Chart on Comparison by Application
Data Table on Comparison by Application

11.3 Slides tracking - Market size and forecast 2025-2030

Chart on Slides tracking - Market size and forecast 2025-2030 ($ million)
Data Table on Slides tracking - Market size and forecast 2025-2030 ($ million)
Chart on Slides tracking - Year-over-year growth 2025-2030 (%)
Data Table on Slides tracking - Year-over-year growth 2025-2030 (%)

11.4 Tissue cassettes and blocks tracking - Market size and forecast 2025-2030

Chart on Tissue cassettes and blocks tracking - Market size and forecast 2025-2030 ($ million)
Data Table on Tissue cassettes and blocks tracking - Market size and forecast 2025-2030 ($ million)
Chart on Tissue cassettes and blocks tracking - Year-over-year growth 2025-2030 (%)
Data Table on Tissue cassettes and blocks tracking - Year-over-year growth 2025-2030 (%)

11.5 Specimen tracking - Market size and forecast 2025-2030

Chart on Specimen tracking - Market size and forecast 2025-2030 ($ million)
Data Table on Specimen tracking - Market size and forecast 2025-2030 ($ million)
Chart on Specimen tracking - Year-over-year growth 2025-2030 (%)
Data Table on Specimen tracking - Year-over-year growth 2025-2030 (%)

11.6 Market opportunity by Application

Market opportunity by Application ($ million)
Data Table on Market opportunity by Application ($ million)

12. Customer Landscape

12.1 Customer landscape overview

Analysis of price sensitivity, lifecycle, customer purchase basket, adoption rates, and purchase criteria

13. Geographic Landscape

13.1 Geographic segmentation

Chart on Market share by geography 2025-2030 (%)
Data Table on Market share by geography 2025-2030 (%)

13.2 Geographic comparison

Chart on Geographic comparison
Data Table on Geographic comparison

13.3 North America - Market size and forecast 2025-2030

Chart on North America - Market size and forecast 2025-2030 ($ million)
Data Table on North America - Market size and forecast 2025-2030 ($ million)
Chart on North America - Year-over-year growth 2025-2030 (%)
Data Table on North America - Year-over-year growth 2025-2030 (%)
Chart on Regional Comparison - North America
Data Table on Regional Comparison - North America

13.3.1 US - Market size and forecast 2025-2030

Chart on US - Market size and forecast 2025-2030 ($ million)
Data Table on US - Market size and forecast 2025-2030 ($ million)
Chart on US - Year-over-year growth 2025-2030 (%)
Data Table on US - Year-over-year growth 2025-2030 (%)

13.3.2 Canada - Market size and forecast 2025-2030

Chart on Canada - Market size and forecast 2025-2030 ($ million)
Data Table on Canada - Market size and forecast 2025-2030 ($ million)
Chart on Canada - Year-over-year growth 2025-2030 (%)
Data Table on Canada - Year-over-year growth 2025-2030 (%)

13.3.3 Mexico - Market size and forecast 2025-2030

Chart on Mexico - Market size and forecast 2025-2030 ($ million)
Data Table on Mexico - Market size and forecast 2025-2030 ($ million)
Chart on Mexico - Year-over-year growth 2025-2030 (%)
Data Table on Mexico - Year-over-year growth 2025-2030 (%)

13.4 Europe - Market size and forecast 2025-2030

Chart on Europe - Market size and forecast 2025-2030 ($ million)
Data Table on Europe - Market size and forecast 2025-2030 ($ million)
Chart on Europe - Year-over-year growth 2025-2030 (%)
Data Table on Europe - Year-over-year growth 2025-2030 (%)
Chart on Regional Comparison - Europe
Data Table on Regional Comparison - Europe

13.4.1 Germany - Market size and forecast 2025-2030

Chart on Germany - Market size and forecast 2025-2030 ($ million)
Data Table on Germany - Market size and forecast 2025-2030 ($ million)
Chart on Germany - Year-over-year growth 2025-2030 (%)
Data Table on Germany - Year-over-year growth 2025-2030 (%)

13.4.2 UK - Market size and forecast 2025-2030

Chart on UK - Market size and forecast 2025-2030 ($ million)
Data Table on UK - Market size and forecast 2025-2030 ($ million)
Chart on UK - Year-over-year growth 2025-2030 (%)
Data Table on UK - Year-over-year growth 2025-2030 (%)

13.4.3 France - Market size and forecast 2025-2030

Chart on France - Market size and forecast 2025-2030 ($ million)
Data Table on France - Market size and forecast 2025-2030 ($ million)
Chart on France - Year-over-year growth 2025-2030 (%)
Data Table on France - Year-over-year growth 2025-2030 (%)

13.4.4 Italy - Market size and forecast 2025-2030

Chart on Italy - Market size and forecast 2025-2030 ($ million)
Data Table on Italy - Market size and forecast 2025-2030 ($ million)
Chart on Italy - Year-over-year growth 2025-2030 (%)
Data Table on Italy - Year-over-year growth 2025-2030 (%)

13.4.5 Spain - Market size and forecast 2025-2030

Chart on Spain - Market size and forecast 2025-2030 ($ million)
Data Table on Spain - Market size and forecast 2025-2030 ($ million)
Chart on Spain - Year-over-year growth 2025-2030 (%)
Data Table on Spain - Year-over-year growth 2025-2030 (%)

13.4.6 The Netherlands - Market size and forecast 2025-2030

Chart on The Netherlands - Market size and forecast 2025-2030 ($ million)
Data Table on The Netherlands - Market size and forecast 2025-2030 ($ million)
Chart on The Netherlands - Year-over-year growth 2025-2030 (%)
Data Table on The Netherlands - Year-over-year growth 2025-2030 (%)

13.5 Asia - Market size and forecast 2025-2030

Chart on Asia - Market size and forecast 2025-2030 ($ million)
Data Table on Asia - Market size and forecast 2025-2030 ($ million)
Chart on Asia - Year-over-year growth 2025-2030 (%)
Data Table on Asia - Year-over-year growth 2025-2030 (%)
Chart on Regional Comparison - Asia
Data Table on Regional Comparison - Asia

13.5.1 China - Market size and forecast 2025-2030

Chart on China - Market size and forecast 2025-2030 ($ million)
Data Table on China - Market size and forecast 2025-2030 ($ million)
Chart on China - Year-over-year growth 2025-2030 (%)
Data Table on China - Year-over-year growth 2025-2030 (%)

13.5.2 Japan - Market size and forecast 2025-2030

Chart on Japan - Market size and forecast 2025-2030 ($ million)
Data Table on Japan - Market size and forecast 2025-2030 ($ million)
Chart on Japan - Year-over-year growth 2025-2030 (%)
Data Table on Japan - Year-over-year growth 2025-2030 (%)

13.5.3 India - Market size and forecast 2025-2030

Chart on India - Market size and forecast 2025-2030 ($ million)
Data Table on India - Market size and forecast 2025-2030 ($ million)
Chart on India - Year-over-year growth 2025-2030 (%)
Data Table on India - Year-over-year growth 2025-2030 (%)

13.5.4 South Korea - Market size and forecast 2025-2030

Chart on South Korea - Market size and forecast 2025-2030 ($ million)
Data Table on South Korea - Market size and forecast 2025-2030 ($ million)
Chart on South Korea - Year-over-year growth 2025-2030 (%)
Data Table on South Korea - Year-over-year growth 2025-2030 (%)

13.5.5 Indonesia - Market size and forecast 2025-2030

Chart on Indonesia - Market size and forecast 2025-2030 ($ million)
Data Table on Indonesia - Market size and forecast 2025-2030 ($ million)
Chart on Indonesia - Year-over-year growth 2025-2030 (%)
Data Table on Indonesia - Year-over-year growth 2025-2030 (%)

13.5.6 Thailand - Market size and forecast 2025-2030

Chart on Thailand - Market size and forecast 2025-2030 ($ million)
Data Table on Thailand - Market size and forecast 2025-2030 ($ million)
Chart on Thailand - Year-over-year growth 2025-2030 (%)
Data Table on Thailand - Year-over-year growth 2025-2030 (%)

13.6 Rest of World (ROW) - Market size and forecast 2025-2030

Chart on Rest of World (ROW) - Market size and forecast 2025-2030 ($ million)
Data Table on Rest of World (ROW) - Market size and forecast 2025-2030 ($ million)
Chart on Rest of World (ROW) - Year-over-year growth 2025-2030 (%)
Data Table on Rest of World (ROW) - Year-over-year growth 2025-2030 (%)
Chart on Regional Comparison - Rest of World (ROW)
Data Table on Regional Comparison - Rest of World (ROW)

13.6.1 Brazil - Market size and forecast 2025-2030

Chart on Brazil - Market size and forecast 2025-2030 ($ million)
Data Table on Brazil - Market size and forecast 2025-2030 ($ million)
Chart on Brazil - Year-over-year growth 2025-2030 (%)
Data Table on Brazil - Year-over-year growth 2025-2030 (%)

13.6.2 Argentina - Market size and forecast 2025-2030

Chart on Argentina - Market size and forecast 2025-2030 ($ million)
Data Table on Argentina - Market size and forecast 2025-2030 ($ million)
Chart on Argentina - Year-over-year growth 2025-2030 (%)
Data Table on Argentina - Year-over-year growth 2025-2030 (%)

13.6.3 South Africa - Market size and forecast 2025-2030

Chart on South Africa - Market size and forecast 2025-2030 ($ million)
Data Table on South Africa - Market size and forecast 2025-2030 ($ million)
Chart on South Africa - Year-over-year growth 2025-2030 (%)
Data Table on South Africa - Year-over-year growth 2025-2030 (%)

13.6.4 Saudi Arabia - Market size and forecast 2025-2030

Chart on Saudi Arabia - Market size and forecast 2025-2030 ($ million)
Data Table on Saudi Arabia - Market size and forecast 2025-2030 ($ million)
Chart on Saudi Arabia - Year-over-year growth 2025-2030 (%)
Data Table on Saudi Arabia - Year-over-year growth 2025-2030 (%)

13.6.5 Colombia - Market size and forecast 2025-2030

Chart on Colombia - Market size and forecast 2025-2030 ($ million)
Data Table on Colombia - Market size and forecast 2025-2030 ($ million)
Chart on Colombia - Year-over-year growth 2025-2030 (%)
Data Table on Colombia - Year-over-year growth 2025-2030 (%)

13.6.6 UAE - Market size and forecast 2025-2030

Chart on UAE - Market size and forecast 2025-2030 ($ million)
Data Table on UAE - Market size and forecast 2025-2030 ($ million)
Chart on UAE - Year-over-year growth 2025-2030 (%)
Data Table on UAE - Year-over-year growth 2025-2030 (%)

13.6.7 Turkey - Market size and forecast 2025-2030

Chart on Turkey - Market size and forecast 2025-2030 ($ million)
Data Table on Turkey - Market size and forecast 2025-2030 ($ million)
Chart on Turkey - Year-over-year growth 2025-2030 (%)
Data Table on Turkey - Year-over-year growth 2025-2030 (%)

13.6.8 Israel - Market size and forecast 2025-2030

Chart on Israel - Market size and forecast 2025-2030 ($ million)
Data Table on Israel - Market size and forecast 2025-2030 ($ million)
Chart on Israel - Year-over-year growth 2025-2030 (%)
Data Table on Israel - Year-over-year growth 2025-2030 (%)

13.7 Market opportunity by geography

Market opportunity by geography ($ million)
Data Tables on Market opportunity by geography ($ million)

14. Drivers, Challenges, and Opportunity

14.1 Market drivers

Escalating diagnostic volumes and need for enhanced laboratory efficiency
Stringent regulatory compliance and prioritization of patient safety
Advancements in digital pathology and integrated information technology

14.2 Market challenges

High capital expenditure and total cost of ownership
Technical interoperability and legacy system integration
Complexities in workforce adaptation and process standardization

14.3 Impact of drivers and challenges

Impact of drivers and challenges in 2025 and 2030

14.4 Market opportunities

Integration of artificial intelligence for predictive quality control
Transition toward radio-frequency identification and contactless tracking
Shift toward cloud-based orchestration and interconnected diagnostic ecosystems

15. Competitive Landscape

15.1 Overview

15.2

Overview on criticality of inputs and factors of differentiation

15.3 Landscape disruption

Overview on factors of disruption

15.4 Industry risks

Impact of key risks on business

16. Competitive Analysis

16.1 Companies profiled

Companies covered

16.2 Company ranking index

16.3 Market positioning of companies

Matrix on companies position and classification

16.4 Agilent Technologies Inc.

Agilent Technologies Inc. - Overview
Agilent Technologies Inc. - Business segments
Agilent Technologies Inc. - Key news
Agilent Technologies Inc. - Key offerings
Agilent Technologies Inc. - Segment focus
SWOT

16.5 Cerebrum Corp.

Cerebrum Corp. - Overview
Cerebrum Corp. - Product / Service
Cerebrum Corp. - Key offerings
SWOT

16.6 Clinisys Inc.

Clinisys Inc. - Overview
Clinisys Inc. - Product / Service
Clinisys Inc. - Key offerings
SWOT

16.7 CompuGroup Medical SE and Co.

CompuGroup Medical SE and Co. - Overview
CompuGroup Medical SE and Co. - Business segments
CompuGroup Medical SE and Co. - Key offerings
CompuGroup Medical SE and Co. - Segment focus
SWOT

16.8 Computype Inc.

Computype Inc. - Overview
Computype Inc. - Product / Service
Computype Inc. - Key offerings
SWOT

16.9 F. Hoffmann La Roche Ltd.

F. Hoffmann La Roche Ltd. - Overview
F. Hoffmann La Roche Ltd. - Business segments
F. Hoffmann La Roche Ltd. - Key news
F. Hoffmann La Roche Ltd. - Key offerings
F. Hoffmann La Roche Ltd. - Segment focus
SWOT

16.10 General Data Co. Inc.

General Data Co. Inc. - Overview
General Data Co. Inc. - Product / Service
General Data Co. Inc. - Key offerings
SWOT

16.11 Leica Biosystems Nussloch GmbH

Leica Biosystems Nussloch GmbH - Overview
Leica Biosystems Nussloch GmbH - Product / Service
Leica Biosystems Nussloch GmbH - Key offerings
SWOT

16.12 LigoLab Information Systems

LigoLab Information Systems - Overview
LigoLab Information Systems - Product / Service
LigoLab Information Systems - Key offerings
SWOT

16.13 NovoPath Inc.

NovoPath Inc. - Overview
NovoPath Inc. - Product / Service
NovoPath Inc. - Key offerings
SWOT

16.14 Powered Milestone Srl

Powered Milestone Srl - Overview
Powered Milestone Srl - Product / Service
Powered Milestone Srl - Key offerings
SWOT

16.15 Sakura Finetek USA Inc.

Sakura Finetek USA Inc. - Overview
Sakura Finetek USA Inc. - Product / Service
Sakura Finetek USA Inc. - Key offerings
SWOT

16.16 Siemens Healthineers AG

Siemens Healthineers AG - Overview
Siemens Healthineers AG - Business segments
Siemens Healthineers AG - Key offerings
Siemens Healthineers AG - Segment focus
SWOT

16.17 StatLab Medical Products

StatLab Medical Products - Overview
StatLab Medical Products - Product / Service
StatLab Medical Products - Key offerings
SWOT

16.18 Zebra Technologies Corp.

Zebra Technologies Corp. - Overview
Zebra Technologies Corp. - Business segments
Zebra Technologies Corp. - Key news
Zebra Technologies Corp. - Key offerings
Zebra Technologies Corp. - Segment focus
SWOT

17. Appendix

17.1 Scope of the report

Market definition
Objectives
Notes and caveats

17.2 Inclusions and exclusions checklist

Inclusions checklist
Exclusions checklist

17.3 Currency conversion rates for US$

17.4 Research methodology

17.5 Data procurement

Information sources

17.6 Data validation

17.7 Validation techniques employed for market sizing

17.8 Data synthesis

17.9 360 degree market analysis

17.10 List of abbreviations

Research Methodology

Technavio presents a detailed picture of the market by way of study, synthesis, and summation of data from multiple sources. The analysts have presented the various facets of the market with a particular focus on identifying the key industry influencers. The data thus presented is comprehensive, reliable, and the result of extensive research, both primary and secondary.

INFORMATION SOURCES

Primary sources

  • Manufacturers and suppliers
  • Channel partners
  • Industry experts
  • Strategic decision makers

Secondary sources

  • Industry journals and periodicals
  • Government data
  • Financial reports of key industry players
  • Historical data
  • Press releases

DATA ANALYSIS

Data Synthesis

  • Collation of data
  • Estimation of key figures
  • Analysis of derived insights

Data Validation

  • Triangulation with data models
  • Reference against proprietary databases
  • Corroboration with industry experts

REPORT WRITING

Qualitative

  • Market drivers
  • Market challenges
  • Market trends
  • Five forces analysis

Quantitative

  • Market size and forecast
  • Market segmentation
  • Geographical insights
  • Competitive landscape

Interested in this report?

Get your sample now to see our research methodology and insights!

Download Now

Frequently Asked Questions

Anatomic Pathology Track And Trace Solutions market growth will increase by USD 2756.2 million during 2026-2030.

The Anatomic Pathology Track And Trace Solutions market is expected to grow at a CAGR of 27.5% during 2026-2030.

Anatomic Pathology Track And Trace Solutions market is segmented by End-user (Hospital laboratories, Independent and reference laboratories, Others) Technology (Barcode, RFID) Product (Software, Hardware, Consumables) Application (Slides tracking, Tissue cassettes and blocks tracking, Specimen tracking)

Agilent Technologies Inc., Cerebrum Corp., Cirdan, Clinisys Inc., CompuGroup Medical SE and Co., Computype Inc., Epredia, F. Hoffmann La Roche Ltd., General Data Co. Inc., Leica Biosystems Nussloch GmbH, LigoLab Information Systems, NovoPath Inc., Powered Milestone Srl, Psyche Systems Corp., Sakura Finetek USA Inc., Siemens Healthineers AG, Soft Computer Consultants Inc., StatLab Medical Products, XIFIN Inc., Zebra Technologies Corp. are a few of the key vendors in the Anatomic Pathology Track And Trace Solutions market.

North America will register the highest growth rate of 37.3% among the other regions. Therefore, the Anatomic Pathology Track And Trace Solutions market in North America is expected to garner significant business opportunities for the vendors during the forecast period.

US, Canada, Mexico, Germany, UK, France, Italy, Spain, The Netherlands, China, Japan, India, South Korea, Indonesia, Thailand, Brazil, Argentina, South Africa, Saudi Arabia, Colombia, UAE, Turkey, Israel

  • Escalating diagnostic volumes and need for enhanced laboratory efficiency is the driving factor this market.

The Anatomic Pathology Track And Trace Solutions market vendors should focus on grabbing business opportunities from the End-user segment as it accounted for the largest market share in the base year.
RIA - Research AI Assistant
Ask RIA