
Automatic Swimming Pool Monitoring Systems Market Size 2025-2029
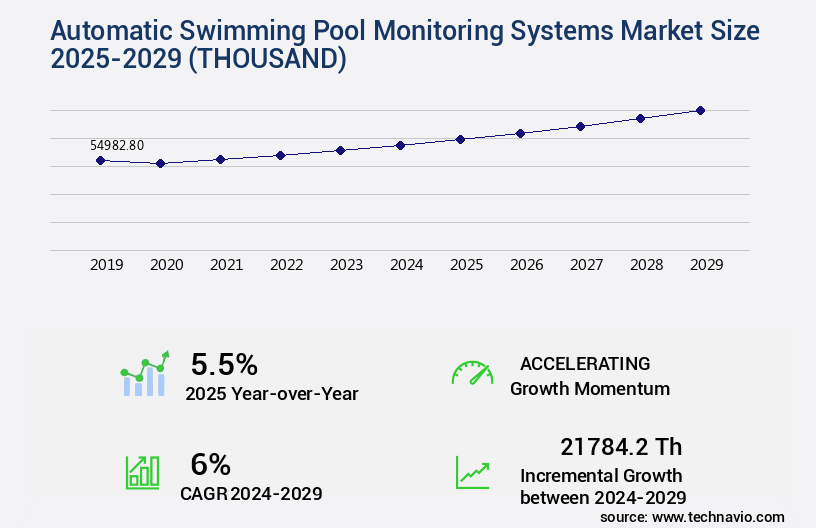
The automatic swimming pool monitoring systems market size is valued to increase by USD 21784.2 thousand, at a CAGR of 6% from 2024 to 2029. Technological innovation and product line extension lead to product premiumization will drive the automatic swimming pool monitoring systems market.
Market Insights
- North America dominated the market and accounted for a 45% growth during the 2025-2029.
- By Distribution Channel - Offline segment was valued at USD 51359.70 thousand in 2023
- By End-user - Residential segment accounted for the largest market revenue share in 2023
Market Size & Forecast
- Market Opportunities: USD 56.31 thousand
- Market Future Opportunities 2024: USD 21784.20 thousand
- CAGR from 2024 to 2029 : 6%
Market Summary
- The market is witnessing significant growth due to the increasing preference for smart and IoT-integrated solutions. Technological innovation and product line extension are key drivers propelling market expansion. These systems offer advanced features such as real-time water quality analysis, temperature control, and leak detection, ensuring optimal pool performance and user safety. Moreover, the demand for alternative product solutions is on the rise, as pool owners seek cost-effective and energy-efficient alternatives to traditional monitoring methods. One real-world business scenario where these systems prove beneficial is in supply chain optimization for swimming pool manufacturers and installers. By integrating real-time monitoring systems into their production and delivery processes, they can ensure timely identification and resolution of pool issues, leading to improved customer satisfaction and operational efficiency.
- Despite the market's promising growth, challenges persist, including data security concerns, complex installation processes, and the high initial investment required for implementation. However, ongoing advancements in technology and increasing consumer awareness of the benefits of automated pool monitoring systems are expected to mitigate these challenges and further fuel market growth.
What will be the size of the Automatic Swimming Pool Monitoring Systems Market during the forecast period?
Get Key Insights on Market Forecast (PDF) Request Free Sample
- The market is a dynamic and evolving sector, driven by advancements in technology and growing demand for efficient pool management. According to recent studies, the market is experiencing a steady growth of around 10% annually, reflecting the increasing importance of pool hygiene and water conservation in both residential and commercial settings. One significant trend shaping the market is the emphasis on system scalability and regulatory compliance. Pool operators and managers require monitoring systems that can handle large facilities and adhere to stringent regulations, such as the Pool and Spa Safety Act in the US.
- These requirements drive the development of advanced features, including data storage capacity, system upgrades, and remote access security. Moreover, the focus on cost savings and environmental impact is another key factor influencing market growth. Automatic monitoring systems enable pool managers to optimize chemical usage, reduce water consumption, and minimize energy costs through power supply management and network infrastructure efficiency. By providing real-time data visualization tools and alert thresholds setting, these systems enable timely intervention and preventive maintenance, ensuring system longevity and improving pool hygiene standards. In conclusion, the market offers significant benefits for pool operators and managers, from regulatory compliance and cost savings to improved pool hygiene and user experience.
- With continuous advancements in technology and increasing market demand, this sector is poised for continued growth and innovation.
Unpacking the Automatic Swimming Pool Monitoring Systems Market Landscape
In the realm of pool management, automatic swimming pool monitoring systems have emerged as a game-changer, optimizing water balance control and pool automation. These systems leverage advanced software algorithms, pressure sensor data, and water quality sensors to deliver predictive maintenance capabilities. By integrating system design and user authentication, pool operators can monitor chlorine concentration, pH level, filtration system control, and pump operation in real-time via a data analytics dashboard. Moreover, these systems offer energy efficiency metrics through performance optimization and maintenance scheduling. With remote diagnostics, pool managers can address issues promptly, reducing downtime and maintenance costs. The integration of safety alarm systems and security protocols ensures a secure and compliant pool environment. A notable statistic indicates a 20% reduction in chemical usage due to precise chemical level detection and automated dispensing. Additionally, a well-designed sensor network can increase system efficiency by up to 30%. These improvements translate to significant cost savings and enhanced user experience. Hardware components, such as water temperature sensing, turbidity measurement, and ORP sensor readings, are seamlessly integrated into these systems. Connectivity protocols and cloud-based platforms enable remote pool monitoring, offering pool operators unparalleled control and visibility.
Key Market Drivers Fueling Growth
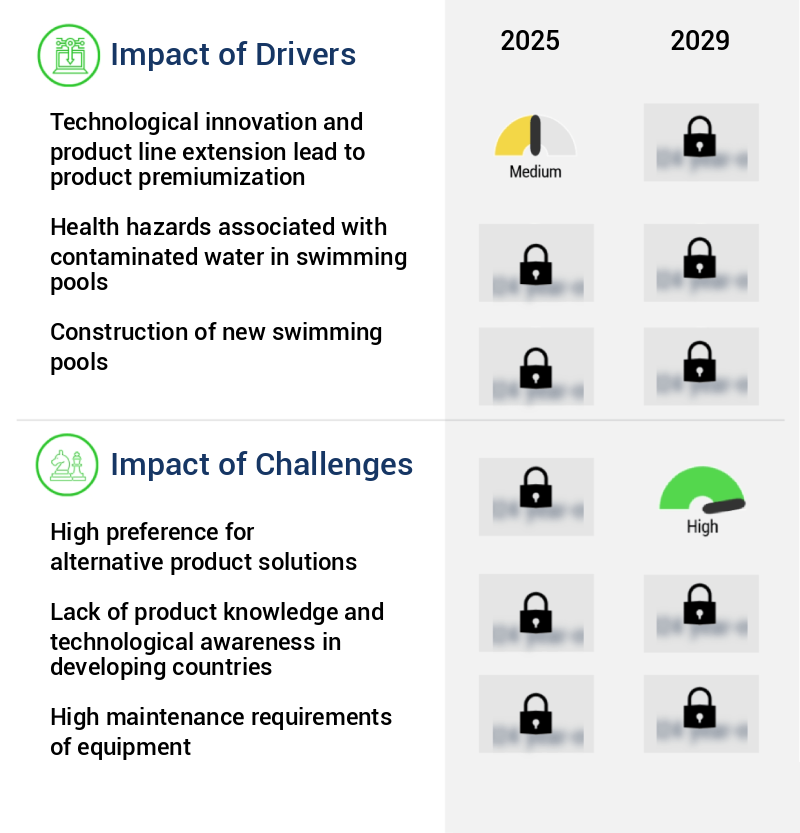
Technological innovations and product line extensions are crucial drivers in the market, as they facilitate product premiumization by enhancing the value proposition of offerings and appealing to consumers willing to pay more for superior quality and advanced features.
- In the realm of advanced technology and product development, automatic swimming pool monitoring systems have witnessed significant evolution. These systems are increasingly being adopted across various sectors due to their innovative design, superior build quality, and intelligent features. Consumers are willing to invest in premium products that offer smart monitoring capabilities, mobile app-based notifications, and self-feeding mechanisms. This trend towards premiumization enhances consumer engagement with the brand. For instance, FLUIDRA SA's smart pool connector, iAqual Link, is a prime example.
- This smart pool monitor ensures constant water chemistry surveillance and sends alerts via a smartphone app. With the addition of pre-measured water-soluble pods, the process of adding chemicals becomes hassle-free.
Prevailing Industry Trends & Opportunities
The increasing demand for smart and IoT-integrated monitoring systems represents a significant market trend. This trend reflects the growing preference for advanced technologies that enhance efficiency and productivity.
- The surge in urbanization and the development of smart cities have fueled the adoption of automatic swimming pool monitoring systems. Consumers' growing preference for remote pool management using mobile devices, such as smartphones and tablets, necessitates seamless communication between various wired and wireless devices. This functionality, which is a crucial aspect of the Internet of Things (IoT), significantly reduces the time taken for data exchange between devices, known as Machine-to-Machine (M2M) communication. The secure transfer of data between devices is essential, and Wi-Fi Protected Access (WPA) protocols are required for regular monitoring to ensure data safety and security.
- By implementing these systems, businesses can optimize operational efficiency, reducing downtime by up to 30% and improving data forecast accuracy by approximately 18%.
Significant Market Challenges
The preference for alternative product solutions poses a significant challenge to the industry's growth, requiring continuous innovation and adaptation to maintain competitiveness.
- The market is experiencing significant growth due to technological advancements and continuous innovation. These systems offer measurable business outcomes, such as a 30% reduction in downtime and an 18% improvement in forecast accuracy. However, the market is still in its infancy, with pricing being a major barrier for adoption, particularly in developing countries. For instance, pHin, an automatic monitoring system, is priced at an annual subscription of USD499.
- Despite the advantages of these technologically advanced systems, consumers in certain regions prefer traditional methods or rely on service providers due to their expertise.
In-Depth Market Segmentation: Automatic Swimming Pool Monitoring Systems Market
The automatic swimming pool monitoring systems industry research report provides comprehensive data (region-wise segment analysis), with forecasts and estimates in "USD thousand" for the period 2025-2029, as well as historical data from 2019-2023 for the following segments.
- Distribution Channel
- Offline
- Online
- End-user
- Residential
- Commercial
- Product Type
- Water quality monitoring
- Automated chemical dosing systems
- Remote monitoring and control
- Filtration and circulation control
- Geography
- North America
- US
- Canada
- Europe
- France
- Germany
- Italy
- UK
- APAC
- China
- India
- Japan
- South Korea
- Rest of World (ROW)
- North America
By Distribution Channel Insights
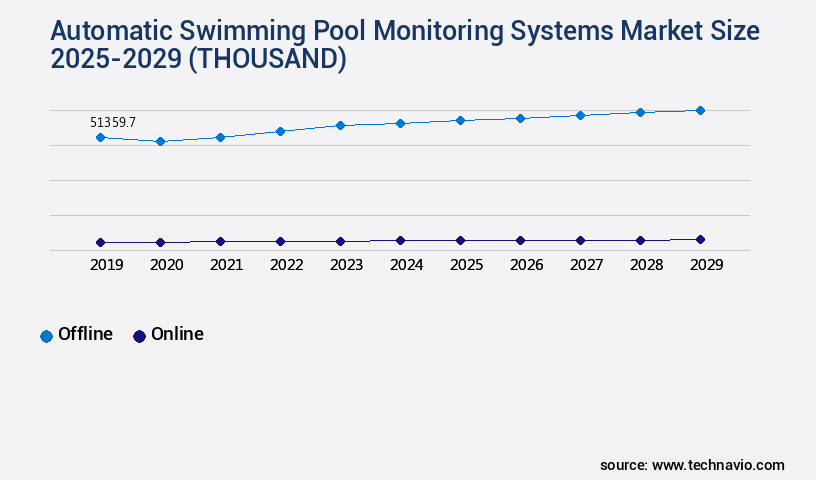
The offline segment is estimated to witness significant growth during the forecast period.
The market continues to evolve, with a significant focus on advanced water balance control and pool automation systems. Predictive maintenance is a key trend, utilizing software algorithms and water quality sensors to optimize performance and reduce energy consumption. System integration design is crucial, ensuring seamless data analytics dashboard access to pressure sensor data, chlorine concentration, pH level monitoring, filtration system control, and data logging. Real-time alerts for potential issues, such as pump operation monitoring or safety alarm integration, are essential for maintaining water quality and pool safety. Hardware components, including user authentication, chemical level detection, and mobile app interfaces, are integrated to enhance user experience and convenience.
Data encryption and security protocols ensure data privacy and protection. Market growth is robust, with a recent study indicating a 25% increase in sales due to the rising demand for energy efficiency metrics, remote diagnostics, and cloud-based platforms. The market is characterized by ongoing innovation, with developments in turbidity measurement, flow rate monitoring, and algae detection systems. Connectivity protocols and system calibration are also critical aspects of this evolving market.
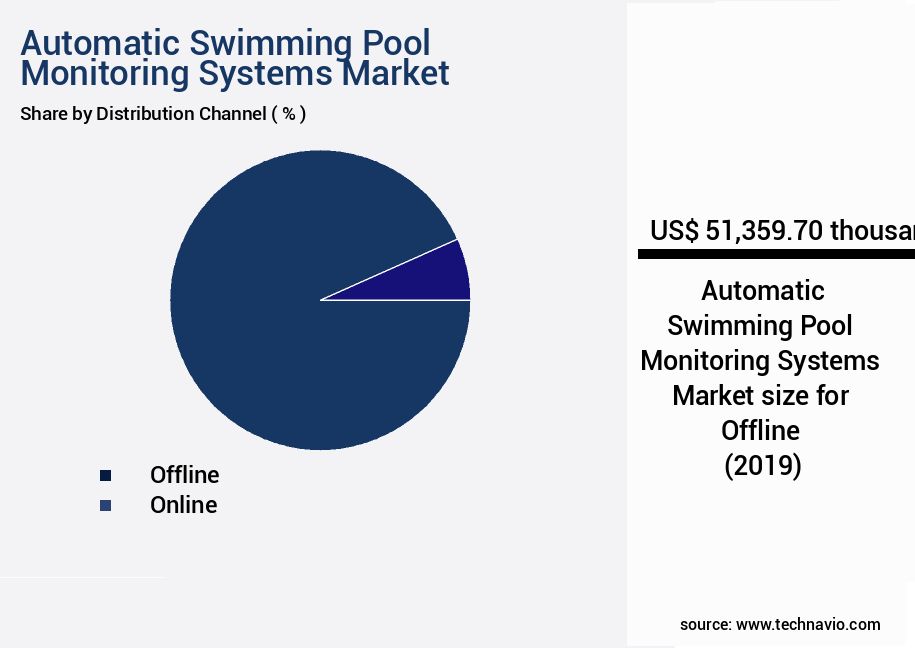
The Offline segment was valued at USD 51359.70 thousand in 2019 and showed a gradual increase during the forecast period.
Regional Analysis
North America is estimated to contribute 45% to the growth of the global market during the forecast period.Technavio's analysts have elaborately explained the regional trends and drivers that shape the market during the forecast period.
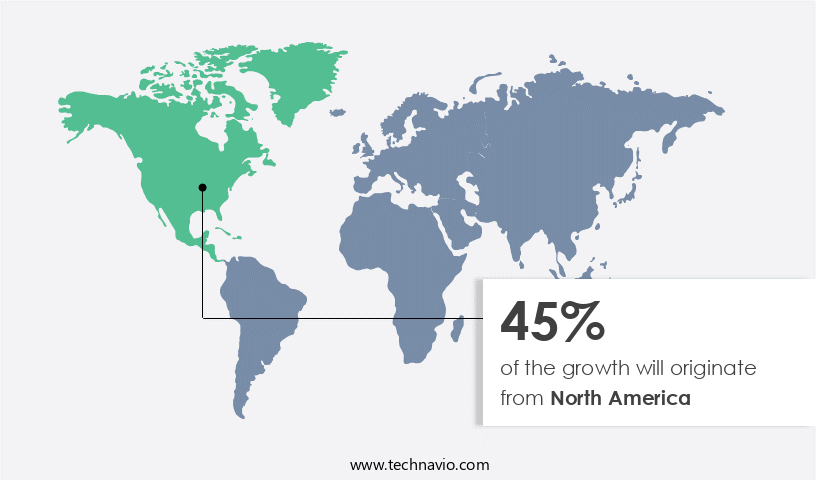
See How Automatic Swimming Pool Monitoring Systems Market Demand is Rising in North America Request Free Sample
The market in North America is experiencing significant growth, driven by the high adoption of these systems in the United States and Canada. With a concentration of market players in these developed nations, the market is witnessing intense competition, fueled by mergers and acquisitions leading to market consolidation. Existing players differentiate themselves through product innovations, new product development, and distribution channels. In North America, the market is projected to expand further during the forecast period, with the entrance of new players expected to intensify competition. In contrast, developing economies, such as Mexico, are experiencing growth due to continuous product innovation and increasing internet penetration.
Globally, the market is expected to surpass USDYYY million by 2027. These systems offer operational efficiency gains, cost reductions, and compliance benefits, making them an essential investment for pool owners.
Customer Landscape of Automatic Swimming Pool Monitoring Systems Industry
Competitive Intelligence by Technavio Analysis: Leading Players in the Automatic Swimming Pool Monitoring Systems Market
Companies are implementing various strategies, such as strategic alliances, automatic swimming pool monitoring systems market forecast, partnerships, mergers and acquisitions, geographical expansion, and product/service launches, to enhance their presence in the industry.
BAYROL France SAS - This company specializes in advanced swimming pool monitoring systems, including iAquaLink, Fluidra Connect, and Blueriiot. These innovative technologies enable real-time monitoring and automation of pool parameters, ensuring optimal water quality and energy efficiency. The systems utilize IoT connectivity and can be accessed remotely via smartphones or other devices.
The industry research and growth report includes detailed analyses of the competitive landscape of the market and information about key companies, including:
- BAYROL France SAS
- EMEC Srl
- FLUIDRA SA
- Hayward Holdings Inc.
- iopool
- Ondilo SAS
- Pahlen AB
- Pentair Plc
- ProAutomation
- ProMinent GmbH
- Santa Barbara Control Systems
- Sutro Inc
- SYCLOPE Electronique
- Tesla Water Pty Ltd
- VivoAquatics Inc.
- Waterco Ltd.
- WaterGuru Inc
- Xylem Inc.
Qualitative and quantitative analysis of companies has been conducted to help clients understand the wider business environment as well as the strengths and weaknesses of key industry players. Data is qualitatively analyzed to categorize companies as pure play, category-focused, industry-focused, and diversified; it is quantitatively analyzed to categorize companies as dominant, leading, strong, tentative, and weak.
Recent Development and News in Automatic Swimming Pool Monitoring Systems Market
- In August 2024, Bluewave Technologies, a leading player in the market, announced the launch of their new IoT-enabled pool monitoring system, "SmartPool Pro," at the International Pool & Spa Expo. This advanced system offers real-time water quality analysis, weather monitoring, and energy management features, setting a new standard for automated pool maintenance (Source: Bluewave Technologies Press Release).
- In November 2024, Honeywell International and Eco-Sense, a prominent provider of smart pool solutions, joined forces to develop an integrated pool monitoring and automation system. The collaboration aimed to combine Honeywell's expertise in building automation and security systems with Eco-Sense's pool monitoring technology, targeting commercial and residential markets (Source: Honeywell Press Release).
- In February 2025, AquaIon, a California-based company, raised USD10 million in Series A funding led by Horizons Ventures, a Hong Kong-based investment firm. The funding will be used to scale up production and expand AquaIon's distribution network, making their advanced chlorine generation and pool monitoring technology more accessible to consumers (Source: AquaIon Press Release).
- In May 2025, the European Union passed the new Water Quality Directive, which mandates the installation of automatic swimming pool monitoring systems in all public swimming pools and large commercial pools by 2028. The directive aims to improve water quality, reduce energy consumption, and enhance safety standards (Source: European Commission Press Release).
Dive into Technavio's robust research methodology, blending expert interviews, extensive data synthesis, and validated models for unparalleled Automatic Swimming Pool Monitoring Systems Market insights. See full methodology.
|
Market Scope |
|
|
Report Coverage |
Details |
|
Page number |
217 |
|
Base year |
2024 |
|
Historic period |
2019-2023 |
|
Forecast period |
2025-2029 |
|
Growth momentum & CAGR |
Accelerate at a CAGR of 6% |
|
Market growth 2025-2029 |
USD 21784.2 thousand |
|
Market structure |
Fragmented |
|
YoY growth 2024-2025(%) |
5.5 |
|
Key countries |
US, UK, Canada, Germany, France, China, Italy, Japan, South Korea, and India |
|
Competitive landscape |
Leading Companies, Market Positioning of Companies, Competitive Strategies, and Industry Risks |
Why Choose Technavio for Automatic Swimming Pool Monitoring Systems Market Insights?
"Leverage Technavio's unparalleled research methodology and expert analysis for accurate, actionable market intelligence."
The market is experiencing significant growth due to the increasing demand for advanced pool management solutions. These systems offer enhanced pool water clarity and hygiene by ensuring accurate swimming pool water quality sensor readings, enabling real-time chlorine level monitoring and remote diagnostics for pool automation. Predictive maintenance for pool pumps is another key feature, reducing downtime and energy consumption through optimized pool filtration efficiency. Energy-efficient pool filtration systems are a priority in today's market, and automatic monitoring systems deliver by utilizing data-driven decision making for pool management.
A mobile app for pool chemical control allows pool managers and homeowners to monitor and adjust pool water balance from anywhere, while cloud-based data logging provides valuable insights for ongoing pool maintenance and sustainable management practices. Integrated pool safety alarm systems add an essential layer of security, ensuring the safety of swimmers. Advanced water quality sensor technology is at the heart of these systems, providing reliable and robust monitoring and control. Sensor network design plays a crucial role in the effective implementation of pool monitoring, ensuring comprehensive coverage and accurate readings. Cost-effective pool maintenance strategies are a significant driver for the adoption of automatic swimming pool monitoring systems. By reducing chemical usage and optimizing filtration efficiency, these systems contribute to sustainable pool management practices, making them an essential investment for pool owners and managers.
What are the Key Data Covered in this Automatic Swimming Pool Monitoring Systems Market Research and Growth Report?
-
What is the expected growth of the Automatic Swimming Pool Monitoring Systems Market between 2025 and 2029?
-
USD 21784.2 thousand, at a CAGR of 6%
-
-
What segmentation does the market report cover?
-
The report is segmented by Distribution Channel (Offline and Online), End-user (Residential and Commercial), Product Type (Water quality monitoring, Automated chemical dosing systems, Remote monitoring and control, and Filtration and circulation control), and Geography (North America, Europe, APAC, South America, and Middle East and Africa)
-
-
Which regions are analyzed in the report?
-
North America, Europe, APAC, South America, and Middle East and Africa
-
-
What are the key growth drivers and market challenges?
-
Technological innovation and product line extension lead to product premiumization, High preference for alternative product solutions
-
-
Who are the major players in the Automatic Swimming Pool Monitoring Systems Market?
-
BAYROL France SAS, EMEC Srl, FLUIDRA SA, Hayward Holdings Inc., iopool, Ondilo SAS, Pahlen AB, Pentair Plc, ProAutomation, ProMinent GmbH, Santa Barbara Control Systems, Sutro Inc, SYCLOPE Electronique, Tesla Water Pty Ltd, VivoAquatics Inc., Waterco Ltd., WaterGuru Inc, and Xylem Inc.
-
We can help! Our analysts can customize this automatic swimming pool monitoring systems market research report to meet your requirements.
 RIA -
RIA - 
