Automotive 3PL Market Size 2026-2030
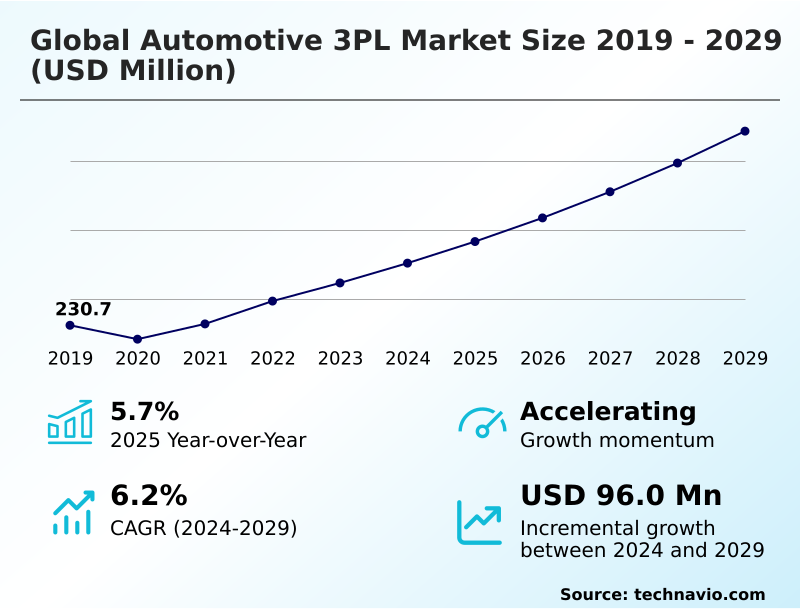
The automotive 3pl market size is valued to increase by USD 114.23 million, at a CAGR of 6.8% from 2025 to 2030. Growing vehicle production boosting logistics demand will drive the automotive 3pl market.
Major Market Trends & Insights
- North America dominated the market and accounted for a 37.3% growth during the forecast period.
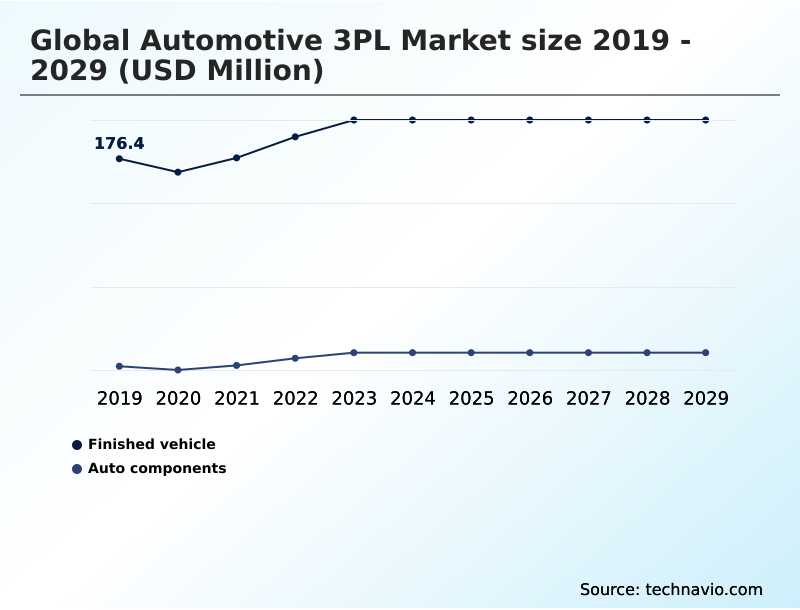
- By Type - Finished vehicle segment was valued at USD 181.48 million in 2024
- By Service - Transportation segment accounted for the largest market revenue share in 2024
Market Size & Forecast
- Market Opportunities:
- Market Future Opportunities: USD 114.23 million
- CAGR from 2025 to 2030 : 6.8%
Market Summary
- The automotive 3PL market is defined by the outsourcing of complex supply chain functions to specialized partners. These entities manage critical operations from inbound-to-manufacturing logistics to finished vehicle logistics and aftermarket parts distribution. Key drivers include the globalization of manufacturing and the increasing complexity of vehicle components, which demand precise just-in-time delivery and sophisticated inventory management solutions.
- A major trend is the digitalization of the supply chain, with supply chain visibility platforms and AI-driven route optimization becoming standard.
- For instance, a vehicle manufacturer can use a logistics control tower to monitor a shipment of EV batteries in real-time, ensuring temperature-controlled warehousing protocols are met and using predictive logistics analytics to reroute the shipment to avoid a port strike, thus preventing a costly assembly line shutdown.
- However, the industry faces challenges from high operational costs, especially related to electric vehicle battery logistics and the investment required for green logistics solutions. The need for specialized capabilities in areas like customs brokerage services and reverse logistics management further highlights the value of expert outsourced logistics providers in navigating this dynamic environment.
What will be the Size of the Automotive 3PL Market during the forecast period?
Get Key Insights on Market Forecast (PDF) Get Free Sample
How is the Automotive 3PL Market Segmented?
The automotive 3pl industry research report provides comprehensive data (region-wise segment analysis), with forecasts and estimates in "USD thousand" for the period 2026-2030, as well as historical data from 2020-2024 for the following segments.
- Type
- Finished vehicle
- Auto components
- Service
- Transportation
- Warehousing
- Distribution
- Inventory management
- Others
- Vehicle type
- Passenger cars
- Commercial vehicles
- Geography
- North America
- US
- Canada
- Mexico
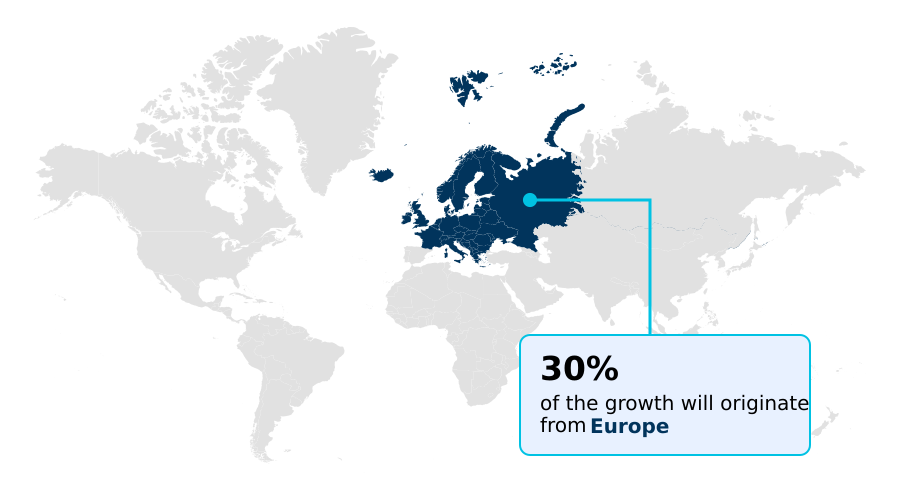
- Europe
- Germany
- UK
- France
- APAC
- China
- Japan
- India
- South America
- Brazil
- Argentina
- Colombia
- Middle East and Africa
- Saudi Arabia
- UAE
- South Africa
- Rest of World (ROW)
- North America
By Type Insights
The finished vehicle segment is estimated to witness significant growth during the forecast period.
The finished vehicle segment is a cornerstone of the market, encompassing the intricate supply chain orchestration required for global vehicle distribution.
Finished vehicle logistics involves specialized finished vehicle transport and sophisticated vehicle logistics management to move assets from assembly lines to dealerships. The rise of software-defined vehicle manufacturing adds complexity, demanding more than just transport.
Providers are increasingly engaged in value-added warehousing and pre-delivery inspection services, which can reduce dealer-side prep time by up to 25%. This integrated approach extends to last-mile vehicle delivery and the management of aftermarket parts distribution.
Effective inventory management solutions and robust automotive supply chain visibility are crucial for success in both automotive aftermarket logistics and contract logistics for automotive.
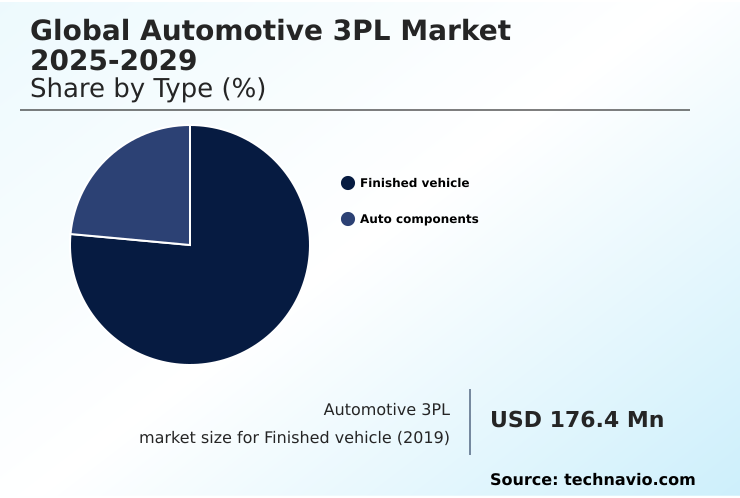
The Finished vehicle segment was valued at USD 181.48 million in 2024 and showed a gradual increase during the forecast period.
Regional Analysis
North America is estimated to contribute 37.3% to the growth of the global market during the forecast period.Technavio’s analysts have elaborately explained the regional trends and drivers that shape the market during the forecast period.
See How Automotive 3PL Market Demand is Rising in North America Get Free Sample
The geographic landscape is shifting, with significant investment in North America and APAC. In these regions, providers are implementing green logistics solutions and expanding intermodal freight transport networks to connect manufacturing hubs.
The use of transportation telematics data has improved fleet utilization by over 15% in the United States. Roll-on/roll-off shipping remains critical for trans-pacific routes from China and Japan.
Advanced predictive logistics analytics are being deployed to mitigate risks in volatile trade corridors in Europe. The adoption of blockchain in automotive logistics is enhancing transparency for high-value shipments, particularly in Germany.
Effective supply chain network design and a robust transportation management system are key differentiators, with automotive logistics procurement focusing on partners that provide integrated logistics for automotive across multiple geographies.
Market Dynamics
Our researchers analyzed the data with 2025 as the base year, along with the key drivers, trends, and challenges. A holistic analysis of drivers will help companies refine their marketing strategies to gain a competitive advantage.
- The automotive 3PL sector is evolving beyond simple transport, with companies increasingly evaluating 3PL services for electric vehicle production and strategies for managing automotive supply chain disruptions. Understanding the role of 3PL in automotive manufacturing is crucial for OEMs aiming for efficiency.
- Specialized services for aftermarket parts logistics and distribution are as critical as those for finished vehicle logistics and transportation. Many firms are now outsourcing inbound logistics for OEM to achieve precision, recognizing the benefits of digital platforms in automotive 3PL. A major area of investment is temperature-controlled logistics for EV batteries, which poses unique challenges compared to standard component handling.
- Similarly, streamlining cross-border logistics for auto components and perfecting just-in-time delivery for assembly plants remain top priorities. Warehouse automation in automotive logistics is a key enabler for improving visibility in automotive supply chains. The push for sustainable logistics in the automotive industry is reshaping operations, although there are still many challenges in automotive 3PL operations.
- When selecting a 3PL provider for automotive, decision-makers weigh expertise in technologies like real-time tracking for finished vehicles and capabilities in reverse logistics for automotive parts. The total cost of automotive logistics outsourcing is a complex calculation, but firms using integrated providers have reported operational cost profiles that are, on average, 15% more predictable than those managing logistics in-house.
- These dynamics apply to both 3PL solutions for commercial vehicles and the high-volume automotive 3PL for passenger cars segment.
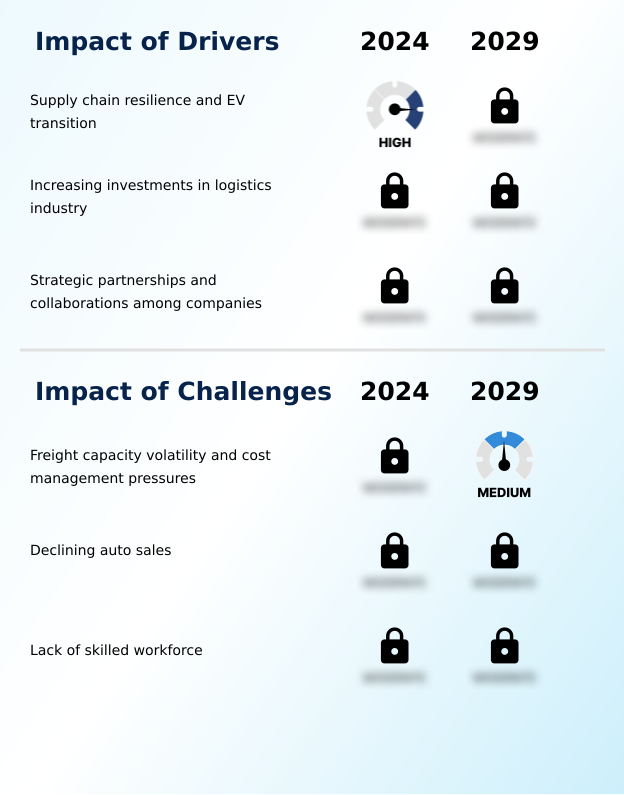
What are the key market drivers leading to the rise in the adoption of Automotive 3PL Industry?
- The continued growth in global vehicle production is a key driver, directly boosting demand for specialized automotive logistics services.
- Expanding vehicle production necessitates sophisticated third-party logistics services, particularly for inbound-to-manufacturing logistics.
- The precision required for just-in-time delivery and just-in-sequence delivery has led to stronger OEM logistics partnership models, where providers offering customs brokerage services have reduced cross-border clearance times by 20%.
- Effective multimodal transportation management is essential for optimizing these complex flows. As supply chains globalize, demand for seamless cross-border logistics services and specialized automotive transport services intensifies.
- Providers utilize freight consolidation services to enhance efficiency, with some achieving a 10% reduction in LTL costs. This reliance on dedicated contract carriage ensures consistent inbound logistics for assembly and full customs compliance for auto parts.
What are the market trends shaping the Automotive 3PL Industry?
- The increasing adoption of digital logistics platforms represents a significant upcoming market trend. These platforms are reshaping automotive supply chains by enhancing visibility and operational efficiency.
- The adoption of advanced automotive logistics technology is accelerating, with firms leveraging supply chain visibility platforms to achieve automotive supply chain resilience. Warehouse automation systems, including autonomous mobile robots, have improved order accuracy by over 15% in component picking operations.
- The use of a logistics digital twin allows for simulation and automotive supply chain optimization, while AI-driven route optimization reduces fuel consumption by up to 12%. An integrated logistics control tower provides a unified view, enabling effective real-time freight tracking and management of JIT and JIS logistics.
- This push toward an IoT-enabled supply chain and integrated logistics for automotive is critical for maintaining competitiveness and achieving significant transportation cost reduction.
What challenges does the Automotive 3PL Industry face during its growth?
- High operational costs for logistics providers present a key challenge that affects the growth and profitability of the industry.
- The transition to electric vehicles introduces significant operational hurdles, particularly in electric vehicle battery logistics. Handling these components requires strict adherence to hazardous materials handling protocols and investment in temperature-controlled warehousing, where energy costs can be 40% higher than standard facilities. The focus on sustainable automotive logistics is driving interest in circular economy logistics and efficient reverse logistics management.
- Some firms are exploring fourth-party logistics (4PL) models to orchestrate these complex EV supply chain solutions. However, the cost of automotive logistics outsourcing is rising, pressuring providers to optimize operations through better yard management systems and strategic use of freight brokerage services. Implementing warehouse kitting and assembly for batteries also presents a high-cost, high-risk challenge for many outsourced logistics providers.
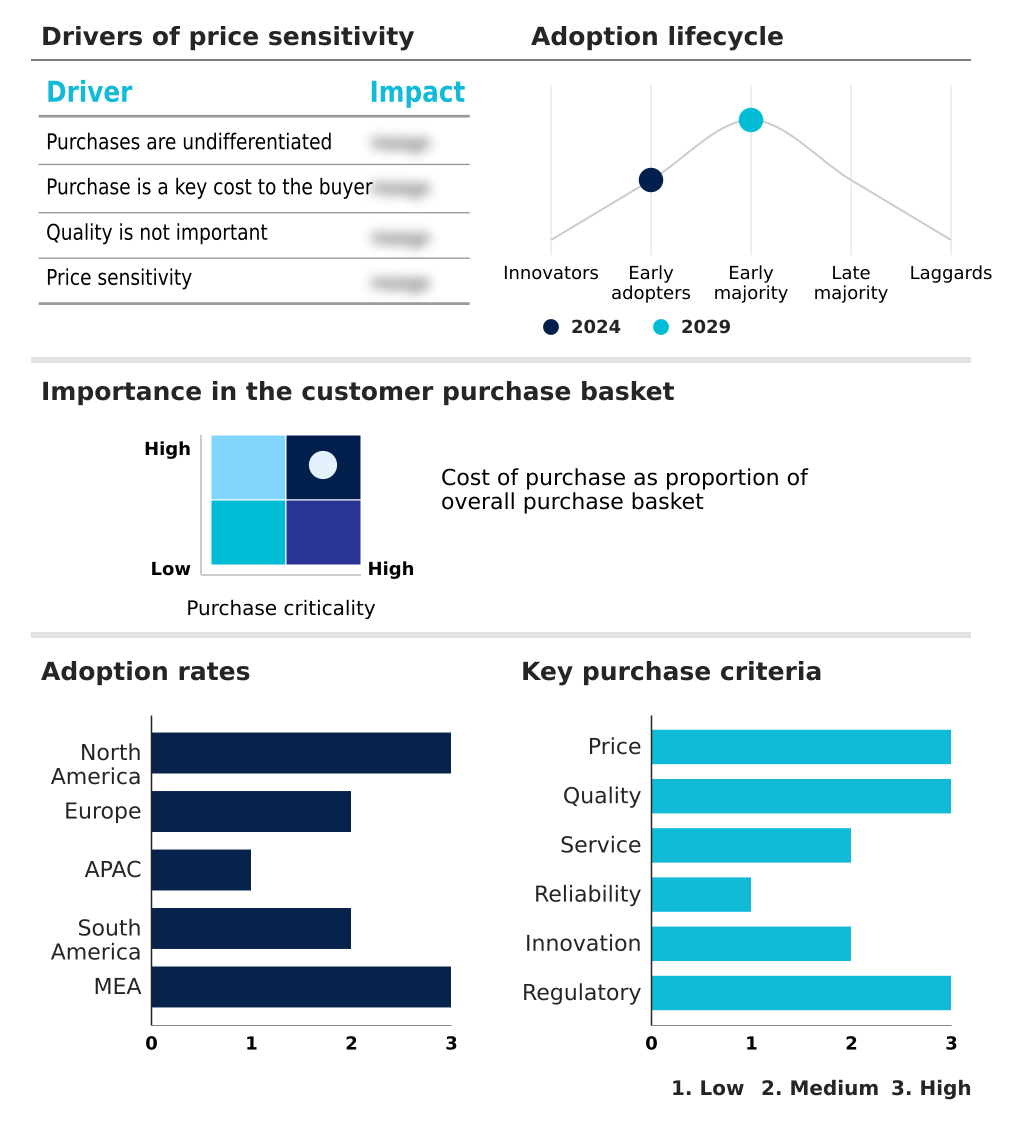
Exclusive Technavio Analysis on Customer Landscape
The automotive 3pl market forecasting report includes the adoption lifecycle of the market, covering from the innovator’s stage to the laggard’s stage. It focuses on adoption rates in different regions based on penetration. Furthermore, the automotive 3pl market report also includes key purchase criteria and drivers of price sensitivity to help companies evaluate and develop their market growth analysis strategies.
Customer Landscape of Automotive 3PL Industry
Competitive Landscape
Companies are implementing various strategies, such as strategic alliances, automotive 3pl market forecast, partnerships, mergers and acquisitions, geographical expansion, and product/service launches, to enhance their presence in the industry.
Agility Public Warehousing Co. - Specialized offerings include global freight forwarding, integrated supply chain management, and comprehensive aftermarket parts distribution for the automotive sector.
The industry research and growth report includes detailed analyses of the competitive landscape of the market and information about key companies, including:
- Agility Public Warehousing Co.
- BLG Logistics
- C H Robinson Worldwide Inc.
- CEVA Logistics SA
- DHL International GmbH
- DP World
- DSV AS
- Expeditors International Inc.
- FIEGE Logistik Stiftung and Co. KG
- GEODIS
- GXO Logistics Inc.
- Kuehne Nagel Management AG
- Logwin AG
- Nippon Express Holdings Inc.
- Penske Truck Leasing Co. L.P.
- Ryder System Inc.
- Schenker AG
- TIBA
Qualitative and quantitative analysis of companies has been conducted to help clients understand the wider business environment as well as the strengths and weaknesses of key industry players. Data is qualitatively analyzed to categorize companies as pure play, category-focused, industry-focused, and diversified; it is quantitatively analyzed to categorize companies as dominant, leading, strong, tentative, and weak.
Recent Development and News in Automotive 3pl market
- In February, 2025, DHL Supply Chain launched a carbon-neutral logistics center in Germany, dedicated to the lifecycle management of electric vehicle batteries, incorporating automated recovery and safety systems.
- In April, 2025, Kuehne+Nagel initiated a partnership with Changan Automobile to manage aftermarket logistics for electric vehicle models across Europe, providing spare parts and battery solutions from its Helmond automotive campus.
- In September, 2025, CEVA Logistics secured a multi-year agreement with General Motors Europe to manage the preparation, handling, and direct home delivery of Cadillac electric vehicles in France and Germany.
- In July, 2025, IndoSpace launched its IndoSpace Chakan V industrial park, a 188-acre, $120 million development in Pune, India, designed to enhance logistics connectivity for manufacturing and logistics companies.
Dive into Technavio’s robust research methodology, blending expert interviews, extensive data synthesis, and validated models for unparalleled Automotive 3PL Market insights. See full methodology.
| Market Scope | |
|---|---|
| Page number | 290 |
| Base year | 2025 |
| Historic period | 2020-2024 |
| Forecast period | 2026-2030 |
| Growth momentum & CAGR | Accelerate at a CAGR of 6.8% |
| Market growth 2026-2030 | USD 114233.5 thousand |
| Market structure | Fragmented |
| YoY growth 2025-2026(%) | 6.0% |
| Key countries | US, Canada, Mexico, Germany, UK, France, Italy, Spain, The Netherlands, China, Japan, India, South Korea, Australia, Indonesia, Brazil, Argentina, Colombia, Saudi Arabia, UAE, South Africa, Israel and Turkey |
| Competitive landscape | Leading Companies, Market Positioning of Companies, Competitive Strategies, and Industry Risks |
Research Analyst Overview
- The market's evolution centers on integrating digital oversight with complex physical execution. Core services like inbound-to-manufacturing logistics, finished vehicle logistics, and aftermarket parts distribution now depend on a sophisticated technology stack. Boardroom decisions focus on adopting a unified logistics control tower that leverages predictive logistics analytics for superior supply chain orchestration, improving forecast accuracy by over 20%.
- The precision of just-in-time delivery and just-in-sequence delivery is augmented by AI-driven route optimization and real-time freight tracking. The EV transition places a premium on electric vehicle battery logistics, requiring certified hazardous materials handling and temperature-controlled warehousing. Operations are optimized through warehouse automation systems and autonomous mobile robots.
- Sustainability is addressed via green logistics solutions, circular economy logistics, and reverse logistics management, using intermodal freight transport. Global trade relies on seamless multimodal transportation management, cross-border logistics services, and expert customs brokerage services. Providers are differentiated by supply chain network design, use of transportation telematics data, and tools like blockchain in automotive logistics and the logistics digital twin.
- The portfolio includes roll-on/roll-off shipping, dedicated contract carriage, freight brokerage services, and fourth-party logistics (4PL) models.
What are the Key Data Covered in this Automotive 3PL Market Research and Growth Report?
-
What is the expected growth of the Automotive 3PL Market between 2026 and 2030?
-
USD 114.23 million, at a CAGR of 6.8%
-
-
What segmentation does the market report cover?
-
The report is segmented by Type (Finished vehicle, and Auto components), Service (Transportation, Warehousing, Distribution, Inventory management, and Others), Vehicle Type (Passenger cars, and Commercial vehicles) and Geography (North America, Europe, APAC, South America, Middle East and Africa)
-
-
Which regions are analyzed in the report?
-
North America, Europe, APAC, South America and Middle East and Africa
-
-
What are the key growth drivers and market challenges?
-
Growing vehicle production boosting logistics demand, High operational costs for logistics providers
-
-
Who are the major players in the Automotive 3PL Market?
-
Agility Public Warehousing Co., BLG Logistics, C H Robinson Worldwide Inc., CEVA Logistics SA, DHL International GmbH, DP World, DSV AS, Expeditors International Inc., FIEGE Logistik Stiftung and Co. KG, GEODIS, GXO Logistics Inc., Kuehne Nagel Management AG, Logwin AG, Nippon Express Holdings Inc., Penske Truck Leasing Co. L.P., Ryder System Inc., Schenker AG and TIBA
-
Market Research Insights
- The market is characterized by a strategic shift toward integrated third-party logistics services, driven by the need for enhanced automotive supply chain optimization. Firms that have adopted advanced automotive logistics technology report up to a 30% improvement in on-time delivery performance compared to those using legacy systems.
- The complexity of EV supply chain solutions and logistics for EV batteries has made specialized OEM logistics partnership models essential. This focus on automotive freight management and contract logistics for automotive has resulted in more resilient operations. Implementing comprehensive automotive supply chain visibility has been shown to reduce inventory holding costs by an average of 18%.
- The management of finished vehicle transport and automotive aftermarket logistics through a single lead logistics provider (LLP) is becoming a preferred strategy for achieving greater efficiency and control.
We can help! Our analysts can customize this automotive 3pl market research report to meet your requirements.
 RIA -
RIA - 
