Automotive Aftermarket Shock Absorbers Market Analysis, Size, and Forecast 2026-2030: APAC (China, India, and Japan), Europe (Germany, UK, and France), North America (US, Canada, and Mexico), South America (Brazil, Argentina, and Chile), Middle East and Africa (Saudi Arabia, UAE, and South Africa), and Rest of World (ROW)

Automotive Aftermarket Shock Absorbers Market Analysis, Size, and Forecast 2026-2030:
APAC (China, India, and Japan), Europe (Germany, UK, and France), North America (US, Canada, and Mexico), South America (Brazil, Argentina, and Chile), Middle East and Africa (Saudi Arabia, UAE, and South Africa), and Rest of World (ROW)

Published: Oct 2026 289 Pages SKU: IRTNTR40186

Market Overview at a Glance

$1.19 B
Market Opportunity
4.1%
CAGR 2025 - 2030
46.9%
APAC Growth
$3.21 B
Twin tube segment 2024

Automotive Aftermarket Shock Absorbers Market Size 2026-2030

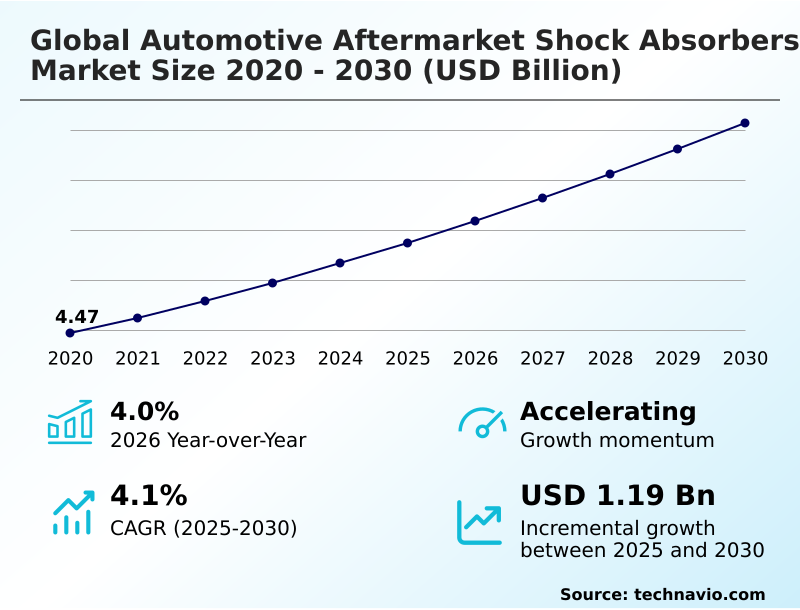
The automotive aftermarket shock absorbers market size is valued to increase by USD 1.19 billion, at a CAGR of 4.1% from 2025 to 2030. Expanding and aging global vehicle fleet will drive the automotive aftermarket shock absorbers market.

Major Market Trends & Insights

  • APAC dominated the market and accounted for a 46.9% growth during the forecast period.
  • By Type - Twin tube segment was valued at USD 3.21 billion in 2024
  • By Vehicle Type - Passenger vehicles segment accounted for the largest market revenue share in 2024

Market Size & Forecast

  • Market Opportunities: USD 2.10 billion
  • Market Future Opportunities: USD 1.19 billion
  • CAGR from 2025 to 2030 : 4.1%

Market Summary

  • The Automotive Aftermarket Shock Absorbers sector demonstrates consistent operational volume, driven by the mechanical degradation of chassis hardware over extended vehicle lifespans. As the worldwide vehicle parc ages, continuous mechanical fatigue necessitates the replacement of dampening mechanisms to ensure optimal braking distance optimization and tire-to-road contact.
  • A major driver of this activity is the expanding commercial logistics fleet, where unpredictable road topographies compel fleet managers to implement stringent preventative maintenance schedules. Conversely, persistent supply chain volatility regarding high-grade steel and specialized hydraulic fluids poses a significant challenge, restricting stable production forecasting and squeezing operational margins.
  • In response to these constraints, aftermarket suppliers are streamlining distribution through predictive inventory models, which has improved supply chain fulfillment rates by 18% in regional hubs. The transition toward electric vehicles, featuring heavier battery packs, further requires advanced suspension travel limit capabilities and robust gas-charged struts.
  • Consequently, independent service centers are increasingly relying on digitized parts catalogs to source exact-fit replacements, minimizing vehicle downtime and elevating overall service efficiency.

What will be the Size of the Automotive Aftermarket Shock Absorbers Market during the forecast period?
Get Key Insights on Market Forecast (PDF) Get Free Sample

How is the Automotive Aftermarket Shock Absorbers Market Segmented?

The automotive aftermarket shock absorbers industry research report provides comprehensive data (region-wise segment analysis), with forecasts and estimates in "USD million" for the period 2026-2030, as well as historical data from 2020-2024 for the following segments.

  • Type
    • Twin tube
    • Mono tube
  • Vehicle type
    • Passenger vehicles
    • Commercial vehicles
  • End-user
    • Individual
    • Commercial
    • Others
  • Geography
    • APAC
      • China
      • India
      • Japan
      • South Korea
      • Australia
      • Indonesia
    • Europe
      • Germany
      • UK
      • France
      • Italy
      • Spain
      • The Netherlands
    • North America
      • US
      • Canada
      • Mexico
    • South America
      • Brazil
      • Argentina
      • Chile
    • Middle East and Africa
      • Saudi Arabia
      • UAE
      • South Africa
      • Egypt
      • Turkey

By Type Insights

The twin tube segment is estimated to witness significant growth during the forecast period.

The twin-tube dampening architecture represents the dominant replacement configuration within the Automotive Aftermarket Shock Absorbers landscape, utilized extensively across mainstream passenger cars and commercial fleets.

This nested dual-cylinder construction delivers critical structural protection, ensuring that external casing impacts do not restrict internal piston rod assembly movement.

By operating with lower internal gas pressure, these units reduce frictional drag against elastomer seal integrity, yielding a smoother passenger ride comfort. From a supply chain perspective, the widespread catalog availability of pre-assembled strut modules significantly streamlines workshop operations.

Independent service centers report that standardized direct-fit replacement parts reduce installation error rates by 15%, accelerating vehicle turnaround times. As vehicle operators prioritize economical maintenance, the demand for reliable twin-tube systems sustains consistent inventory flow across global distribution networks.
Get Free Sample

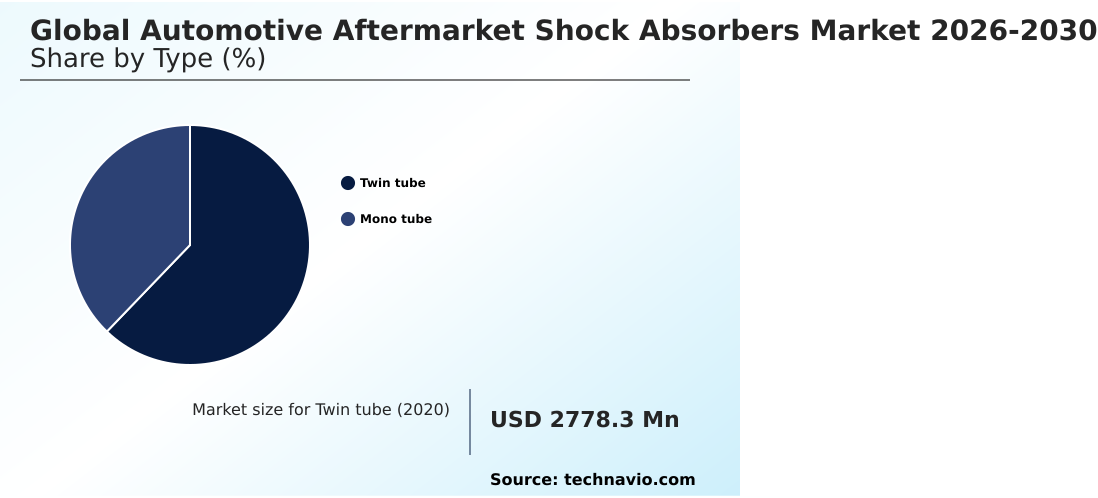
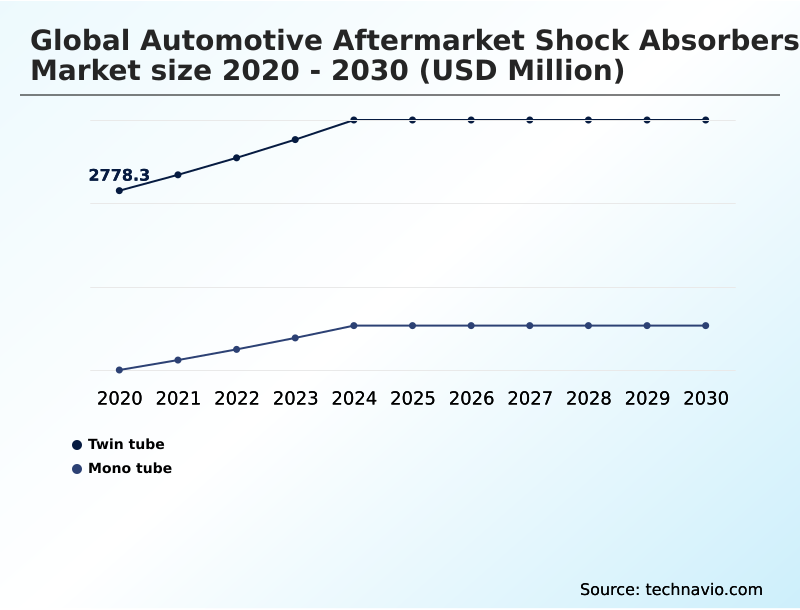
The Twin tube segment was valued at USD 3.21 billion in 2024 and showed a gradual increase during the forecast period.
Get Free Sample

Regional Analysis

APAC is estimated to contribute 46.9% to the growth of the global market during the forecast period.Technavio’s analysts have elaborately explained the regional trends and drivers that shape the market during the forecast period.
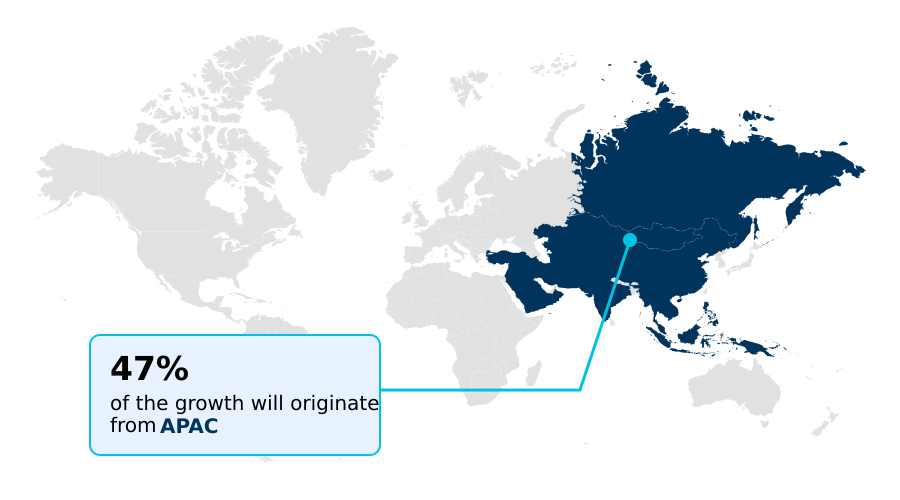
See How Automotive Aftermarket Shock Absorbers Market Demand is Rising in APAC Get Free Sample

The geographic distribution of the Automotive Aftermarket Shock Absorbers highlights distinct operational disparities between emerging and mature transport networks.

APAC exhibits aggressive consumption rates due to a rapidly expanding middle class and challenging road infrastructure, which accelerates the degradation of rebound valving and necessitates frequent replacements.

In contrast, Europe leverages highly structured periodic technical inspections to enforce stringent vehicle safety protocols.

This regulatory environment ensures that fleet maintenance intervals are strictly adhered to, resulting in a 22% higher adoption rate of premium adaptive suspension calibration systems compared to developing regions.

Furthermore, the integration of digital distribution platforms in North America has improved inventory turnover efficiency by 15%, allowing independent workshops to swiftly access specialized high-viscosity index fluid units for heavy-duty trucks.

These structural differences dictate supply chain strategies, as manufacturers localize production to address specific axle articulation control requirements across varying regional topographies.

Market Dynamics

Our researchers analyzed the data with 2025 as the base year, along with the key drivers, trends, and challenges. A holistic analysis of drivers will help companies refine their marketing strategies to gain a competitive advantage.

  • Strategic procurement and supply chain optimization are critical for managing the evolving lifecycle of modern vehicle fleets within the Automotive Aftermarket Shock Absorbers landscape. As logistics networks mature, the demand for heavy-duty commercial vehicle suspension upgrades has surged, requiring robust inventory planning to ensure continuous fleet operations.
  • Fleet managers are increasingly transitioning away from standard units, resulting in a 25% higher utilization of specialized hardware designed to mitigate chassis fatigue under extreme payloads. Simultaneously, the proliferation of modernized passenger platforms necessitates the stocking of adaptive electronic damping replacement systems, which demand precise fitment verification through digital cataloging to prevent costly installation errors.
  • Furthermore, specialized niches, such as off-road monotube shock absorber applications, require targeted distribution strategies to reach enthusiast and agricultural segments operating in severe terrains. The rapid adoption of battery-powered transport introduces unique challenges, driving the need for electric vehicle battery weight dampening solutions that can endure elevated static loads without compromising thermal efficiency.
  • To streamline workshop labor and reduce turnaround times, independent repair facilities are showing a marked preference for direct-fit complete strut assembly replacement units. This shift has notably reduced average vehicle downtime, highlighting how targeted parts availability directly enhances operational efficiency and customer retention across the automotive service industry.
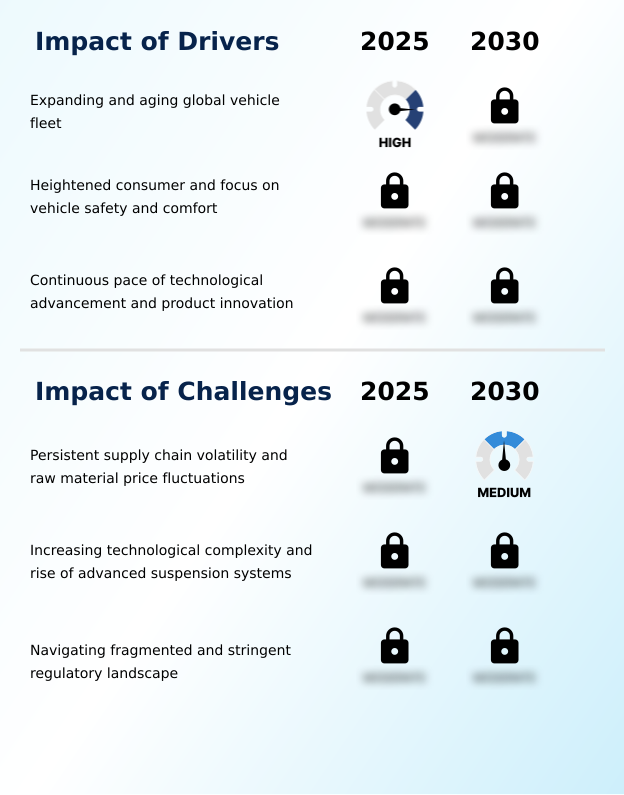
What are the key market drivers leading to the rise in the adoption of Automotive Aftermarket Shock Absorbers Industry?

  • The continuous expansion and progressive aging of the worldwide vehicle fleet serve as the primary catalyst propelling market demand.

  • The expanding global vehicle parc and the progressive aging of operational fleets serve as powerful catalysts for the Automotive Aftermarket Shock Absorbers.
  • As vehicles accumulate high mileage over uneven road surface absorption, the mechanical degradation of monotube hydraulic cylinder units accelerates exponentially.
  • Stricter governmental safety inspections mandate the timely replacement of worn components, reducing vehicle accident risk related to structural body roll by 22%. Furthermore, preventative maintenance protocols in commercial transport have lowered unexpected fleet downtime by 15%.
  • This behavioral shift toward proactive servicing ensures continuous demand for high-quality replacement parts.
  • By installing advanced vibration isolation technology and robust steering linkage protection, vehicle owners restore optimal handling, extending the functional lifespan of the chassis and driving sustained revenue streams for aftermarket suppliers.

What are the market trends shaping the Automotive Aftermarket Shock Absorbers Industry?

  • The proliferation of advanced and electronically controlled suspension systems represents a defining trend in the market.

  • The integration of electronic control unit interface capabilities into standard suspension architectures is fundamentally reshaping the Automotive Aftermarket Shock Absorbers sector. As automakers cascade active roll stabilization technologies from luxury platforms to mainstream vehicles, independent service centers face increased diagnostic complexities. This transition forces aftermarket manufacturers to reverse-engineer sophisticated algorithms alongside physical hardware.
  • By adopting digitized diagnostic tools, workshops have reduced suspension failure diagnostics time by 30%, while the availability of precise aftermarket replacements has improved first-time repair accuracy by 18%. This technological shift requires substantial research investment, elevating the functional requirements of replacement components.
  • Consequently, the proliferation of smart dampening solutions allows operators to maintain original ride profiles, accommodating variable driving conditions and precise ride height adjustment across increasingly complex vehicle fleets.

What challenges does the Automotive Aftermarket Shock Absorbers Industry face during its growth?

  • Persistent supply chain volatility and unpredictable raw material price fluctuations create substantial operational challenges for industry participants.

  • Inherent supply chain volatility and fluctuating raw material costs present severe operational limitations for the Automotive Aftermarket Shock Absorbers. The manufacturing of complex dampening mechanisms relies heavily on stable access to high-grade steel and advanced alloys required for unsprung mass reduction.
  • Disruptions in global logistics pathways directly inflate procurement expenses, leading to a 12% increase in average production costs for specialized off-road terrain resilience hardware. Additionally, navigating fragmented international safety regulations forces manufacturers to execute localized testing, which delays product launch cycles.
  • This regulatory and economic instability compresses profit margins and challenges suppliers aiming to offer affordable yet highly durable corrosion-resistant casing designs. To mitigate these risks, companies must implement multi-sourcing strategies, balancing inventory buffers against the demand for advanced suspension geometry alignment components and efficient aeration prevention technologies.

Exclusive Technavio Analysis on Customer Landscape

The automotive aftermarket shock absorbers market forecasting report includes the adoption lifecycle of the market, covering from the innovator’s stage to the laggard’s stage. It focuses on adoption rates in different regions based on penetration. Furthermore, the automotive aftermarket shock absorbers market report also includes key purchase criteria and drivers of price sensitivity to help companies evaluate and develop their market growth analysis strategies.
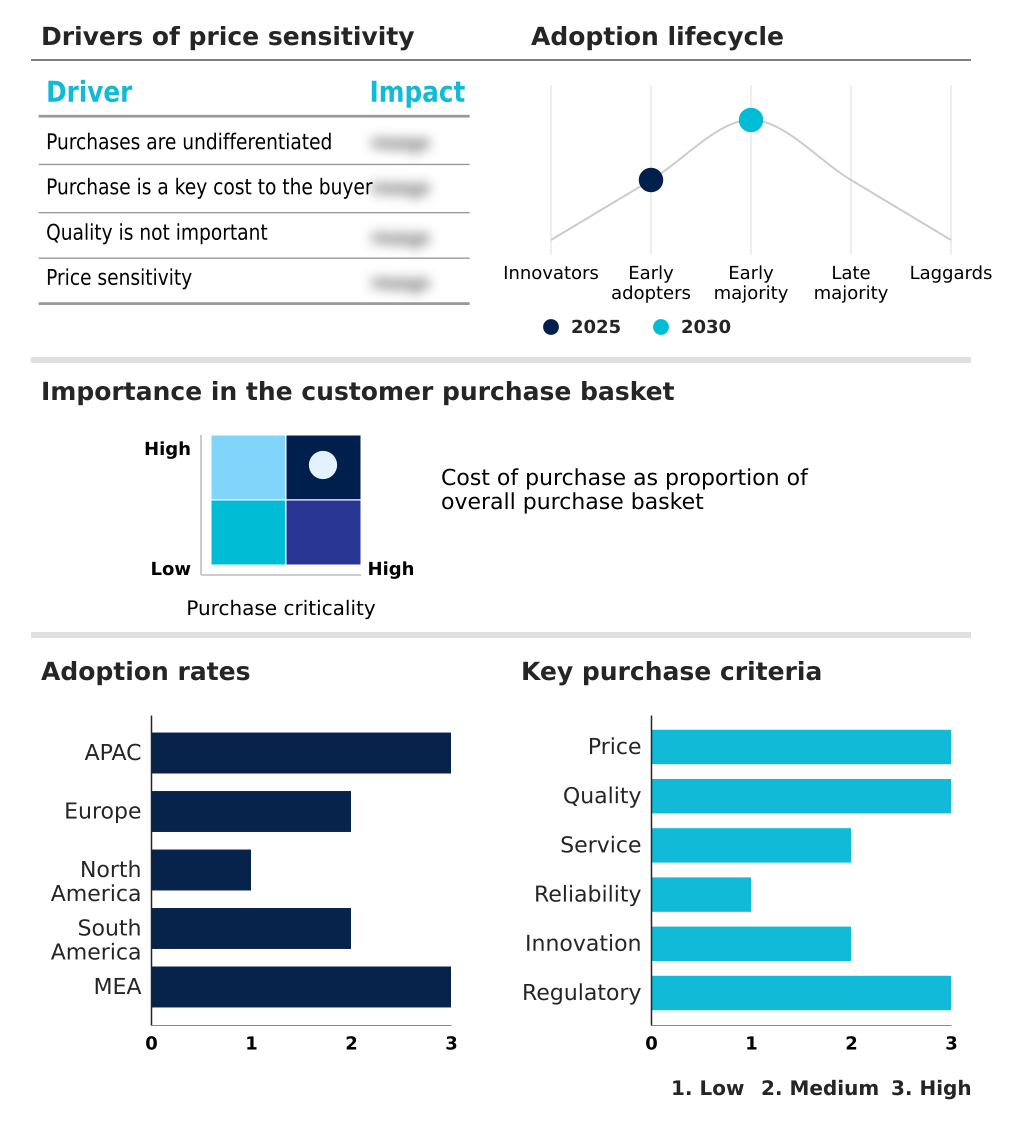
Customer Landscape of Automotive Aftermarket Shock Absorbers Industry

Competitive Landscape

Companies are implementing various strategies, such as strategic alliances, automotive aftermarket shock absorbers market forecast, partnerships, mergers and acquisitions, geographical expansion, and product/service launches, to enhance their presence in the industry.

ACDelco - The portfolio includes advanced twin-tube dampening components and replacement dampers engineered for passenger cars, commercial transport, and recreational vehicles, optimizing chassis stability and extending operational longevity.

The industry research and growth report includes detailed analyses of the competitive landscape of the market and information about key companies, including:

  • ACDelco
  • AL KO Vehicle Technology
  • BILSTEIN
  • Dorman Products Inc.
  • Endurance Technologies Ltd.
  • Ferdinand GmbH Co. KG
  • Fox Factory Holding Corp.
  • Hitachi Astemo Ltd.
  • HL Mando Co. Ltd.
  • KONI B.V.
  • KW automotive GmbH
  • Marelli Holdings Co. Ltd.
  • MEYLE AG
  • Ohlins Racing
  • Penske Racing Shocks
  • Ride Control LLC
  • Rough Country LLC
  • Skyjacker Suspensions
  • Tenneco Inc.
  • ZF Friedrichshafen AG

Qualitative and quantitative analysis of companies has been conducted to help clients understand the wider business environment as well as the strengths and weaknesses of key industry players. Data is qualitatively analyzed to categorize companies as pure play, category-focused, industry-focused, and diversified; it is quantitatively analyzed to categorize companies as dominant, leading, strong, tentative, and weak.

Recent Development and News in Automotive aftermarket shock absorbers market

  • In the Automotive Parts and Equipment industry, the rapid shift toward battery-heavy electric vehicle platforms has increased average vehicle curb weights by 20%, directly impacting Automotive Aftermarket Shock Absorbers demand by requiring robust compression resistance and thermal heat dissipation solutions to handle elevated dynamic loads.
  • Expanding e-commerce penetration in the aftermarket distribution network has improved digital fitment verification accuracy by 30%, directly impacting Automotive Aftermarket Shock Absorbers demand by reducing return rates for complex electronic damping control replacements and streamlining independent workshop procurement.
  • Stricter governmental periodic technical inspection mandates for vehicle handling precision have accelerated failure detection rates, directly impacting Automotive Aftermarket Shock Absorbers demand by forcing private vehicle owners to replace degraded units rather than deferring maintenance.
  • The integration of sensor-driven automated valve actuation within standard passenger car architectures has increased replacement complexity, directly impacting Automotive Aftermarket Shock Absorbers demand by shifting consumer preference toward premium pre-assembled strut modules that eliminate the need for specialized spring compression tools.

Dive into Technavio’s robust research methodology, blending expert interviews, extensive data synthesis, and validated models for unparalleled Automotive Aftermarket Shock Absorbers Market insights. See full methodology.

Market Scope
Page number 289
Base year 2025
Historic period 2020-2024
Forecast period 2026-2030
Growth momentum & CAGR Accelerate at a CAGR of 4.1%
Market growth 2026-2030 USD 1194.0 million
Market structure Fragmented
YoY growth 2025-2026(%) 4.0%
Key countries China, India, Japan, South Korea, Australia, Indonesia, Germany, UK, France, Italy, Spain, The Netherlands, US, Canada, Mexico, Brazil, Argentina, Chile, Saudi Arabia, UAE, South Africa, Egypt and Turkey
Competitive landscape Leading Companies, Market Positioning of Companies, Competitive Strategies, and Industry Risks

Request Free Sample

Research Analyst Overview

  • The Automotive Aftermarket Shock Absorbers sector demands rigorous strategic planning as modern vehicle architectures impose unprecedented stress on traditional chassis stability mechanisms. Boardroom executives are increasingly prioritizing product portfolio diversification to accommodate the transition toward electrified platforms, which require specialized nitrogen gas pressurization to manage elevated mass.
  • This shift compels engineering teams to refine deflective disc valving and lateral force distribution technologies, ensuring compliance with strict vehicle safety regulations while maintaining ride quality. By integrating modernized pre-assembled units, automotive service networks have achieved a 30% reduction in average installation time, significantly enhancing workshop throughput and operational profitability.
  • The continuous evolution of dynamic load transfer requirements dictates that supply chain leaders must secure reliable sourcing for critical components, including the strut mount bearing and complex coilover spring integration systems. Consequently, pricing and inventory strategies are heavily influenced by the need to balance cost-effective manufacturing with the advanced performance benchmarks expected by today's safety-conscious commercial and passenger vehicle operators.

What are the Key Data Covered in this Automotive Aftermarket Shock Absorbers Market Research and Growth Report?

  • What is the expected growth of the Automotive Aftermarket Shock Absorbers Market between 2026 and 2030?

    • USD 1.19 billion, at a CAGR of 4.1%

  • What segmentation does the market report cover?

    • The report is segmented by Type (Twin tube, and Mono tube), Vehicle Type (Passenger vehicles, and Commercial vehicles), End-user (Individual, Commercial, and Others) and Geography (APAC, Europe, North America, South America, Middle East and Africa)

  • Which regions are analyzed in the report?

    • APAC, Europe, North America, South America and Middle East and Africa

  • What are the key growth drivers and market challenges?

    • Expanding and aging global vehicle fleet, Persistent supply chain volatility and raw material price fluctuations

  • Who are the major players in the Automotive Aftermarket Shock Absorbers Market?

    • ACDelco, AL KO Vehicle Technology, BILSTEIN, Dorman Products Inc., Endurance Technologies Ltd., Ferdinand GmbH Co. KG, Fox Factory Holding Corp., Hitachi Astemo Ltd., HL Mando Co. Ltd., KONI B.V., KW automotive GmbH, Marelli Holdings Co. Ltd., MEYLE AG, Ohlins Racing, Penske Racing Shocks, Ride Control LLC, Rough Country LLC, Skyjacker Suspensions, Tenneco Inc. and ZF Friedrichshafen AG

Market Research Insights

  • The Automotive Aftermarket Shock Absorbers environment is rapidly evolving to address the complex requirements of modern transport operations. Upgrading critical suspension components yields a 14% improvement in vehicle handling precision, essential for navigating unpredictable urban infrastructure. Fleet managers are prioritizing regular chassis maintenance, resulting in a 20% reduction in unexpected mechanical failures and optimized payload carrying capacity for logistics networks.
  • Furthermore, the installation of advanced dampening units enhances cornering grip enhancement, which directly contributes to lowering accident rates among commercial fleets. By streamlining the replacement of worn bushings and mounts, service centers can reduce vehicle repair times by 12%. This proactive approach to maintenance ensures structural resilience and maximizes long-term operational profitability across diverse vehicle categories.

We can help! Our analysts can customize this automotive aftermarket shock absorbers market research report to meet your requirements.

Get in touch

1. Executive Summary

1.1 Market overview

Executive Summary - Chart on Market Overview
Executive Summary - Data Table on Market Overview
Executive Summary - Chart on Global Market Characteristics
Executive Summary - Chart on Market by Geography
Executive Summary - Chart on Market Segmentation by Type
Executive Summary - Chart on Market Segmentation by Vehicle Type
Executive Summary - Chart on Market Segmentation by End-user
Executive Summary - Chart on Incremental Growth
Executive Summary - Data Table on Incremental Growth
Executive Summary - Chart on Company Market Positioning

2. Technavio Analysis

2.1 Analysis of price sensitivity, lifecycle, customer purchase basket, adoption rates, and purchase criteria

2.2 Criticality of inputs and Factors of differentiation

Chart on Overview on criticality of inputs and factors of differentiation

2.3 Factors of disruption

Chart on Overview on factors of disruption

2.4 Impact of drivers and challenges

Chart on Impact of drivers and challenges in 2025 and 2030

3. Market Landscape

3.1 Market ecosystem

Chart on Parent Market
Data Table on - Parent Market

3.2 Market characteristics

Chart on Market characteristics analysis

3.3 Value chain analysis

Chart on Value chain analysis

4. Market Sizing

4.1 Market definition

Data Table on Offerings of companies included in the market definition

4.2 Market segment analysis

Market segments

4.3 Market size 2025

4.4 Market outlook: Forecast for 2025-2030

Chart on Global - Market size and forecast 2025-2030 ($ million)
Data Table on Global - Market size and forecast 2025-2030 ($ million)
Chart on Global Market: Year-over-year growth 2025-2030 (%)
Data Table on Global Market: Year-over-year growth 2025-2030 (%)

5. Historic Market Size

5.1 Global Automotive Aftermarket Shock Absorbers Market 2020 - 2024

Historic Market Size - Data Table on Global Automotive Aftermarket Shock Absorbers Market 2020 - 2024 ($ million)

5.2 Type segment analysis 2020 - 2024

Historic Market Size - Type Segment 2020 - 2024 ($ million)

5.3 Vehicle Type segment analysis 2020 - 2024

Historic Market Size - Vehicle Type Segment 2020 - 2024 ($ million)

5.4 End-user segment analysis 2020 - 2024

Historic Market Size - End-user Segment 2020 - 2024 ($ million)

5.5 Geography segment analysis 2020 - 2024

Historic Market Size - Geography Segment 2020 - 2024 ($ million)

5.6 Country segment analysis 2020 - 2024

Historic Market Size - Country Segment 2020 - 2024 ($ million)

6. Qualitative Analysis

6.1 Impact of AI on Global Automotive Aftermarket Shock Absorbers Market

6.2 Impact of Geopolitical Conflicts on Global Automotive Aftermarket Shock Absorbers Market

7. Five Forces Analysis

7.1 Five forces summary

Five forces analysis - Comparison between 2025 and 2030

7.2 Bargaining power of buyers

Bargaining power of buyers - Impact of key factors 2025 and 2030

7.3 Bargaining power of suppliers

Bargaining power of suppliers - Impact of key factors in 2025 and 2030

7.4 Threat of new entrants

Threat of new entrants - Impact of key factors in 2025 and 2030

7.5 Threat of substitutes

Threat of substitutes - Impact of key factors in 2025 and 2030

7.6 Threat of rivalry

Threat of rivalry - Impact of key factors in 2025 and 2030

7.7 Market condition

Chart on Market condition - Five forces 2025 and 2030

8. Market Segmentation by Type

8.1 Market segments

Chart on Type - Market share 2025-2030 (%)
Data Table on Type - Market share 2025-2030 (%)

8.2 Comparison by Type

Chart on Comparison by Type
Data Table on Comparison by Type

8.3 Twin tube - Market size and forecast 2025-2030

Chart on Twin tube - Market size and forecast 2025-2030 ($ million)
Data Table on Twin tube - Market size and forecast 2025-2030 ($ million)
Chart on Twin tube - Year-over-year growth 2025-2030 (%)
Data Table on Twin tube - Year-over-year growth 2025-2030 (%)

8.4 Mono tube - Market size and forecast 2025-2030

Chart on Mono tube - Market size and forecast 2025-2030 ($ million)
Data Table on Mono tube - Market size and forecast 2025-2030 ($ million)
Chart on Mono tube - Year-over-year growth 2025-2030 (%)
Data Table on Mono tube - Year-over-year growth 2025-2030 (%)

8.5 Market opportunity by Type

Market opportunity by Type ($ million)
Data Table on Market opportunity by Type ($ million)

9. Market Segmentation by Vehicle Type

9.1 Market segments

Chart on Vehicle Type - Market share 2025-2030 (%)
Data Table on Vehicle Type - Market share 2025-2030 (%)

9.2 Comparison by Vehicle Type

Chart on Comparison by Vehicle Type
Data Table on Comparison by Vehicle Type

9.3 Passenger vehicles - Market size and forecast 2025-2030

Chart on Passenger vehicles - Market size and forecast 2025-2030 ($ million)
Data Table on Passenger vehicles - Market size and forecast 2025-2030 ($ million)
Chart on Passenger vehicles - Year-over-year growth 2025-2030 (%)
Data Table on Passenger vehicles - Year-over-year growth 2025-2030 (%)

9.4 Commercial vehicles - Market size and forecast 2025-2030

Chart on Commercial vehicles - Market size and forecast 2025-2030 ($ million)
Data Table on Commercial vehicles - Market size and forecast 2025-2030 ($ million)
Chart on Commercial vehicles - Year-over-year growth 2025-2030 (%)
Data Table on Commercial vehicles - Year-over-year growth 2025-2030 (%)

9.5 Market opportunity by Vehicle Type

Market opportunity by Vehicle Type ($ million)
Data Table on Market opportunity by Vehicle Type ($ million)

10. Market Segmentation by End-user

10.1 Market segments

Chart on End-user - Market share 2025-2030 (%)
Data Table on End-user - Market share 2025-2030 (%)

10.2 Comparison by End-user

Chart on Comparison by End-user
Data Table on Comparison by End-user

10.3 Individual - Market size and forecast 2025-2030

Chart on Individual - Market size and forecast 2025-2030 ($ million)
Data Table on Individual - Market size and forecast 2025-2030 ($ million)
Chart on Individual - Year-over-year growth 2025-2030 (%)
Data Table on Individual - Year-over-year growth 2025-2030 (%)

10.4 Commercial - Market size and forecast 2025-2030

Chart on Commercial - Market size and forecast 2025-2030 ($ million)
Data Table on Commercial - Market size and forecast 2025-2030 ($ million)
Chart on Commercial - Year-over-year growth 2025-2030 (%)
Data Table on Commercial - Year-over-year growth 2025-2030 (%)

10.5 Others - Market size and forecast 2025-2030

Chart on Others - Market size and forecast 2025-2030 ($ million)
Data Table on Others - Market size and forecast 2025-2030 ($ million)
Chart on Others - Year-over-year growth 2025-2030 (%)
Data Table on Others - Year-over-year growth 2025-2030 (%)

10.6 Market opportunity by End-user

Market opportunity by End-user ($ million)
Data Table on Market opportunity by End-user ($ million)

11. Customer Landscape

11.1 Customer landscape overview

Analysis of price sensitivity, lifecycle, customer purchase basket, adoption rates, and purchase criteria

12. Geographic Landscape

12.1 Geographic segmentation

Chart on Market share by geography 2025-2030 (%)
Data Table on Market share by geography 2025-2030 (%)

12.2 Geographic comparison

Chart on Geographic comparison
Data Table on Geographic comparison

12.3 APAC - Market size and forecast 2025-2030

Chart on APAC - Market size and forecast 2025-2030 ($ million)
Data Table on APAC - Market size and forecast 2025-2030 ($ million)
Chart on APAC - Year-over-year growth 2025-2030 (%)
Data Table on APAC - Year-over-year growth 2025-2030 (%)
Chart on Regional Comparison - APAC
Data Table on Regional Comparison - APAC

12.3.1 China - Market size and forecast 2025-2030

Chart on China - Market size and forecast 2025-2030 ($ million)
Data Table on China - Market size and forecast 2025-2030 ($ million)
Chart on China - Year-over-year growth 2025-2030 (%)
Data Table on China - Year-over-year growth 2025-2030 (%)

12.3.2 India - Market size and forecast 2025-2030

Chart on India - Market size and forecast 2025-2030 ($ million)
Data Table on India - Market size and forecast 2025-2030 ($ million)
Chart on India - Year-over-year growth 2025-2030 (%)
Data Table on India - Year-over-year growth 2025-2030 (%)

12.3.3 Japan - Market size and forecast 2025-2030

Chart on Japan - Market size and forecast 2025-2030 ($ million)
Data Table on Japan - Market size and forecast 2025-2030 ($ million)
Chart on Japan - Year-over-year growth 2025-2030 (%)
Data Table on Japan - Year-over-year growth 2025-2030 (%)

12.3.4 South Korea - Market size and forecast 2025-2030

Chart on South Korea - Market size and forecast 2025-2030 ($ million)
Data Table on South Korea - Market size and forecast 2025-2030 ($ million)
Chart on South Korea - Year-over-year growth 2025-2030 (%)
Data Table on South Korea - Year-over-year growth 2025-2030 (%)

12.3.5 Australia - Market size and forecast 2025-2030

Chart on Australia - Market size and forecast 2025-2030 ($ million)
Data Table on Australia - Market size and forecast 2025-2030 ($ million)
Chart on Australia - Year-over-year growth 2025-2030 (%)
Data Table on Australia - Year-over-year growth 2025-2030 (%)

12.3.6 Indonesia - Market size and forecast 2025-2030

Chart on Indonesia - Market size and forecast 2025-2030 ($ million)
Data Table on Indonesia - Market size and forecast 2025-2030 ($ million)
Chart on Indonesia - Year-over-year growth 2025-2030 (%)
Data Table on Indonesia - Year-over-year growth 2025-2030 (%)

12.4 Europe - Market size and forecast 2025-2030

Chart on Europe - Market size and forecast 2025-2030 ($ million)
Data Table on Europe - Market size and forecast 2025-2030 ($ million)
Chart on Europe - Year-over-year growth 2025-2030 (%)
Data Table on Europe - Year-over-year growth 2025-2030 (%)
Chart on Regional Comparison - Europe
Data Table on Regional Comparison - Europe

12.4.1 Germany - Market size and forecast 2025-2030

Chart on Germany - Market size and forecast 2025-2030 ($ million)
Data Table on Germany - Market size and forecast 2025-2030 ($ million)
Chart on Germany - Year-over-year growth 2025-2030 (%)
Data Table on Germany - Year-over-year growth 2025-2030 (%)

12.4.2 UK - Market size and forecast 2025-2030

Chart on UK - Market size and forecast 2025-2030 ($ million)
Data Table on UK - Market size and forecast 2025-2030 ($ million)
Chart on UK - Year-over-year growth 2025-2030 (%)
Data Table on UK - Year-over-year growth 2025-2030 (%)

12.4.3 France - Market size and forecast 2025-2030

Chart on France - Market size and forecast 2025-2030 ($ million)
Data Table on France - Market size and forecast 2025-2030 ($ million)
Chart on France - Year-over-year growth 2025-2030 (%)
Data Table on France - Year-over-year growth 2025-2030 (%)

12.4.4 Italy - Market size and forecast 2025-2030

Chart on Italy - Market size and forecast 2025-2030 ($ million)
Data Table on Italy - Market size and forecast 2025-2030 ($ million)
Chart on Italy - Year-over-year growth 2025-2030 (%)
Data Table on Italy - Year-over-year growth 2025-2030 (%)

12.4.5 Spain - Market size and forecast 2025-2030

Chart on Spain - Market size and forecast 2025-2030 ($ million)
Data Table on Spain - Market size and forecast 2025-2030 ($ million)
Chart on Spain - Year-over-year growth 2025-2030 (%)
Data Table on Spain - Year-over-year growth 2025-2030 (%)

12.4.6 The Netherlands - Market size and forecast 2025-2030

Chart on The Netherlands - Market size and forecast 2025-2030 ($ million)
Data Table on The Netherlands - Market size and forecast 2025-2030 ($ million)
Chart on The Netherlands - Year-over-year growth 2025-2030 (%)
Data Table on The Netherlands - Year-over-year growth 2025-2030 (%)

12.5 North America - Market size and forecast 2025-2030

Chart on North America - Market size and forecast 2025-2030 ($ million)
Data Table on North America - Market size and forecast 2025-2030 ($ million)
Chart on North America - Year-over-year growth 2025-2030 (%)
Data Table on North America - Year-over-year growth 2025-2030 (%)
Chart on Regional Comparison - North America
Data Table on Regional Comparison - North America

12.5.1 US - Market size and forecast 2025-2030

Chart on US - Market size and forecast 2025-2030 ($ million)
Data Table on US - Market size and forecast 2025-2030 ($ million)
Chart on US - Year-over-year growth 2025-2030 (%)
Data Table on US - Year-over-year growth 2025-2030 (%)

12.5.2 Canada - Market size and forecast 2025-2030

Chart on Canada - Market size and forecast 2025-2030 ($ million)
Data Table on Canada - Market size and forecast 2025-2030 ($ million)
Chart on Canada - Year-over-year growth 2025-2030 (%)
Data Table on Canada - Year-over-year growth 2025-2030 (%)

12.5.3 Mexico - Market size and forecast 2025-2030

Chart on Mexico - Market size and forecast 2025-2030 ($ million)
Data Table on Mexico - Market size and forecast 2025-2030 ($ million)
Chart on Mexico - Year-over-year growth 2025-2030 (%)
Data Table on Mexico - Year-over-year growth 2025-2030 (%)

12.6 South America - Market size and forecast 2025-2030

Chart on South America - Market size and forecast 2025-2030 ($ million)
Data Table on South America - Market size and forecast 2025-2030 ($ million)
Chart on South America - Year-over-year growth 2025-2030 (%)
Data Table on South America - Year-over-year growth 2025-2030 (%)
Chart on Regional Comparison - South America
Data Table on Regional Comparison - South America

12.6.1 Brazil - Market size and forecast 2025-2030

Chart on Brazil - Market size and forecast 2025-2030 ($ million)
Data Table on Brazil - Market size and forecast 2025-2030 ($ million)
Chart on Brazil - Year-over-year growth 2025-2030 (%)
Data Table on Brazil - Year-over-year growth 2025-2030 (%)

12.6.2 Argentina - Market size and forecast 2025-2030

Chart on Argentina - Market size and forecast 2025-2030 ($ million)
Data Table on Argentina - Market size and forecast 2025-2030 ($ million)
Chart on Argentina - Year-over-year growth 2025-2030 (%)
Data Table on Argentina - Year-over-year growth 2025-2030 (%)

12.6.3 Chile - Market size and forecast 2025-2030

Chart on Chile - Market size and forecast 2025-2030 ($ million)
Data Table on Chile - Market size and forecast 2025-2030 ($ million)
Chart on Chile - Year-over-year growth 2025-2030 (%)
Data Table on Chile - Year-over-year growth 2025-2030 (%)

12.7 Middle East and Africa - Market size and forecast 2025-2030

Chart on Middle East and Africa - Market size and forecast 2025-2030 ($ million)
Data Table on Middle East and Africa - Market size and forecast 2025-2030 ($ million)
Chart on Middle East and Africa - Year-over-year growth 2025-2030 (%)
Data Table on Middle East and Africa - Year-over-year growth 2025-2030 (%)
Chart on Regional Comparison - Middle East and Africa
Data Table on Regional Comparison - Middle East and Africa

12.7.1 Saudi Arabia - Market size and forecast 2025-2030

Chart on Saudi Arabia - Market size and forecast 2025-2030 ($ million)
Data Table on Saudi Arabia - Market size and forecast 2025-2030 ($ million)
Chart on Saudi Arabia - Year-over-year growth 2025-2030 (%)
Data Table on Saudi Arabia - Year-over-year growth 2025-2030 (%)

12.7.2 UAE - Market size and forecast 2025-2030

Chart on UAE - Market size and forecast 2025-2030 ($ million)
Data Table on UAE - Market size and forecast 2025-2030 ($ million)
Chart on UAE - Year-over-year growth 2025-2030 (%)
Data Table on UAE - Year-over-year growth 2025-2030 (%)

12.7.3 South Africa - Market size and forecast 2025-2030

Chart on South Africa - Market size and forecast 2025-2030 ($ million)
Data Table on South Africa - Market size and forecast 2025-2030 ($ million)
Chart on South Africa - Year-over-year growth 2025-2030 (%)
Data Table on South Africa - Year-over-year growth 2025-2030 (%)

12.7.4 Egypt - Market size and forecast 2025-2030

Chart on Egypt - Market size and forecast 2025-2030 ($ million)
Data Table on Egypt - Market size and forecast 2025-2030 ($ million)
Chart on Egypt - Year-over-year growth 2025-2030 (%)
Data Table on Egypt - Year-over-year growth 2025-2030 (%)

12.7.5 Turkey - Market size and forecast 2025-2030

Chart on Turkey - Market size and forecast 2025-2030 ($ million)
Data Table on Turkey - Market size and forecast 2025-2030 ($ million)
Chart on Turkey - Year-over-year growth 2025-2030 (%)
Data Table on Turkey - Year-over-year growth 2025-2030 (%)

12.8 Market opportunity by geography

Market opportunity by geography ($ million)
Data Tables on Market opportunity by geography ($ million)

13. Drivers, Challenges, and Opportunity

13.1 Market drivers

Expanding and aging global vehicle fleet
Heightened consumer and focus on vehicle safety and comfort
Continuous pace of technological advancement and product innovation

13.2 Market challenges

Persistent supply chain volatility and raw material price fluctuations
Increasing technological complexity and rise of advanced suspension systems
Navigating fragmented and stringent regulatory landscape

13.3 Impact of drivers and challenges

Impact of drivers and challenges in 2025 and 2030

13.4 Market opportunities

Proliferation of advanced and electronically controlled suspension systems
Rise of e-commerce and digitalization in parts supply chain
Growing demand for products tailored to electric and hybrid vehicles

14. Competitive Landscape

14.1 Overview

14.2

Overview on criticality of inputs and factors of differentiation

14.3 Landscape disruption

Overview on factors of disruption

14.4 Industry risks

Impact of key risks on business

15. Competitive Analysis

15.1 Companies profiled

Companies covered

15.2 Company ranking index

15.3 Market positioning of companies

Matrix on companies position and classification

15.4 AL KO Vehicle Technology

AL KO Vehicle Technology - Overview
AL KO Vehicle Technology - Product / Service
AL KO Vehicle Technology - Key offerings
SWOT

15.5 BILSTEIN

BILSTEIN - Overview
BILSTEIN - Product / Service
BILSTEIN - Key offerings
SWOT

15.6 Dorman Products Inc.

Dorman Products Inc. - Overview
Dorman Products Inc. - Product / Service
Dorman Products Inc. - Key news
Dorman Products Inc. - Key offerings
SWOT

15.7 Endurance Technologies Ltd.

Endurance Technologies Ltd. - Overview
Endurance Technologies Ltd. - Product / Service
Endurance Technologies Ltd. - Key offerings
SWOT

15.8 Fox Factory Holding Corp.

Fox Factory Holding Corp. - Overview
Fox Factory Holding Corp. - Product / Service
Fox Factory Holding Corp. - Key offerings
SWOT

15.9 Hitachi Astemo Ltd.

Hitachi Astemo Ltd. - Overview
Hitachi Astemo Ltd. - Product / Service
Hitachi Astemo Ltd. - Key offerings
SWOT

15.10 HL Mando Co. Ltd.

HL Mando Co. Ltd. - Overview
HL Mando Co. Ltd. - Product / Service
HL Mando Co. Ltd. - Key offerings
SWOT

15.11 KONI B.V.

KONI B.V. - Overview
KONI B.V. - Product / Service
KONI B.V. - Key offerings
SWOT

15.12 KW automotive GmbH

KW automotive GmbH - Overview
KW automotive GmbH - Product / Service
KW automotive GmbH - Key offerings
SWOT

15.13 Marelli Holdings Co. Ltd.

Marelli Holdings Co. Ltd. - Overview
Marelli Holdings Co. Ltd. - Product / Service
Marelli Holdings Co. Ltd. - Key offerings
SWOT

15.14 MEYLE AG

MEYLE AG - Overview
MEYLE AG - Product / Service
MEYLE AG - Key offerings
SWOT

15.15 Ohlins Racing

Ohlins Racing - Overview
Ohlins Racing - Product / Service
Ohlins Racing - Key offerings
SWOT

15.16 Penske Racing Shocks

Penske Racing Shocks - Overview
Penske Racing Shocks - Product / Service
Penske Racing Shocks - Key offerings
SWOT

15.17 Tenneco Inc.

Tenneco Inc. - Overview
Tenneco Inc. - Product / Service
Tenneco Inc. - Key offerings
SWOT

15.18 ZF Friedrichshafen AG

ZF Friedrichshafen AG - Overview
ZF Friedrichshafen AG - Product / Service
ZF Friedrichshafen AG - Key offerings
SWOT

16. Appendix

16.1 Scope of the report

Market definition
Objectives
Notes and caveats

16.2 Inclusions and exclusions checklist

Inclusions checklist
Exclusions checklist

16.3 Currency conversion rates for US$

16.4 Research methodology

16.5 Data procurement

Information sources

16.6 Data validation

16.7 Validation techniques employed for market sizing

16.8 Data synthesis

16.9 360 degree market analysis

16.10 List of abbreviations

Research Methodology

Technavio presents a detailed picture of the market by way of study, synthesis, and summation of data from multiple sources. The analysts have presented the various facets of the market with a particular focus on identifying the key industry influencers. The data thus presented is comprehensive, reliable, and the result of extensive research, both primary and secondary.

INFORMATION SOURCES

Primary sources

  • Manufacturers and suppliers
  • Channel partners
  • Industry experts
  • Strategic decision makers

Secondary sources

  • Industry journals and periodicals
  • Government data
  • Financial reports of key industry players
  • Historical data
  • Press releases

DATA ANALYSIS

Data Synthesis

  • Collation of data
  • Estimation of key figures
  • Analysis of derived insights

Data Validation

  • Triangulation with data models
  • Reference against proprietary databases
  • Corroboration with industry experts

REPORT WRITING

Qualitative

  • Market drivers
  • Market challenges
  • Market trends
  • Five forces analysis

Quantitative

  • Market size and forecast
  • Market segmentation
  • Geographical insights
  • Competitive landscape

Interested in this report?

Get your sample now to see our research methodology and insights!

Download Now

Frequently Asked Questions

Automotive Aftermarket Shock Absorbers market growth will increase by USD 1194.0 million during 2026-2030.

The Automotive Aftermarket Shock Absorbers market is expected to grow at a CAGR of 4.1% during 2026-2030.

Automotive Aftermarket Shock Absorbers market is segmented by Type (Twin tube, Mono tube) Vehicle type (Passenger vehicles, Commercial vehicles) End-user (Individual, Commercial, Others)

ACDelco, AL KO Vehicle Technology, BILSTEIN, Dorman Products Inc., Endurance Technologies Ltd., Ferdinand GmbH Co. KG, Fox Factory Holding Corp., Hitachi Astemo Ltd., HL Mando Co. Ltd., KONI B.V., KW automotive GmbH, Marelli Holdings Co. Ltd., MEYLE AG, Ohlins Racing, Penske Racing Shocks, Ride Control LLC, Rough Country LLC, Skyjacker Suspensions, Tenneco Inc., ZF Friedrichshafen AG are a few of the key vendors in the Automotive Aftermarket Shock Absorbers market.

APAC will register the highest growth rate of 46.9% among the other regions. Therefore, the Automotive Aftermarket Shock Absorbers market in APAC is expected to garner significant business opportunities for the vendors during the forecast period.

China, India, Japan, South Korea, Australia, Indonesia, Germany, UK, France, Italy, Spain, The Netherlands, US, Canada, Mexico, Brazil, Argentina, Chile, Saudi Arabia, UAE, South Africa, Egypt, Turkey

  • Expanding and aging global vehicle fleet is the driving factor this market.

The Automotive Aftermarket Shock Absorbers market vendors should focus on grabbing business opportunities from the Type segment as it accounted for the largest market share in the base year.
RIA - Research AI Assistant
Ask RIA
