Automotive Clutch Release Bearing Market Size 2025-2029
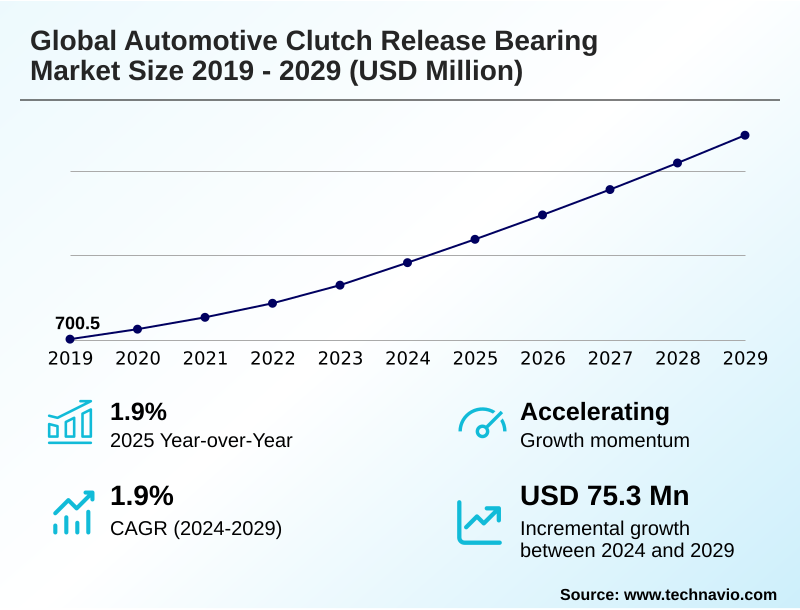
The automotive clutch release bearing market size is valued to increase by USD 75.3 million, at a CAGR of 1.9% from 2024 to 2029. Resilient demand in emerging economies and niche performance segments will drive the automotive clutch release bearing market.
Major Market Trends & Insights
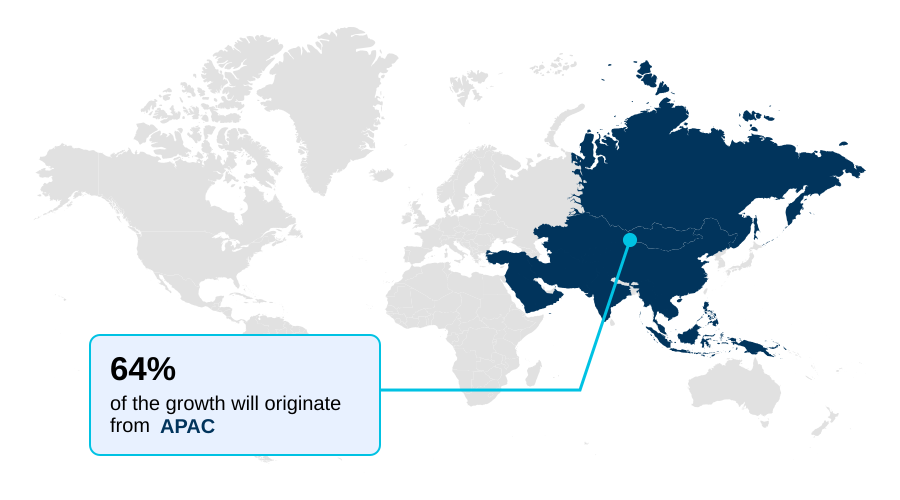
- APAC dominated the market and accounted for a 64.3% growth during the forecast period.
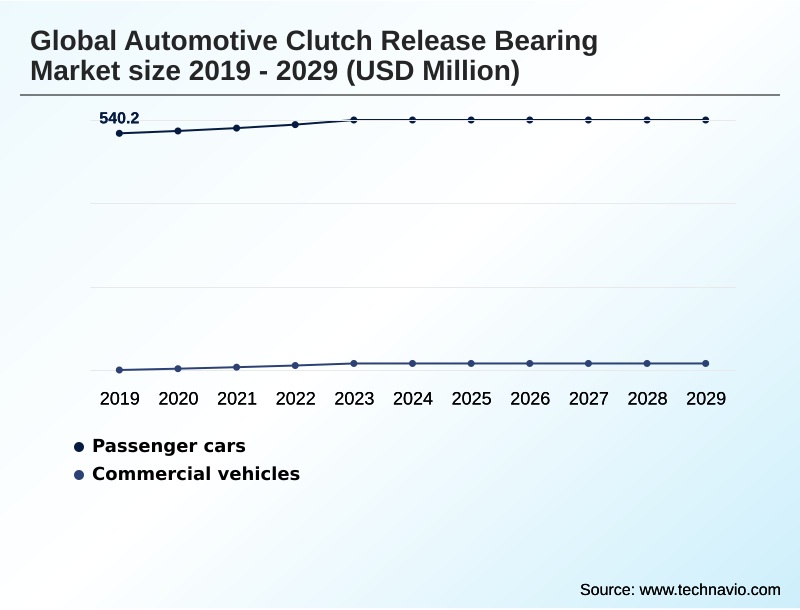
- By Application - Passenger cars segment was valued at USD 561.6 million in 2023
- By Type - Pushing-type segment accounted for the largest market revenue share in 2023
Market Size & Forecast
- Market Opportunities: USD 120.5 million
- Market Future Opportunities: USD 75.3 million
- CAGR from 2024 to 2029 : 1.9%
Market Summary
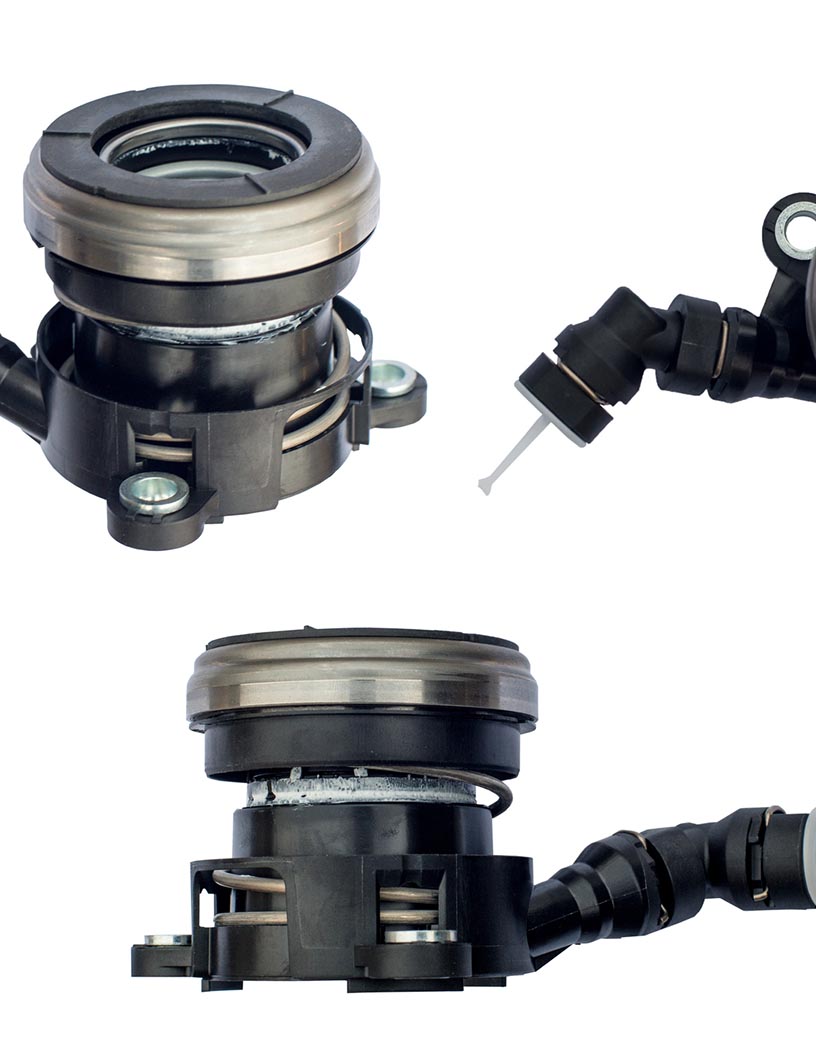
- The automotive clutch release bearing market exists at a critical juncture, defined by the interplay between legacy powertrain technology and the industry's shift toward electrification. This component, integral to manual transmission components, faces a long-term decline in OEM demand from developed regions.
- However, its relevance is sustained by a vast global vehicle parc requiring aftermarket replacement parts and continued demand from emerging economies where manual transmissions remain dominant. A key business scenario involves optimizing the OEM supply chain for a component with a bifurcated future.
- Manufacturers must manage production lines for high-volume, cost-sensitive parts for markets with strong ICE powertrain technology while simultaneously investing in precision manufacturing for high-margin, specialized bearings for hybrid vehicle transmissions and performance vehicles.
- This dual strategy requires sophisticated demand forecasting to balance inventory costs against the risk of stock obsolescence, ensuring profitability in a market characterized by powertrain technology evolution and significant regional divergence. This balancing act is crucial for navigating the transition and capitalizing on the enduring, multi-decade aftermarket opportunity.
What will be the Size of the Automotive Clutch Release Bearing Market during the forecast period?
Get Key Insights on Market Forecast (PDF) Get Free Sample
How is the Automotive Clutch Release Bearing Market Segmented?
The automotive clutch release bearing industry research report provides comprehensive data (region-wise segment analysis), with forecasts and estimates in "USD million" for the period 2025-2029, as well as historical data from 2019-2023 for the following segments.
- Application
- Passenger cars
- Commercial vehicles
- Type
- Pushing-type
- Pull-type
- Material
- Steel
- Aluminium
- Plastics or composites
- Geography
- APAC
- China
- Japan
- India
- Europe
- Germany
- UK
- France
- North America
- US
- Canada
- Mexico
- South America
- Brazil
- Argentina
- Colombia
- Middle East and Africa
- Turkey
- Saudi Arabia
- South Africa
- Rest of World (ROW)
- APAC
By Application Insights
The passenger cars segment is estimated to witness significant growth during the forecast period.
The passenger car segment is undergoing a divergent transformation. In mature markets, demand for new clutch actuation system components is declining due to a preference for automatics.
However, a robust OEM supply chain persists in developing regions where cost and control favor manual systems. Here, the push-type bearing remains standard. The high-performance clutch niche also sustains demand, focusing on improved clutch pedal feel and drivability enhancement.
Innovation centers on lightweight polymer composites for the bearing housing and advanced concentric slave cylinder designs, with component durability testing showing a 15% reduction in wear under simulated aggressive driving conditions.
This focus on powertrain lightweighting and lower clutch system NVH ensures relevance in both enthusiast vehicles and the vast market for aftermarket replacement parts.
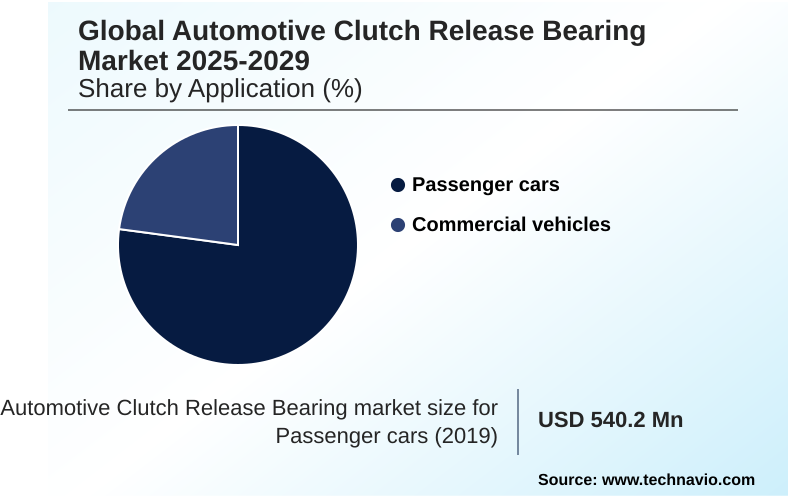
The Passenger cars segment was valued at USD 561.6 million in 2023 and showed a gradual increase during the forecast period.
Regional Analysis
APAC is estimated to contribute 64.3% to the growth of the global market during the forecast period.Technavio’s analysts have elaborately explained the regional trends and drivers that shape the market during the forecast period.
See How Automotive Clutch Release Bearing Market Demand is Rising in APAC Get Free Sample
The geographic landscape is highly polarized. APAC, driven by cost-conscious markets, represents the largest demand hub, accounting for over 35% of the global vehicle parc that relies on manual transmissions.
In this region, vehicle parc analysis shows a focus on powertrain system integration with durable driveline components. In contrast, North America and Europe are rapidly shifting toward alternatives, though their large existing fleets sustain a robust aftermarket.
Precision manufacturing of driveline components like the flywheel and axle components is critical for global competition. Advanced bearing cage material and rolling elements are used to improve powertrain efficiency.
Suppliers achieve a 10% improvement in clutch engagement smoothness by optimizing the interface between the diaphragm spring and the clutch engagement point.
Market Dynamics
Our researchers analyzed the data with 2024 as the base year, along with the key drivers, trends, and challenges. A holistic analysis of drivers will help companies refine their marketing strategies to gain a competitive advantage.
- Navigating the aftermarket requires a deep understanding of component failure and maintenance. Consumers often search for symptoms of a bad clutch release bearing, such as clutch release bearing noise on engagement or clutch pedal vibration at high rpm, before seeking repairs.
- The choice between push-type vs pull-type clutch differences is typically an OEM decision, but in the performance sector, understanding the high-performance hydraulic release bearing cost is crucial for upgrades. For modern vehicles, diagnosing dual-clutch transmission bearing failure or issues with an integrated clutch bearing and slave cylinder requires specialized knowledge.
- Technicians often need to know how to replace a concentric slave cylinder and the specific manual transmission bearing lubrication requirements. Questions about sealed-for-life release bearing lifespan and clutch judder and release bearing issues are common. The impact of bearing wear on clutch disengagement directly affects vehicle safety and performance.
- Many enthusiasts consider upgrading stock clutch release bearing for better durability, especially when installing performance clutches. Understanding clutch bearing for automated manual transmission compatibility and the quality of an aftermarket clutch kit with release bearing is vital for repair shops.
- Access to reliable remactured clutch release bearing quality data can reduce part replacement costs by over 30% compared to new OEM parts, directly influencing operational planning for fleet maintenance.
What are the key market drivers leading to the rise in the adoption of Automotive Clutch Release Bearing Industry?
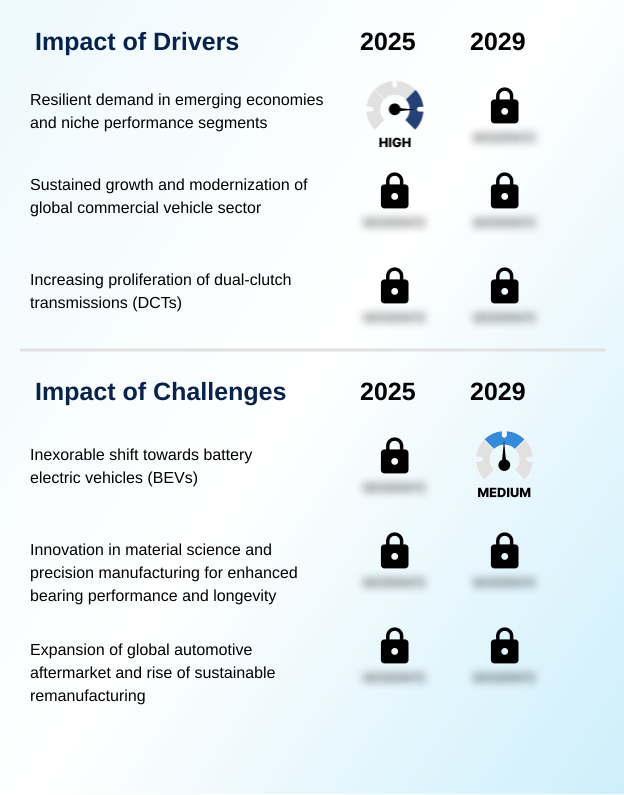
- Market growth is sustained by resilient demand from cost-sensitive emerging economies and the enthusiast-driven performance vehicle niche in developed regions.
- Key market drivers are rooted in resilient legacy sectors and technological adaptation.
- The commercial vehicle drivetrain remains a significant source of demand, with heavy-duty truck clutch parts like the pull-type bearing prized for reliability and low total cost of ownership (TCO).
- These manual gearbox components, including the clutch fork and other drivetrain components, offer superior drivability enhancement for heavy-load management. Furthermore, the increasing proliferation of hybrid vehicle transmissions and DCTs creates new demand streams for advanced, high-torque handling capacity bearings.
- Component standardization allows suppliers to serve multiple platforms, improving economies of scale by up to 20%. The development of self-aligning bearings has improved drivetrain efficiency, reducing installation errors by 30% and extending the service life of driveline components.
What are the market trends shaping the Automotive Clutch Release Bearing Industry?
- The market is undergoing a fundamental transformation driven by the inexorable shift toward vehicle electrification. This trend has a decisive and long-term impact on the demand for traditional manual powertrain components.
- Market trends are defined by a dual-track evolution. The primary trend is the vehicle electrification impact, which threatens the long-term viability of all ICE powertrain components. Simultaneously, innovation in existing transmission technology evolution continues.
- For instance, the latest sealed-for-life bearing units for dual-clutch transmission (DCT) and automated manual transmission (AMT) systems feature advanced bearing race materials that achieve a 10% reduction in friction at the transmission input shaft. This focus on parasitic loss reduction is critical.
- The automotive aftermarket ecosystem is also shifting, with a growing remanufacturing process that extends component life, aligning with circular economy in automotive principles. Remanufactured units for improving gearbox synchronization can retain up to 95% of original performance specifications while using 70% less energy to produce.
What challenges does the Automotive Clutch Release Bearing Industry face during its growth?
- The industry's most significant challenge is the accelerating shift toward battery electric vehicles, which fundamentally eliminates the need for clutch-based systems in new vehicles.
- The market faces structural and operational challenges. The proliferation of torque converter automatics and the long-term transition away from ICE powertrain technology represent a fundamental demand threat for manual transmission components. Even before full electrification, market share for systems requiring a hydraulic release bearing or clutch master cylinder is eroding.
- Operationally, supply chain volatility and fluctuations in raw material pricing for high-grade specialty steels create significant cost pressures. This instability impacts the entire pressure plate assembly. For instance, input cost surges can reduce margins on wear and tear components by 5-8% if not passed on to consumers.
- Managing the clutch actuation hydraulics supply chain while facing declining volumes for parts like the clutch disc and torsional vibration damper is a primary strategic challenge.
Exclusive Technavio Analysis on Customer Landscape
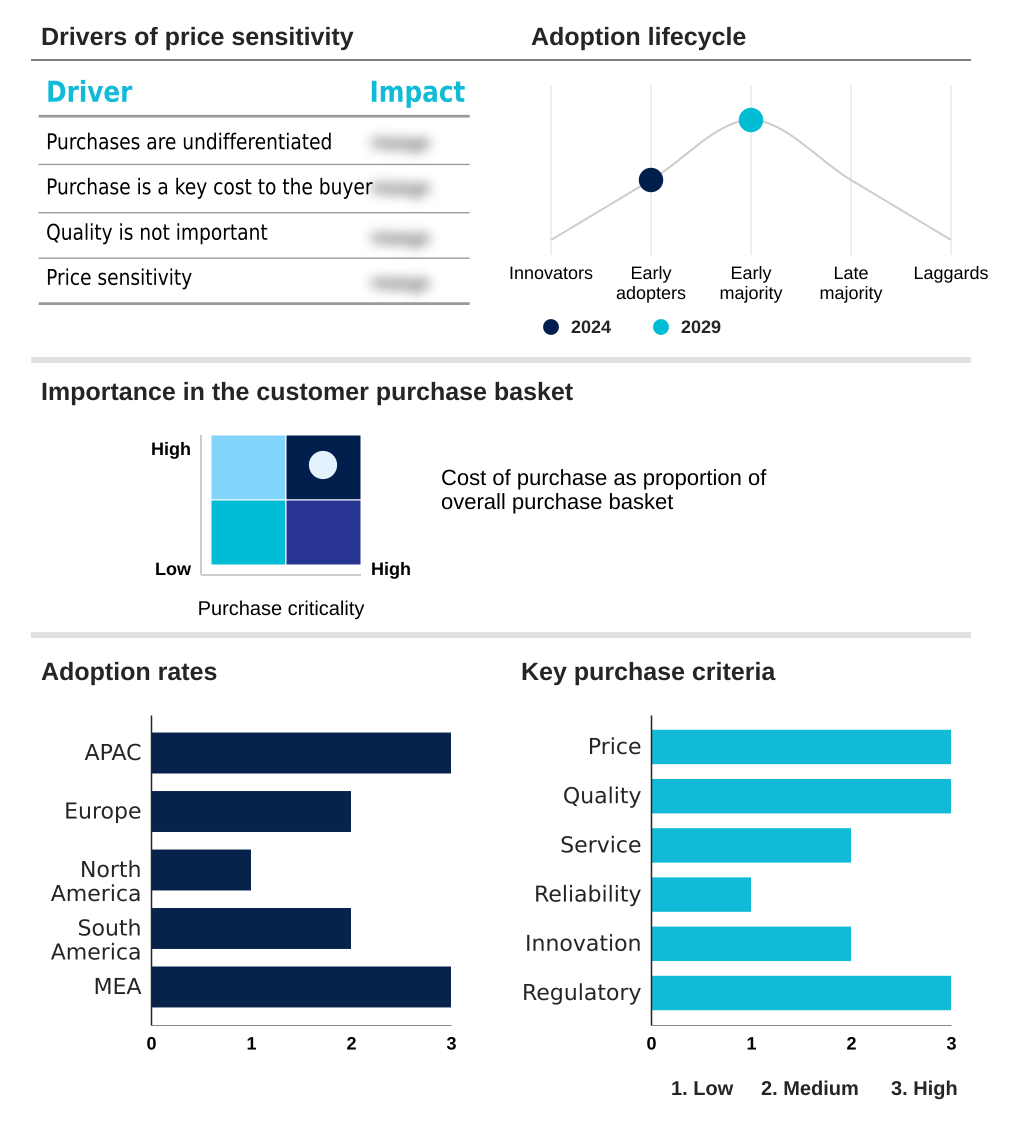
The automotive clutch release bearing market forecasting report includes the adoption lifecycle of the market, covering from the innovator’s stage to the laggard’s stage. It focuses on adoption rates in different regions based on penetration. Furthermore, the automotive clutch release bearing market report also includes key purchase criteria and drivers of price sensitivity to help companies evaluate and develop their market growth analysis strategies.
Customer Landscape of Automotive Clutch Release Bearing Industry
Competitive Landscape
Companies are implementing various strategies, such as strategic alliances, automotive clutch release bearing market forecast, partnerships, mergers and acquisitions, geographical expansion, and product/service launches, to enhance their presence in the industry.
AB SKF - Analysis indicates a focus on a comprehensive portfolio of clutch release bearings, serving both OEM and aftermarket channels with advanced, reliable solutions.
The industry research and growth report includes detailed analyses of the competitive landscape of the market and information about key companies, including:
- AB SKF
- Aetna Bearing Co.
- Alcon Components Ltd.
- CK Birla Group
- GMB CORP.
- JTEKT Corp.
- KG International FZCO
- NACHI FUJIKOSHI Corp.
- NSK Ltd.
- NTN Corp.
- Schaeffler AG
- Tata Steel Ltd.
- Texspin Bearings Ltd.
- The Timken Co.
- Tilton Engineering Inc.
- Valeo SA
- ZF Friedrichshafen AG
Qualitative and quantitative analysis of companies has been conducted to help clients understand the wider business environment as well as the strengths and weaknesses of key industry players. Data is qualitatively analyzed to categorize companies as pure play, category-focused, industry-focused, and diversified; it is quantitatively analyzed to categorize companies as dominant, leading, strong, tentative, and weak.
Recent Development and News in Automotive clutch release bearing market
- In January 2025, Schaeffler AG finalized the acquisition of a specialized polymer composites firm to advance the production of lightweight clutch bearing housings for high-performance applications.
- In November 2024, Valeo SA announced a new line of remanufactured concentric slave cylinders, targeting the European aftermarket with sustainable and cost-effective solutions certified to meet original equipment standards.
- In March 2025, AB SKF revealed a strategic partnership with a leading commercial vehicle OEM to co-develop sensor-integrated release bearings for next-generation automated manual transmissions (AMTs).
- In August 2024, Texspin Bearings Ltd. commenced operations at its new manufacturing facility in Mexico, aimed at capitalizing on nearshoring trends and strengthening its supply chain for the North American automotive aftermarket.
Dive into Technavio’s robust research methodology, blending expert interviews, extensive data synthesis, and validated models for unparalleled Automotive Clutch Release Bearing Market insights. See full methodology.
| Market Scope | |
|---|---|
| Page number | 293 |
| Base year | 2024 |
| Historic period | 2019-2023 |
| Forecast period | 2025-2029 |
| Growth momentum & CAGR | Accelerate at a CAGR of 1.9% |
| Market growth 2025-2029 | USD 75.3 million |
| Market structure | Fragmented |
| YoY growth 2024-2025(%) | 1.9% |
| Key countries | China, Japan, India, South Korea, Australia, Indonesia, Germany, UK, France, Italy, Spain, The Netherlands, US, Canada, Mexico, Brazil, Argentina, Colombia, Turkey, Saudi Arabia, South Africa, UAE and Israel |
| Competitive landscape | Leading Companies, Market Positioning of Companies, Competitive Strategies, and Industry Risks |
Research Analyst Overview
- The automotive clutch release bearing market is defined by the engineering of critical powertrain components. Boardroom strategy now centers on balancing the declining OEM demand for manual gearbox components with the stable aftermarket. The clutch actuation system, incorporating parts like the concentric slave cylinder and hydraulic release bearing, is a key area of focus.
- Innovations in push-type bearing and pull-type bearing designs cater to different torque handling capacity needs. The diaphragm spring and pressure plate assembly are core to clutch function, with the clutch fork providing mechanical leverage. Advanced bearing housing designs use lightweight polymer composites, while the rolling elements and bearing race are made from high-grade specialty steels.
- These drivetrain components, including the transmission input shaft, clutch disc, and flywheel, are engineered for high drivetrain efficiency. The clutch master cylinder and clutch actuation hydraulics ensure precise control over the clutch engagement point. Development of self-aligning bearings and sealed-for-life bearing units has reduced warranty claims by 20%.
- Managing clutch system NVH and gearbox synchronization remains a key objective, involving components like the torsional vibration damper and advanced bearing cage material.
What are the Key Data Covered in this Automotive Clutch Release Bearing Market Research and Growth Report?
-
What is the expected growth of the Automotive Clutch Release Bearing Market between 2025 and 2029?
-
USD 75.3 million, at a CAGR of 1.9%
-
-
What segmentation does the market report cover?
-
The report is segmented by Application (Passenger cars, and Commercial vehicles), Type (Pushing-type, and Pull-type), Material (Steel, Aluminium, and Plastics or composites) and Geography (APAC, Europe, North America, South America, Middle East and Africa)
-
-
Which regions are analyzed in the report?
-
APAC, Europe, North America, South America and Middle East and Africa
-
-
What are the key growth drivers and market challenges?
-
Resilient demand in emerging economies and niche performance segments, Inexorable shift towards battery electric vehicles (BEVs)
-
-
Who are the major players in the Automotive Clutch Release Bearing Market?
-
AB SKF, Aetna Bearing Co., Alcon Components Ltd., CK Birla Group, GMB CORP., JTEKT Corp., KG International FZCO, NACHI FUJIKOSHI Corp., NSK Ltd., NTN Corp., Schaeffler AG, Tata Steel Ltd., Texspin Bearings Ltd., The Timken Co., Tilton Engineering Inc., Valeo SA and ZF Friedrichshafen AG
-
Market Research Insights
- Market dynamics are characterized by a strategic pivot towards high-value segments and aftermarket resilience. The impact of vehicle electrification is forcing a re-evaluation of ICE powertrain technology, with a focus on enhancing powertrain efficiency in remaining applications. Firms leveraging precision manufacturing for powertrain lightweighting have demonstrated a 5% improvement in component-level efficiency.
- The automotive aftermarket ecosystem is now the primary stability driver, with demand for wear and tear components growing as the average vehicle age increases. Companies specializing in the remanufacturing process report a resource efficiency gain of up to 60% compared to new production.
- The evolution of transmission technology, including the adoption of dual-clutch systems in hybrid vehicle transmissions, offers new niches. Success hinges on navigating supply chain volatility and aligning with the circular economy in automotive principles, which are becoming key differentiators.
We can help! Our analysts can customize this automotive clutch release bearing market research report to meet your requirements.
 RIA -
RIA - 
