Automotive Variable Intake Air Control Valve Market Analysis APAC, Europe, North America, South America, Middle East and Africa - US, China, Japan, UK, France - Size and Forecast 2024-2028

Automotive Variable Intake Air Control Valve Market Analysis APAC, Europe, North America, South America, Middle East and Africa - US, China, Japan, UK, France - Size and Forecast 2024-2028

Published: Jan 2024 167 Pages SKU: IRTNTR70061

Market Overview at a Glance

$2.58 B
Market Opportunity
6.65%
CAGR
5.81
YoY growth 2023-2024(%)

Automotive Variable Intake Air Control Valve Market Size 2024-2028

The automotive variable intake air control valve market size is forecast to increase by USD 2.58 billion at a CAGR of 6.65% between 2023 and 2028.

  • The market is experiencing significant growth, driven by the increasing adoption of gasoline direct injection systems. This technology, which optimizes fuel combustion for improved engine performance and fuel efficiency, relies heavily on variable intake air control valves to manage the air-fuel mixture. Another trend shaping the market is the development of FreeValve engines, which utilize electronically controlled intake valves to optimize engine performance in real-time. Moreover, the burgeoning demand for electric vehicles (EVs) is creating new opportunities for the market. While EVs do not use traditional intake air control valves, the growing market share of these vehicles is driving research and development efforts to create more efficient and effective intake control systems for hybrid and plug-in hybrid vehicles.
  • Companies seeking to capitalize on these trends and navigate market challenges must focus on innovating to meet evolving consumer demands and regulatory requirements. Additionally, strategic partnerships, mergers and acquisitions, and investments in research and development are essential for long-term success in this dynamic market.

What will be the Size of the Automotive Variable Intake Air Control Valve Market during the forecast period?

Automotive Variable Intake Air Control Valve Market Size

 Request Free Sample

  • The market is experiencing rapid acceleration, driven by technological advancements and the increasing adoption of advanced technologies in engine control systems. These innovations enable real-time adjustments to engine parameters, optimizing engine performance, efficiency, and emissions reduction. The market is witnessing significant growth due to the global shift towards fuel-efficient vehicles, electric vehicles, and eco-friendly automotive solutions. Manufacturing processes are evolving, incorporating lightweight materials and novel construction methods to improve durability and operating conditions. Emissions regulations continue to tighten, necessitating the integration of emissions control systems and the use of artificial intelligence in engine management. The middle class's growing preference for environmentally friendly norms further fuels market expansion.
  • Automotive components, including variable intake air control valves, play a crucial role in engine efficiency and emissions management. Technological advancements in airflow management and engine design contribute to improved combustion processes and overall engine performance. As the industry dynamics evolve, the focus on connectivity, durability, and performance remains a priority for automotive solutions providers.

How is this Automotive Variable Intake Air Control Valve Industry segmented?

The automotive variable intake air control valve industry research report provides comprehensive data (region-wise segment analysis), with forecasts and estimates in "USD billion" for the period 2024-2028, as well as historical data from 2018-2022 for the following segments.

  • Application
    • Passenger vehicles
    • Commercial vehicles
  • Type
    • Solenoid valves
    • Air operated valves
  • Geography
    • APAC
      • China
      • Japan
    • Europe
      • France
      • UK
    • North America
      • US
    • South America
      • Middle East and Africa

      By Application Insights

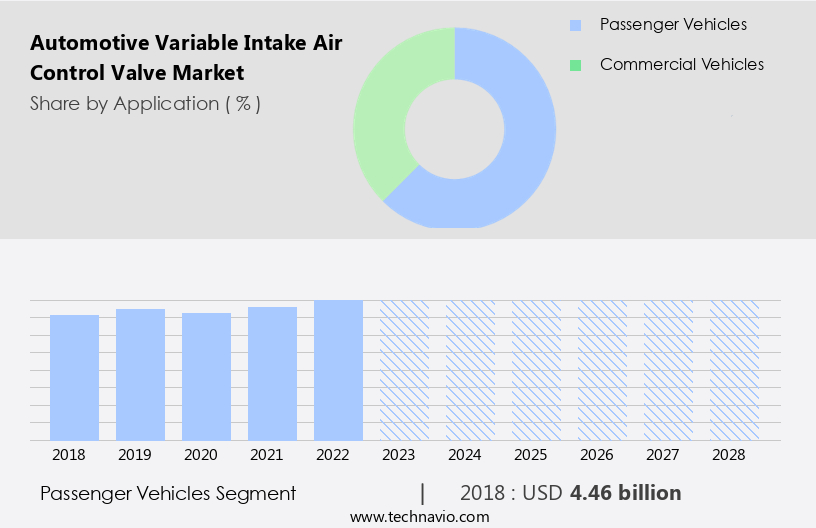
      The passenger vehicles segment is estimated to witness significant growth during the forecast period.

      The market experiences significant growth due to the increasing demand for clean transportation solutions and sustainable mobility. In the passenger vehicle segment, these valves play a crucial role in optimizing engine performance, fuel efficiency, and emission control. Manufacturers integrate advanced variable intake air control valve technologies to meet stringent emission regulations and fuel efficiency standards, making this market highly competitive. These valves adjust airflow into the engine based on operating conditions, enhancing overall vehicle performance. The focus on low-carbon transportation, hybrid car technology, and electric vehicle infrastructure further propels the market's growth. Additionally, the adoption of green automotive industry trends, such as eco-friendly car parts, advanced engine design, and lightweight vehicle design, contributes to the market's expansion.

      Innovations in automotive design, emission reduction strategies, and connected car technology further fuel the market's growth. Sustainable manufacturing practices and smart mobility solutions are also key drivers, as the future of mobility increasingly s emission reduction and sustainability.

      Automotive Variable Intake Air Control Valve Market Size

      Get a glance at the market report of share of various segments Request Free Sample

      The Passenger vehicles segment was valued at USD 4.46 billion in 2018 and showed a gradual increase during the forecast period.

      Regional Analysis

      APAC is estimated to contribute 59% to the growth of the global market during the forecast period.Technavio’s analysts have elaborately explained the regional trends and drivers that shape the market during the forecast period.

      Automotive Variable Intake Air Control Valve Market Share by Geography

      For more insights on the market size of various regions, Request Free Sample

      The market in the Asia Pacific (APAC) region is driven by the increasing preference for clean and sustainable transportation solutions. With a focus on reducing vehicle emissions and promoting low-carbon transportation, the adoption of hybrid car technology, electric vehicle infrastructure, and alternative fuel vehicles is on the rise. India and China, in particular, account for a significant share of the market due to their large automotive production bases and the high demand for fuel-efficient vehicles. Consumers in these countries prioritize vehicles with advanced engine designs and emission control technology, making the automotive supply chain increasingly reliant on sophisticated solutions such as automotive variable intake air control valves.

      Additionally, the next-generation automotive industry is witnessing innovation in areas such as autonomous driving technology, green automotive industry, and smart mobility solutions. Sustainable manufacturing practices and vehicle lifecycle analysis are also gaining importance as part of the global automotive trends. Overall, the market for automotive variable intake air control valves is expected to grow significantly during the forecast period, driven by the demand for fuel efficiency solutions, advanced engine technology, and eco-friendly car parts.

      Market Dynamics

      Our researchers analyzed the data with 2023 as the base year, along with the key drivers, trends, and challenges. A holistic analysis of drivers will help companies refine their marketing strategies to gain a competitive advantage.

      What are the key market drivers leading to the rise in the adoption of Automotive Variable Intake Air Control Valve Industry?

      • Growing demand for gasoline direct injection systems is the key driver of the market. 

      • The automotive industry's focus on enhancing vehicle performance, fuel economy, and energy efficiency has led to the development of advanced fuel injection technologies, such as Gasoline Direct Injection (GDI). This system, also known as fuel-stratified injection (FSI) or spark-ignited direct injection (SIDI), atomizes and ignites fuel directly in the combustion chamber, increasing engine compression and resulting in greater efficiency. The integration of GDI with turbocharging and engine downsizing can potentially reduce fuel consumption and CO2 emissions by up to 10-15%.
      • Strict emission norms in major markets, including North America and Europe, have compelled automotive Original Equipment Manufacturers (OEMs) to adopt GDI technology in their vehicles. This technology's adoption not only improves vehicle performance and fuel economy but also helps in reducing greenhouse gas emissions, making it a crucial component in the automotive industry's ongoing efforts towards sustainability.

      What are the market trends shaping the Automotive Variable Intake Air Control Valve Industry?

      • Development of FreeValve engines is the upcoming market trend. 

      • The introduction of FreeValve engines, which operate without a camshaft and use pneumatic, hydraulic, or electromagnetic actuators to control valves, is disrupting the traditional automotive industry. FreeValve engines, produced by Koenigsegg's business unit, offer several advantages over conventional engines, including increased torque by 47%, power by 45%, reduced fuel consumption by 15%, and emissions by 35%. These engines do not require automotive variable intake air control valves, leading to a decelerated growth in the global market. However, the superior efficiency and performance of FreeValve engines are anticipated to stimulate the demand for these valves as manufacturers seek to optimize engine performance in conventional engines.
      • The benefits of improved torque, power, fuel efficiency, and emissions reduction are significant market drivers, making the market an essential component in the global automotive industry.

      What challenges does the Automotive Variable Intake Air Control Valve Industry face during its growth?

      • Increasing demand for EVs is a key challenge affecting the industry growth. 

      • The global market for Automotive Variable Intake Air Control Valves has gained significant traction due to the increasing adoption of electric vehicles (EVs) worldwide. Governments' emphasis on reducing carbon emissions and offering subsidies for EVs, coupled with the declining battery prices and the launch of cost-effective EV variants, have significantly boosted the demand for these vehicles. Furthermore, the expansion of EV charging infrastructure, rising consumer awareness, and partial or full bans on fuel-powered vehicles have also contributed to the market's growth.
      • Notable markets for EVs include China, the US, Japan, Norway, and Germany. This trend is expected to continue as the world shifts towards sustainable energy and environment-friendly transportation solutions.

      Exclusive Customer Landscape

      The automotive variable intake air control valve market forecasting report includes the adoption lifecycle of the market, covering from the innovator’s stage to the laggard’s stage. It focuses on adoption rates in different regions based on penetration. Furthermore, the automotive variable intake air control valve market report also includes key purchase criteria and drivers of price sensitivity to help companies evaluate and develop their market growth analysis strategies.

      Automotive Variable Intake Air Control Valve Market Share by Geography

       Customer Landscape

      Key Companies & Market Insights

      Companies are implementing various strategies, such as strategic alliances, automotive variable intake air control valve market forecast, partnerships, mergers and acquisitions, geographical expansion, and product/service launches, to enhance their presence in the industry.

      BorgWarner Inc. - The company provides advanced automotive intake air control valves, featuring electronic throttle valves with DC motors, two-stage gear systems, non-contact position sensing, and fail-safe return springs. Aluminum bodies ensure durability and lightweight design. These innovative valves enhance engine performance and efficiency.

      The industry research and growth report includes detailed analyses of the competitive landscape of the market and information about key companies, including:

      • BorgWarner Inc.
      • Continental AG
      • DENSO Corp.
      • Eagle Industry Co. Ltd
      • Eaton Corp. Plc
      • Hitachi Ltd.
      • Mikuni Corp.
      • Nidec Corp.
      • Robert Bosch GmbH
      • Rotex Automation Ltd.
      • Standard Motor Products Inc.
      • VOSS Automotive GmbH

      Qualitative and quantitative analysis of companies has been conducted to help clients understand the wider business environment as well as the strengths and weaknesses of key industry players. Data is qualitatively analyzed to categorize companies as pure play, category-focused, industry-focused, and diversified; it is quantitatively analyzed to categorize companies as dominant, leading, strong, tentative, and weak.

      Research Analyst Overview

      The automotive industry is undergoing a significant transformation as the global focus shifts towards cleaner and more sustainable transportation solutions. This transition is driven by various factors, including growing concerns over environmental sustainability, increasing adoption of electric vehicles (EVs), and advancements in technology. Variable intake air control valves (VICVs) play a crucial role in optimizing engine performance and fuel efficiency in modern vehicles. These valves adjust the amount of air that enters the engine based on driving conditions, allowing for improved combustion and reduced emissions. The market for VICVs is expected to grow significantly in the coming years due to several factors.

      Firstly, the increasing demand for fuel efficiency and emission reduction strategies in the automotive industry is driving the adoption of advanced engine designs, which rely on VICVs to optimize performance. Moreover, the shift towards sustainable transportation and the growing popularity of electric and hybrid vehicles are also expected to boost the demand for VICVs. These vehicles require sophisticated solutions to manage their powertrains efficiently, and VICVs play a critical role in optimizing the performance of internal combustion engines used in hybrid vehicles. Another trend driving the growth of the VICV market is the increasing focus on lightweight vehicle design.

      VICVs help reduce the weight of vehicles by eliminating the need for complex engine management systems, making them an attractive option for automakers looking to meet fuel efficiency regulations and reduce vehicle weight. Furthermore, the adoption of connected car technology and innovation in automotive manufacturing practices are also expected to create new opportunities for VICV suppliers. Connected cars generate vast amounts of data that can be used to optimize engine performance and fuel efficiency in real-time, making VICVs an essential component of these systems. In addition, the trend towards sustainable manufacturing practices in the automotive industry is expected to drive the adoption of VICVs.

      These valves help reduce the carbon footprint of vehicle production by optimizing engine performance and reducing the need for excessive fuel consumption during the manufacturing process. The future of mobility is expected to be characterized by advanced engine technology, emission reduction strategies, and a focus on sustainability. VICVs are expected to play a crucial role in enabling these trends by optimizing engine performance, reducing emissions, and improving fuel efficiency. In , the market for variable intake air control valves is poised for significant growth in the coming years due to various factors, including the increasing demand for fuel efficiency and emission reduction strategies, the shift towards sustainable transportation, and the adoption of advanced engine designs and connected car technology.

      The market is expected to be driven by innovation, sophistication, and a focus on sustainability, making it an exciting space for suppliers and investors alike.

      Market Scope

      Report Coverage

      Details

      Page number

      167

      Base year

      2023

      Historic period

      2018-2022

      Forecast period

      2024-2028

      Growth momentum & CAGR

      Accelerate at a CAGR of 6.65%

      Market growth 2024-2028

      USD 2.58 billion

      Market structure

      Concentrated

      YoY growth 2023-2024(%)

      5.81

      Key countries

      US, China, Japan, UK, and France

      Competitive landscape

      Leading Companies, Market Positioning of Companies, Competitive Strategies, and Industry Risks

      Request Free Sample

      What are the Key Data Covered in this Automotive Variable Intake Air Control Valve Market Research and Growth Report?

      • CAGR of the Automotive Variable Intake Air Control Valve industry during the forecast period
      • Detailed information on factors that will drive the growth and forecasting between 2024 and 2028
      • Precise estimation of the size of the market and its contribution of the industry in focus to the parent market
      • Accurate predictions about upcoming growth and trends and changes in consumer behaviour
      • Growth of the market across APAC, Europe, North America, South America, and Middle East and Africa
      • Thorough analysis of the market’s competitive landscape and detailed information about companies
      • Comprehensive analysis of factors that will challenge the automotive variable intake air control valve market growth of industry companies

      We can help! Our analysts can customize this automotive variable intake air control valve market research report to meet your requirements.

      Get in touch


      1 Executive Summary

      • 1.1 Market overview
        • Exhibit 01: Executive Summary – Chart on Market Overview
        • Exhibit 02: Executive Summary – Data Table on Market Overview
        • Exhibit 03: Executive Summary – Chart on Global Market Characteristics
        • Exhibit 04: Executive Summary – Chart on Market by Geography
        • Exhibit 05: Executive Summary – Chart on Market Segmentation by Application
        • Exhibit 06: Executive Summary – Chart on Market Segmentation by Type
        • Exhibit 07: Executive Summary – Chart on Incremental Growth
        • Exhibit 08: Executive Summary – Data Table on Incremental Growth
        • Exhibit 09: Executive Summary – Chart on Vendor Market Positioning

      2 Market Landscape

      • 2.1 Market ecosystem
        • Exhibit 10: Parent market
        • Exhibit 11: Market Characteristics

      3 Market Sizing

      • 3.1 Market definition
        • Exhibit 12: Offerings of vendors included in the market definition
      • 3.2 Market segment analysis
        • Exhibit 13: Market segments
      • 3.3 Market size 2023
        • 3.4 Market outlook: Forecast for 2023-2028
          • Exhibit 14: Chart on Global - Market size and forecast 2023-2028 ($ billion)
          • Exhibit 15: Data Table on Global - Market size and forecast 2023-2028 ($ billion)
          • Exhibit 16: Chart on Global Market: Year-over-year growth 2023-2028 (%)
          • Exhibit 17: Data Table on Global Market: Year-over-year growth 2023-2028 (%)

        4 Historic Market Size

        • 4.1 Global automotive variable intake air control valve market 2018 - 2022
          • Exhibit 18: Historic Market Size – Data Table on global automotive variable intake air control valve market 2018 - 2022 ($ billion)
        • 4.2 Application Segment Analysis 2018 - 2022
          • Exhibit 19: Historic Market Size – Application Segment 2018 - 2022 ($ billion)
        • 4.3 Type Segment Analysis 2018 - 2022
          • Exhibit 20: Historic Market Size – Type Segment 2018 - 2022 ($ billion)
        • 4.4 Geography Segment Analysis 2018 - 2022
          • Exhibit 21: Historic Market Size – Geography Segment 2018 - 2022 ($ billion)
        • 4.5 Country Segment Analysis 2018 - 2022
          • Exhibit 22: Historic Market Size – Country Segment 2018 - 2022 ($ billion)

        5 Five Forces Analysis

        • 5.1 Five forces summary
          • Exhibit 23: Five forces analysis - Comparison between 2023 and 2028
        • 5.2 Bargaining power of buyers
          • Exhibit 24: Chart on Bargaining power of buyers – Impact of key factors 2023 and 2028
        • 5.3 Bargaining power of suppliers
          • Exhibit 25: Bargaining power of suppliers – Impact of key factors in 2023 and 2028
        • 5.4 Threat of new entrants
          • Exhibit 26: Threat of new entrants – Impact of key factors in 2023 and 2028
        • 5.5 Threat of substitutes
          • Exhibit 27: Threat of substitutes – Impact of key factors in 2023 and 2028
        • 5.6 Threat of rivalry
          • Exhibit 28: Threat of rivalry – Impact of key factors in 2023 and 2028
        • 5.7 Market condition
          • Exhibit 29: Chart on Market condition - Five forces 2023 and 2028

        6 Market Segmentation by Application

        • 6.1 Market segments
          • Exhibit 30: Chart on Application - Market share 2023-2028 (%)
          • Exhibit 31: Data Table on Application - Market share 2023-2028 (%)
        • 6.2 Comparison by Application
          • Exhibit 32: Chart on Comparison by Application
          • Exhibit 33: Data Table on Comparison by Application
        • 6.3 Passenger vehicles - Market size and forecast 2023-2028
          • Exhibit 34: Chart on Passenger vehicles - Market size and forecast 2023-2028 ($ billion)
          • Exhibit 35: Data Table on Passenger vehicles - Market size and forecast 2023-2028 ($ billion)
          • Exhibit 36: Chart on Passenger vehicles - Year-over-year growth 2023-2028 (%)
          • Exhibit 37: Data Table on Passenger vehicles - Year-over-year growth 2023-2028 (%)
        • 6.4 Commercial vehicles - Market size and forecast 2023-2028
          • Exhibit 38: Chart on Commercial vehicles - Market size and forecast 2023-2028 ($ billion)
          • Exhibit 39: Data Table on Commercial vehicles - Market size and forecast 2023-2028 ($ billion)
          • Exhibit 40: Chart on Commercial vehicles - Year-over-year growth 2023-2028 (%)
          • Exhibit 41: Data Table on Commercial vehicles - Year-over-year growth 2023-2028 (%)
        • 6.5 Market opportunity by Application
          • Exhibit 42: Market opportunity by Application ($ billion)
          • Exhibit 43: Data Table on Market opportunity by Application ($ billion)

        7 Market Segmentation by Type

        • 7.1 Market segments
          • Exhibit 44: Chart on Type - Market share 2023-2028 (%)
          • Exhibit 45: Data Table on Type - Market share 2023-2028 (%)
        • 7.2 Comparison by Type
          • Exhibit 46: Chart on Comparison by Type
          • Exhibit 47: Data Table on Comparison by Type
        • 7.3 Solenoid valves - Market size and forecast 2023-2028
          • Exhibit 48: Chart on Solenoid valves - Market size and forecast 2023-2028 ($ billion)
          • Exhibit 49: Data Table on Solenoid valves - Market size and forecast 2023-2028 ($ billion)
          • Exhibit 50: Chart on Solenoid valves - Year-over-year growth 2023-2028 (%)
          • Exhibit 51: Data Table on Solenoid valves - Year-over-year growth 2023-2028 (%)
        • 7.4 Air operated valves - Market size and forecast 2023-2028
          • Exhibit 52: Chart on Air operated valves - Market size and forecast 2023-2028 ($ billion)
          • Exhibit 53: Data Table on Air operated valves - Market size and forecast 2023-2028 ($ billion)
          • Exhibit 54: Chart on Air operated valves - Year-over-year growth 2023-2028 (%)
          • Exhibit 55: Data Table on Air operated valves - Year-over-year growth 2023-2028 (%)
        • 7.5 Market opportunity by Type
          • Exhibit 56: Market opportunity by Type ($ billion)
          • Exhibit 57: Data Table on Market opportunity by Type ($ billion)

        8 Customer Landscape

        • 8.1 Customer landscape overview
          • Exhibit 58: Analysis of price sensitivity, lifecycle, customer purchase basket, adoption rates, and purchase criteria

        9 Geographic Landscape

        • 9.1 Geographic segmentation
          • Exhibit 59: Chart on Market share by geography 2023-2028 (%)
          • Exhibit 60: Data Table on Market share by geography 2023-2028 (%)
        • 9.2 Geographic comparison
          • Exhibit 61: Chart on Geographic comparison
          • Exhibit 62: Data Table on Geographic comparison
        • 9.3 APAC - Market size and forecast 2023-2028
          • Exhibit 63: Chart on APAC - Market size and forecast 2023-2028 ($ billion)
          • Exhibit 64: Data Table on APAC - Market size and forecast 2023-2028 ($ billion)
          • Exhibit 65: Chart on APAC - Year-over-year growth 2023-2028 (%)
          • Exhibit 66: Data Table on APAC - Year-over-year growth 2023-2028 (%)
        • 9.4 Europe - Market size and forecast 2023-2028
          • Exhibit 67: Chart on Europe - Market size and forecast 2023-2028 ($ billion)
          • Exhibit 68: Data Table on Europe - Market size and forecast 2023-2028 ($ billion)
          • Exhibit 69: Chart on Europe - Year-over-year growth 2023-2028 (%)
          • Exhibit 70: Data Table on Europe - Year-over-year growth 2023-2028 (%)
        • 9.5 North America - Market size and forecast 2023-2028
          • Exhibit 71: Chart on North America - Market size and forecast 2023-2028 ($ billion)
          • Exhibit 72: Data Table on North America - Market size and forecast 2023-2028 ($ billion)
          • Exhibit 73: Chart on North America - Year-over-year growth 2023-2028 (%)
          • Exhibit 74: Data Table on North America - Year-over-year growth 2023-2028 (%)
        • 9.6 South America - Market size and forecast 2023-2028
          • Exhibit 75: Chart on South America - Market size and forecast 2023-2028 ($ billion)
          • Exhibit 76: Data Table on South America - Market size and forecast 2023-2028 ($ billion)
          • Exhibit 77: Chart on South America - Year-over-year growth 2023-2028 (%)
          • Exhibit 78: Data Table on South America - Year-over-year growth 2023-2028 (%)
        • 9.7 Middle East and Africa - Market size and forecast 2023-2028
          • Exhibit 79: Chart on Middle East and Africa - Market size and forecast 2023-2028 ($ billion)
          • Exhibit 80: Data Table on Middle East and Africa - Market size and forecast 2023-2028 ($ billion)
          • Exhibit 81: Chart on Middle East and Africa - Year-over-year growth 2023-2028 (%)
          • Exhibit 82: Data Table on Middle East and Africa - Year-over-year growth 2023-2028 (%)
        • 9.8 China - Market size and forecast 2023-2028
          • Exhibit 83: Chart on China - Market size and forecast 2023-2028 ($ billion)
          • Exhibit 84: Data Table on China - Market size and forecast 2023-2028 ($ billion)
          • Exhibit 85: Chart on China - Year-over-year growth 2023-2028 (%)
          • Exhibit 86: Data Table on China - Year-over-year growth 2023-2028 (%)
        • 9.9 US - Market size and forecast 2023-2028
          • Exhibit 87: Chart on US - Market size and forecast 2023-2028 ($ billion)
          • Exhibit 88: Data Table on US - Market size and forecast 2023-2028 ($ billion)
          • Exhibit 89: Chart on US - Year-over-year growth 2023-2028 (%)
          • Exhibit 90: Data Table on US - Year-over-year growth 2023-2028 (%)
        • 9.10 UK - Market size and forecast 2023-2028
          • Exhibit 91: Chart on UK - Market size and forecast 2023-2028 ($ billion)
          • Exhibit 92: Data Table on UK - Market size and forecast 2023-2028 ($ billion)
          • Exhibit 93: Chart on UK - Year-over-year growth 2023-2028 (%)
          • Exhibit 94: Data Table on UK - Year-over-year growth 2023-2028 (%)
        • 9.11 France - Market size and forecast 2023-2028
          • Exhibit 95: Chart on France - Market size and forecast 2023-2028 ($ billion)
          • Exhibit 96: Data Table on France - Market size and forecast 2023-2028 ($ billion)
          • Exhibit 97: Chart on France - Year-over-year growth 2023-2028 (%)
          • Exhibit 98: Data Table on France - Year-over-year growth 2023-2028 (%)
        • 9.12 Japan - Market size and forecast 2023-2028
          • Exhibit 99: Chart on Japan - Market size and forecast 2023-2028 ($ billion)
          • Exhibit 100: Data Table on Japan - Market size and forecast 2023-2028 ($ billion)
          • Exhibit 101: Chart on Japan - Year-over-year growth 2023-2028 (%)
          • Exhibit 102: Data Table on Japan - Year-over-year growth 2023-2028 (%)
        • 9.13 Market opportunity by geography
          • Exhibit 103: Market opportunity by geography ($ billion)
          • Exhibit 104: Data Tables on Market opportunity by geography ($ billion)

        10 Drivers, Challenges, and Trends

        • 10.1 Market drivers
          • 10.2 Market challenges
            • 10.3 Impact of drivers and challenges
              • Exhibit 105: Impact of drivers and challenges in 2023 and 2028
            • 10.4 Market trends

              11 Vendor Landscape

              • 11.1 Overview
                • 11.2 Vendor landscape
                  • Exhibit 106: Overview on Criticality of inputs and Factors of differentiation
                • 11.3 Landscape disruption
                  • Exhibit 107: Overview on factors of disruption
                • 11.4 Industry risks
                  • Exhibit 108: Impact of key risks on business

                12 Vendor Analysis

                • 12.1 Vendors covered
                  • Exhibit 109: Vendors covered
                • 12.2 Market positioning of vendors
                  • Exhibit 110: Matrix on vendor position and classification
                • 12.3 BorgWarner Inc.
                  • Exhibit 111: BorgWarner Inc. - Overview
                  • Exhibit 112: BorgWarner Inc. - Business segments
                  • Exhibit 113: BorgWarner Inc. - Key news
                  • Exhibit 114: BorgWarner Inc. - Key offerings
                  • Exhibit 115: BorgWarner Inc. - Segment focus
                • 12.4 Continental AG
                  • Exhibit 116: Continental AG - Overview
                  • Exhibit 117: Continental AG - Business segments
                  • Exhibit 118: Continental AG - Key offerings
                  • Exhibit 119: Continental AG - Segment focus
                • 12.5 DENSO Corp.
                  • Exhibit 120: DENSO Corp. - Overview
                  • Exhibit 121: DENSO Corp. - Business segments
                  • Exhibit 122: DENSO Corp. - Key news
                  • Exhibit 123: DENSO Corp. - Key offerings
                  • Exhibit 124: DENSO Corp. - Segment focus
                • 12.6 Eagle Industry Co. Ltd
                  • Exhibit 125: Eagle Industry Co. Ltd - Overview
                  • Exhibit 126: Eagle Industry Co. Ltd - Business segments
                  • Exhibit 127: Eagle Industry Co. Ltd - Key offerings
                  • Exhibit 128: Eagle Industry Co. Ltd - Segment focus
                • 12.7 Eaton Corp. Plc
                  • Exhibit 129: Eaton Corp. Plc - Overview
                  • Exhibit 130: Eaton Corp. Plc - Business segments
                  • Exhibit 131: Eaton Corp. Plc - Key news
                  • Exhibit 132: Eaton Corp. Plc - Key offerings
                  • Exhibit 133: Eaton Corp. Plc - Segment focus
                • 12.8 Hitachi Ltd.
                  • Exhibit 134: Hitachi Ltd. - Overview
                  • Exhibit 135: Hitachi Ltd. - Business segments
                  • Exhibit 136: Hitachi Ltd. - Key news
                  • Exhibit 137: Hitachi Ltd. - Key offerings
                  • Exhibit 138: Hitachi Ltd. - Segment focus
                • 12.9 Mikuni Corp.
                  • Exhibit 139: Mikuni Corp. - Overview
                  • Exhibit 140: Mikuni Corp. - Business segments
                  • Exhibit 141: Mikuni Corp. - Key offerings
                  • Exhibit 142: Mikuni Corp. - Segment focus
                • 12.10 Nidec Corp.
                  • Exhibit 143: Nidec Corp. - Overview
                  • Exhibit 144: Nidec Corp. - Business segments
                  • Exhibit 145: Nidec Corp. - Key news
                  • Exhibit 146: Nidec Corp. - Key offerings
                  • Exhibit 147: Nidec Corp. - Segment focus
                • 12.11 Robert Bosch GmbH
                  • Exhibit 148: Robert Bosch GmbH - Overview
                  • Exhibit 149: Robert Bosch GmbH - Business segments
                  • Exhibit 150: Robert Bosch GmbH - Key news
                  • Exhibit 151: Robert Bosch GmbH - Key offerings
                  • Exhibit 152: Robert Bosch GmbH - Segment focus
                • 12.12 Rotex Automation Ltd.
                  • Exhibit 153: Rotex Automation Ltd. - Overview
                  • Exhibit 154: Rotex Automation Ltd. - Product / Service
                  • Exhibit 155: Rotex Automation Ltd. - Key offerings
                • 12.13 Standard Motor Products Inc.
                  • Exhibit 156: Standard Motor Products Inc. - Overview
                  • Exhibit 157: Standard Motor Products Inc. - Product / Service
                  • Exhibit 158: Standard Motor Products Inc. - Key offerings
                • 12.14 VOSS Automotive GmbH
                  • Exhibit 159: VOSS Automotive GmbH - Overview
                  • Exhibit 160: VOSS Automotive GmbH - Product / Service
                  • Exhibit 161: VOSS Automotive GmbH - Key offerings

                13 Appendix

                • 13.1 Scope of the report
                  • 13.2 Inclusions and exclusions checklist
                    • Exhibit 162: Inclusions checklist
                    • Exhibit 163: Exclusions checklist
                  • 13.3 Currency conversion rates for US$
                    • Exhibit 164: Currency conversion rates for US$
                  • 13.4 Research methodology
                    • Exhibit 165: Research methodology
                    • Exhibit 166: Validation techniques employed for market sizing
                    • Exhibit 167: Information sources
                  • 13.5 List of abbreviations
                    • Exhibit 168: List of abbreviations

                  Research Methodology

                  Technavio presents a detailed picture of the market by way of study, synthesis, and summation of data from multiple sources. The analysts have presented the various facets of the market with a particular focus on identifying the key industry influencers. The data thus presented is comprehensive, reliable, and the result of extensive research, both primary and secondary.

                  INFORMATION SOURCES

                  Primary sources

                  • Manufacturers and suppliers
                  • Channel partners
                  • Industry experts
                  • Strategic decision makers

                  Secondary sources

                  • Industry journals and periodicals
                  • Government data
                  • Financial reports of key industry players
                  • Historical data
                  • Press releases

                  DATA ANALYSIS

                  Data Synthesis

                  • Collation of data
                  • Estimation of key figures
                  • Analysis of derived insights

                  Data Validation

                  • Triangulation with data models
                  • Reference against proprietary databases
                  • Corroboration with industry experts

                  REPORT WRITING

                  Qualitative

                  • Market drivers
                  • Market challenges
                  • Market trends
                  • Five forces analysis

                  Quantitative

                  • Market size and forecast
                  • Market segmentation
                  • Geographical insights
                  • Competitive landscape

                  Interested in this report?

                  Get your sample now to see our research methodology and insights!

                  Download Now

                  Frequently Asked Questions

                  Automotive Variable Intake Air Control Valve market growth will increase by $ 2.58 bn during 2024-2028 .

                  The Automotive Variable Intake Air Control Valve market is expected to grow at a CAGR of 6.65% during 2024-2028 .

                  Automotive Variable Intake Air Control Valve market is segmented by Application( Passenger vehicles, Commercial vehicles) Type( Solenoid valves, Air operated valves, North America, South America, MEA)

                  BorgWarner Inc., Continental AG, DENSO Corp., Eagle Industry Co. Ltd, Eaton Corp. Plc, Hitachi Ltd., Mikuni Corp., Nidec Corp., Robert Bosch GmbH, Rotex Automation Ltd., Standard Motor Products Inc., VOSS Automotive GmbH are a few of the key vendors in the Automotive Variable Intake Air Control Valve market.

                  APAC will register the highest growth rate of 59% among the other regions. Therefore, the Automotive Variable Intake Air Control Valve market in APAC is expected to garner significant business opportunities for the vendors during the forecast period.

                  US, China, Japan, UK, France

                  • Growing demand for gasoline direct injection systemsThe growing need for superior performance is the driving factor this market.
                  • fuel economy is the driving factor this market.
                  • and energy efficiency has led to the advancement of automotive fuel injection technology. Gasoline direct injection (GDI) is the driving factor this market.
                  • also known as a fuel-stratified injection (FSI) or spark-ignited direct injection (SIDI) is the driving factor this market.
                  • is an advanced fuel injection system is the driving factor this market.
                  • wherein the fuel sprayed by injectors is finely atomized and ignited directly is the driving factor this market.
                  • eliminating the need to mix it in the combustion chamber. This process ensures high engine compression is the driving factor this market.
                  • which results in greater efficiency. The use of GDI is the driving factor this market.
                  • coupled with turbocharging and engine downsizing is the driving factor this market.
                  • can potentially reduce fuel consumption and CO2 emissions further by close to 10%-15%. The need to comply with stringent emission norms in North America and Europe has pushed automotive OEMs to adopt GDI in automobiles. Some prominent automakers offering GDI vehicles are Mazda Motor is the driving factor this market.
                  • Volkswagen is the driving factor this market.
                  • BMW is the driving factor this market.
                  • Daimler is the driving factor this market.
                  • Kia Motor is the driving factor this market.
                  • and General Motors (GM). In the US is the driving factor this market.
                  • most light vehicles and pickup trucks are offered with the GDI system. Similarly is the driving factor this market.
                  • in Europe is the driving factor this market.
                  • GDI vehicles is the driving factor this market.
                  • better known as FSI vehicles is the driving factor this market.
                  • are highly popular and contribute to a significant market share. Therefore is the driving factor this market.
                  • the benefits of GDI systems have increased the demand for such automotive variable intake air control valves from major global automotive OEMs. Thus is the driving factor this market.
                  • such factors are expected to propel the growth of the global market during the forecast period. is the driving factor this market.

                  The Automotive Variable Intake Air Control Valve market vendors should focus on grabbing business opportunities from the Passenger vehicles segment as it accounted for the largest market share in the base year.