Control Valves Market Analysis APAC, Europe, North America, Middle East and Africa, South America - China, US, Russia, India, Japan - Size and Forecast 2024-2028

Control Valves Market Analysis APAC, Europe, North America, Middle East and Africa, South America - China, US, Russia, India, Japan - Size and Forecast 2024-2028

Published: May 2024 174 Pages SKU: IRTNTR70428

Market Overview at a Glance

$2.77 B
Market Opportunity
5.33%
CAGR
4.96
YoY growth 2023-2024(%)

Control Valves Market Size 2024-2028 

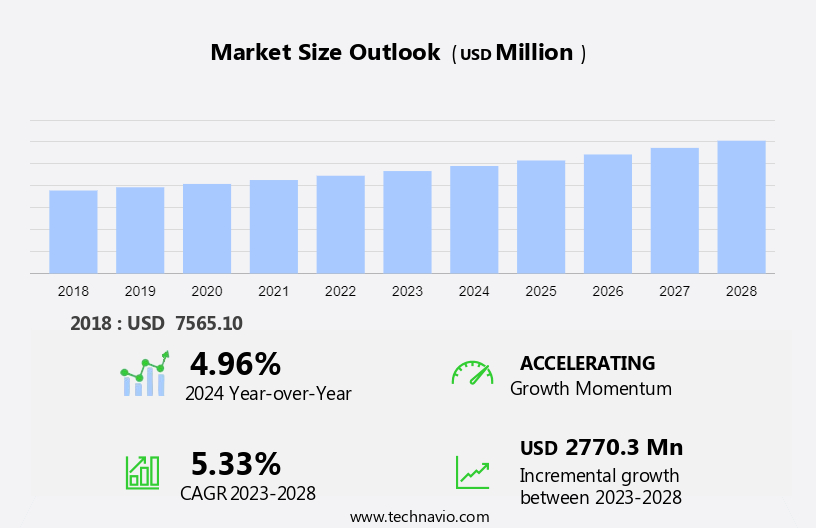
The control valves market size is forecast to increase by USD 2.77 billion at a CAGR of 5.33% between 2023 and 2028. The market is experiencing significant growth due to increasing demand in various industries, including petrochemicals, petroleum, power generation, process plants, pulp and paper, and renewable energy. In the petrochemical industry, the need for precise pressure control in production processes is driving the demand for advanced control valves. In the petroleum sector, the rising demand for oil and gas is leading to increased investments in fluid handling infrastructure, which in turn is boosting the market. In the power generation sector, the shift towards renewable energy sources is creating new opportunities for control valves in renewable energy projects. Meanwhile, in the water industry, the need for reliable valves to ensure potable water supply is a key growth factor. Developments in control valve positioners and fluctuations in raw material prices are also influencing market trends. 

Control Valves Market Size

 Request Free Sample

The market is witnessing significant growth due to the increasing automation in process plants across various industries, including pharmaceuticals, oil & gas, water and wastewater treatment, energy and power, and power generation. The integration of wireless infrastructure in control valves is a key trend driving market growth. Smart control valves, which use connected networks and automatic components like solenoid valves, are gaining popularity due to their ability to enhance process efficiency and reduce operational costs. In the pharmaceutical industry, control valves are used for chemical treatment in feed water and cooling water systems. In the oil and gas industry, they are employed in power generation plants and nuclear power plants for various applications, including process control and safety systems.

Moreover, the energy and power industry uses control valves extensively for power generation and distribution. Industry players are focusing on developing advanced control valves with improved performance and reliability. Medical devices are also incorporating control valves for fluid management applications. Overall, the market is expected to grow steadily due to the increasing demand for industrial equipment and the need for efficient and reliable process control systems.

Market Segmentation

The market research report provides comprehensive data (region-wise segment analysis), with forecasts and estimates in "USD billion" for the period 2024-2028, as well as historical data from 2018-2022 for the following segments.
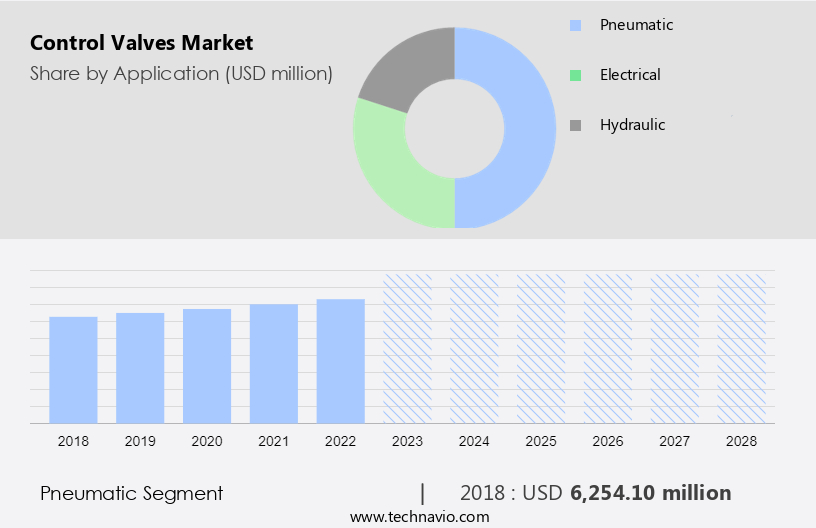
  • Application
    • Pneumatic
    • Electrical
    • Hydraulic
  • Product
    • Sliding shaft
    • Rotating shaft
  • Geography
    • APAC
      • China
      • India
      • Japan
    • Europe
    • North America
      • US
    • Middle East and Africa
    • South America

By Application Insights

The pneumatic segment is estimated to witness significant growth during the forecast period. Control valves play a crucial role in the water and wastewater industry, particularly in applications such as water treatment, effluent treatment plants, sewage treatment plants, and water recycling. These valves, including diaphragm valves, are essential for managing fluid flow in hydraulic systems. The growing water demand, driven by population growth, industrial activities, and urbanization, has led to an increase in the construction of water and wastewater treatment plants. In addition, the shift towards energy efficiency and the exploration of alternative energy sources, such as desalination plants, cooling water systems in power generation, and crude oil refineries, further boosts the demand for control valves.

Moreover, digital intelligence and connected networks are increasingly being integrated into control valve systems to optimize performance and reduce energy consumption. The emerging economies are expected to witness significant growth in the water and wastewater treatment sector, providing opportunities for control valve market expansion.

Control Valves Market Size

Get a glance at the market share of various segments Request Free Sample

The pneumatic segment was valued at USD 6.25 billion in 2018 and showed a gradual increase during the forecast period.

Regional Insights

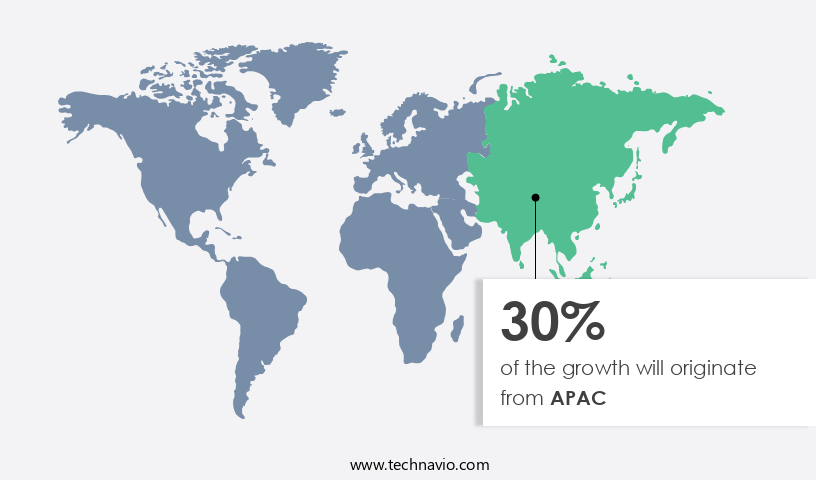
APAC is estimated to contribute 30% to the growth of the global market during the forecast period. Technavio's analysts have elaborately explained the regional trends and drivers that shape the market during the forecast period.

Control Valves Market Share by Geography

For more insights on the market share of various regions Request Free Sample

The market in the Asia Pacific (APAC) region is expected to witness significant growth during the forecast period, with China, Japan, India, and South Korea leading the charge. The expansion of industries such as food and beverages, oil refining, and desalination plants is driving the demand for control valves in APAC. In China and India, the increasing automobile market is fueling the need for crude oil refining, resulting in new capacity additions. Additionally, China's investment in natural gas pipelines for import and distribution to megacities for heating applications is also contributing to the market growth. The integration of digital intelligence and energy efficiency in control valves is further propelling the market forward, particularly in the energy & power industry as countries shift towards diverse energy sources.

Our researchers analyzed the data with 2023 as the base year, along with the key drivers, trends, and challenges. A holistic analysis of drivers will help companies refine their marketing strategies to gain a competitive advantage.

Market Driver

The rising investments in fluid handling is the key driver of the market. Control valves play a crucial role in various industries, including oil and gas and chemicals, in managing fluid flow and pressure. Actuators are integral components of control valves, enabling automatic positioning in response to process conditions. With the increasing focus on automation needs and alternative energy sources, investments in control valves have grown. In the oil and gas sector, aging infrastructure and the expansion of shale oil exploration and production projects necessitate the installation of new control valves. These valves are essential for maintaining the smooth flow of fluids during exploration, production, and transportation processes. In the chemicals industry, control valves undergo chemical treatment for optimal performance and longevity.

Overall, the demand for control valves, including ball valves and butterfly valves, is anticipated to grow significantly due to the ongoing development of new projects and the increasing importance of fluid handling technology.

Market Trends

The developments in control valve positioners are the upcoming trend in the market. Control valves have experienced notable advancements in design and functionality over the past few years. These valves are now more compact, offering enhanced shutoff capabilities and utilizing sophisticated sealing technologies. Enhanced resistance to corrosion and erosion, as well as improved anti-cavitation and noise-reducing trims, contribute to the superior performance of modern control valves.

Moreover, the introduction of advanced control valve positioners is a significant factor driving these improvements. Leveraging technology, smart and digital valve positioners have emerged, expanding their capabilities in various industries. With digital communication protocols gaining prominence, the functionalities of these intelligent and digital valves continue to evolve. In the context of aging infrastructure and the increasing adoption of alternative energy sources in industries like chemicals, the demand for automatic components, including control valves, automation, and chemical treatment, is on the rise.

Market Challenge

The fluctuations in raw material prices is a key challenge affecting the market growth. Control valves are essential automatic components in various industries, including the chemicals sector, to regulate the flow of fluids and gases. Actuators are used to automate the opening and closing of control valves, such as ball valves and butterfly valves, in response to changing process conditions. The aging infrastructure in several end-use industries necessitates the need for control valve upgrades and replacements. Alternative energy sources, such as wind and solar, are gaining popularity, leading to increased demand for control valves in power generation applications. Automation needs in these industries are driving the market growth for control valves. The manufacturing process of control valves involves the use of various raw materials, including copper, stainless steel, cast iron, aluminum, brass, and bronze.

Similarly, steel, particularly cast steel and forged steel, is widely used due to its strength and durability. High-temperature carbon steel, low-temperature carbon steel, and austenitic stainless steel are commonly used steel types in control valve manufacturing. Special metal grades, such as super austenitic stainless steel, duplex steel, and super duplex steel, are also utilized for specific applications due to their superior corrosion and chemical resistance. Raw material prices significantly impact control valve prices, making it a challenge for companies to maintain profit margins. Chemical treatment is also employed to enhance the performance and longevity of control valves.

Exclusive Customer Landscape

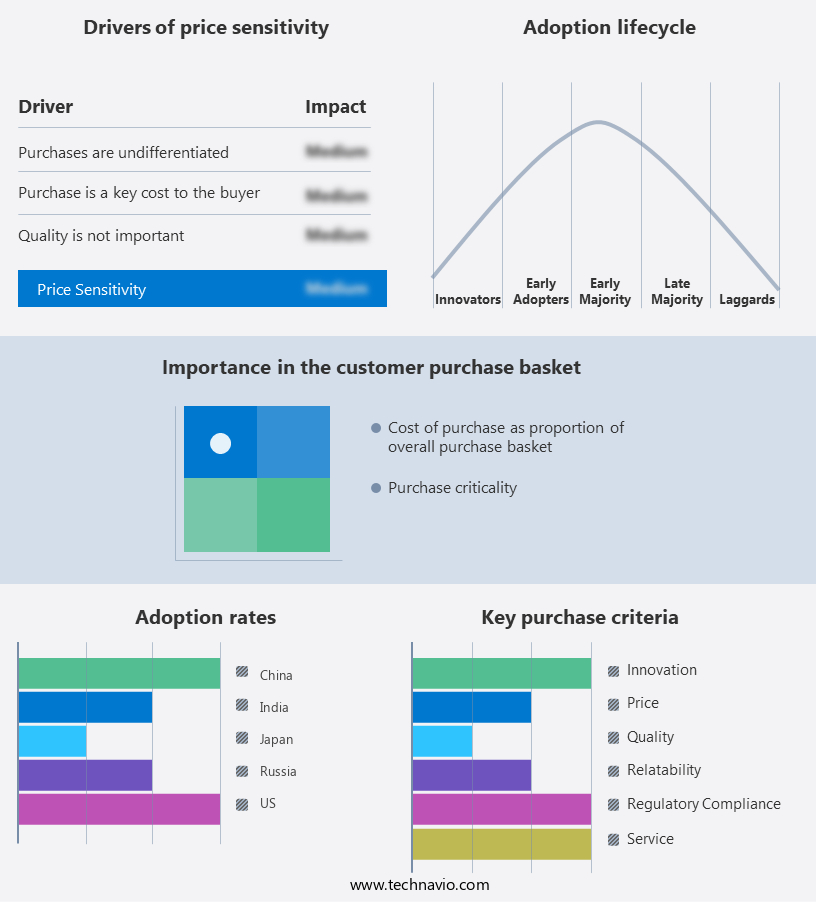
The market forecasting report includes the adoption lifecycle of the market, covering from the innovator's stage to the laggard's stage. It focuses on adoption rates in different regions based on penetration. Furthermore, the report also includes key purchase criteria and drivers of price sensitivity to help companies evaluate and develop their market growth analysis strategies.

Control Valves Market Share by Geography

 Customer Landscape

Key Companies & Market Insights

Companies are implementing various strategies, such as strategic alliances, partnerships, mergers and acquisitions, geographical expansion, and product/service launches, to enhance their presence in the market.

Alfa Laval AB: The company offers control valves such as LKC Non return Valve, LKC UltraPure, and LKUV 2 Air-relief Valve.

The market research and growth report includes detailed analyses of the competitive landscape of the market and information about key companies, including:

  • Avcon Controls Pvt. Ltd.
  • AVK Holding AS
  • Baker Hughes Co.
  • Bray International Inc.
  • Curtiss Wright Corp.
  • DFT Inc.
  • Emerson Electric Co.
  • Flowserve Corp.
  • Goodwin PLC
  • Honeywell International Inc.
  • IMI Hydronic Engineering Inc.
  • KSB SE and Co. KGaA
  • Parker Hannifin Corp.
  • SAMSON AG
  • Schlumberger Ltd.
  • Trillium Flow Technologies
  • Valmet Corp.
  • Valvitalia SpA
  • Watts Water Technologies Inc.

Qualitative and quantitative analysis of companies has been conducted to help clients understand the wider business environment as well as the strengths and weaknesses of key market players. Data is qualitatively analyzed to categorize companies as pure play, category-focused, industry-focused, and diversified; it is quantitatively analyzed to categorize companies as dominant, leading, strong, tentative, and weak.

Research Analyst Overview

The market is expected to witness significant growth due to the increasing automation needs in various industries, including energy & power and chemicals. The market is driven by the automation of fluid handling systems in power generation plants, oil & gas industry, and process plants. The aging infrastructure in emerging economies is providing financing opportunities for market growth. The market is segmented into actuator types, including pneumatic, electric, hydraulic, and others. The market includes automatic components such as ball valves, butterfly valves, diaphragm valves, gate valves, linear control valves, plug valves, rotary control valves, solenoid valves, and smart valve technology.

Furthermore, the market is influenced by factors such as energy efficiency, environmental legislation, and safety standards. High temperatures and pressure control requirements in industries such as oil & gas, petrochemicals, and pulp & paper are driving the demand for control valves. The market is also witnessing the adoption of digital intelligence, connected networks, and smart control valves in various applications. The market is further expected to grow due to the increasing demand for renewable energy and the expansion of desalination plants in water-scarce regions. The market is also witnessing the miniaturization of control valves for use in medical devices and liquid soap dispensers. A skilled workforce is essential for the installation, maintenance, and repair of control valves. The market is expected to face challenges from greenhouse gas emissions and increasing crude oil prices.

Market Scope

Report Coverage

Details

Page number

174

Base year

2023

Historic period

2018-2022

Forecast period

2024-2028

Growth momentum & CAGR

Accelerate at a CAGR of 5.33%

Market Growth 2024-2028

USD 2.77 billion

Market structure

Fragmented

YoY growth 2023-2024(%)

4.96

Regional analysis

APAC, Europe, North America, Middle East and Africa, and South America

Performing market contribution

APAC at 30%

Key countries

China, US, Russia, India, and Japan

Competitive landscape

Leading Companies, Market Positioning of Companies, Competitive Strategies, and Industry Risks

Key companies profiled

Alfa Laval AB, Avcon Controls Pvt. Ltd., AVK Holding AS, Baker Hughes Co., Bray International Inc., Curtiss Wright Corp., DFT Inc., Emerson Electric Co., Flowserve Corp., Goodwin PLC, Honeywell International Inc., IMI Hydronic Engineering Inc., KSB SE and Co. KGaA, Parker Hannifin Corp., SAMSON AG, Schlumberger Ltd., Trillium Flow Technologies, Valmet Corp., Valvitalia SpA, and Watts Water Technologies Inc.

Market dynamics

Parent market analysis, market growth inducers and obstacles, market forecast, fast-growing and slow-growing segment analysis, COVID-19 impact and recovery analysis and future consumer dynamics, market condition analysis for the forecast period

Customization purview

If our market report has not included the data that you are looking for, you can reach out to our analysts and get segments customized.

Request Free Sample

What are the Key Data Covered in this Market Research and Growth Report?

  • CAGR of the market during the forecast period
  • Detailed information on factors that will drive the market growth and forecasting between 2024 and 2028
  • Precise estimation of the size of the market  and its contribution of the market in focus to the parent market
  • Accurate predictions about upcoming market growth and trends and changes in consumer behaviour
  • Growth of the market across APAC, Europe, North America, Middle East and Africa, and South America
  • Thorough analysis of the market's competitive landscape and detailed information about companies
  • Comprehensive analysis of factors that will challenge the growth of market companies

We can help! Our analysts can customize this market research report to meet your requirements. Get in touch

1 Executive Summary

  • 1.1 Market overview
    • Executive Summary - Chart on Market Overview
    • Executive Summary - Data Table on Market Overview
    • Executive Summary - Chart on Global Market Characteristics
    • Executive Summary - Chart on Market by Geography
    • Executive Summary - Chart on Market Segmentation by Application
    • Executive Summary - Chart on Market Segmentation by Product
    • Executive Summary - Chart on Incremental Growth
    • Executive Summary - Data Table on Incremental Growth
    • Executive Summary - Chart on Company Market Positioning

2 Market Landscape

  • 2.1 Market ecosystem
    • Parent Market
    • Data Table on - Parent Market
  • 2.2 Market characteristics
    • Market characteristics analysis
  • 2.3 Value chain analysis
    • Value Chain Analysis

3 Market Sizing

  • 3.1 Market definition
    • Offerings of companies included in the market definition
  • 3.2 Market segment analysis
    • Market segments
  • 3.3 Market size 2023
    • 3.4 Market outlook: Forecast for 2023-2028
      • Chart on Global - Market size and forecast 2023-2028 ($ million)
      • Data Table on Global - Market size and forecast 2023-2028 ($ million)
      • Chart on Global Market: Year-over-year growth 2023-2028 (%)
      • Data Table on Global Market: Year-over-year growth 2023-2028 (%)

    4 Historic Market Size

    • 4.1 Global Control Valves Market 2018 - 2022
      • Historic Market Size - Data Table on Global Control Valves Market 2018 - 2022 ($ million)
    • 4.2 Application segment analysis 2018 - 2022
      • Historic Market Size - Application Segment 2018 - 2022 ($ million)
    • 4.3 Product segment analysis 2018 - 2022
      • Historic Market Size - Product Segment 2018 - 2022 ($ million)
    • 4.4 Geography segment analysis 2018 - 2022
      • Historic Market Size - Geography Segment 2018 - 2022 ($ million)
    • 4.5 Country segment analysis 2018 - 2022
      • Historic Market Size - Country Segment 2018 - 2022 ($ million)

    5 Five Forces Analysis

    • 5.1 Five forces summary
      • Five forces analysis - Comparison between 2023 and 2028
    • 5.2 Bargaining power of buyers
      • Bargaining power of buyers - Impact of key factors 2023 and 2028
    • 5.3 Bargaining power of suppliers
      • Bargaining power of suppliers - Impact of key factors in 2023 and 2028
    • 5.4 Threat of new entrants
      • Threat of new entrants - Impact of key factors in 2023 and 2028
    • 5.5 Threat of substitutes
      • Threat of substitutes - Impact of key factors in 2023 and 2028
    • 5.6 Threat of rivalry
      • Threat of rivalry - Impact of key factors in 2023 and 2028
    • 5.7 Market condition
      • Chart on Market condition - Five forces 2023 and 2028

    6 Market Segmentation by Application

    • 6.1 Market segments
      • Chart on Application - Market share 2023-2028 (%)
      • Data Table on Application - Market share 2023-2028 (%)
    • 6.2 Comparison by Application
      • Chart on Comparison by Application
      • Data Table on Comparison by Application
    • 6.3 Pneumatic - Market size and forecast 2023-2028
      • Chart on Pneumatic - Market size and forecast 2023-2028 ($ million)
      • Data Table on Pneumatic - Market size and forecast 2023-2028 ($ million)
      • Chart on Pneumatic - Year-over-year growth 2023-2028 (%)
      • Data Table on Pneumatic - Year-over-year growth 2023-2028 (%)
    • 6.4 Electrical - Market size and forecast 2023-2028
      • Chart on Electrical - Market size and forecast 2023-2028 ($ million)
      • Data Table on Electrical - Market size and forecast 2023-2028 ($ million)
      • Chart on Electrical - Year-over-year growth 2023-2028 (%)
      • Data Table on Electrical - Year-over-year growth 2023-2028 (%)
    • 6.5 Hydraulic - Market size and forecast 2023-2028
      • Chart on Hydraulic - Market size and forecast 2023-2028 ($ million)
      • Data Table on Hydraulic - Market size and forecast 2023-2028 ($ million)
      • Chart on Hydraulic - Year-over-year growth 2023-2028 (%)
      • Data Table on Hydraulic - Year-over-year growth 2023-2028 (%)
    • 6.6 Market opportunity by Application
      • Market opportunity by Application ($ million)
      • Data Table on Market opportunity by Application ($ million)

    7 Market Segmentation by Product

    • 7.1 Market segments
      • Chart on Product - Market share 2023-2028 (%)
      • Data Table on Product - Market share 2023-2028 (%)
    • 7.2 Comparison by Product
      • Chart on Comparison by Product
      • Data Table on Comparison by Product
    • 7.3 Sliding shaft - Market size and forecast 2023-2028
      • Chart on Sliding shaft - Market size and forecast 2023-2028 ($ million)
      • Data Table on Sliding shaft - Market size and forecast 2023-2028 ($ million)
      • Chart on Sliding shaft - Year-over-year growth 2023-2028 (%)
      • Data Table on Sliding shaft - Year-over-year growth 2023-2028 (%)
    • 7.4 Rotating shaft - Market size and forecast 2023-2028
      • Chart on Rotating shaft - Market size and forecast 2023-2028 ($ million)
      • Data Table on Rotating shaft - Market size and forecast 2023-2028 ($ million)
      • Chart on Rotating shaft - Year-over-year growth 2023-2028 (%)
      • Data Table on Rotating shaft - Year-over-year growth 2023-2028 (%)
    • 7.5 Market opportunity by Product
      • Market opportunity by Product ($ million)
      • Data Table on Market opportunity by Product ($ million)

    8 Customer Landscape

    • 8.1 Customer landscape overview
      • Analysis of price sensitivity, lifecycle, customer purchase basket, adoption rates, and purchase criteria

    9 Geographic Landscape

    • 9.1 Geographic segmentation
      • Chart on Market share by geography 2023-2028 (%)
      • Data Table on Market share by geography 2023-2028 (%)
    • 9.2 Geographic comparison
      • Chart on Geographic comparison
      • Data Table on Geographic comparison
    • 9.3 APAC - Market size and forecast 2023-2028
      • Chart on APAC - Market size and forecast 2023-2028 ($ million)
      • Data Table on APAC - Market size and forecast 2023-2028 ($ million)
      • Chart on APAC - Year-over-year growth 2023-2028 (%)
      • Data Table on APAC - Year-over-year growth 2023-2028 (%)
    • 9.4 Europe - Market size and forecast 2023-2028
      • Chart on Europe - Market size and forecast 2023-2028 ($ million)
      • Data Table on Europe - Market size and forecast 2023-2028 ($ million)
      • Chart on Europe - Year-over-year growth 2023-2028 (%)
      • Data Table on Europe - Year-over-year growth 2023-2028 (%)
    • 9.5 North America - Market size and forecast 2023-2028
      • Chart on North America - Market size and forecast 2023-2028 ($ million)
      • Data Table on North America - Market size and forecast 2023-2028 ($ million)
      • Chart on North America - Year-over-year growth 2023-2028 (%)
      • Data Table on North America - Year-over-year growth 2023-2028 (%)
    • 9.6 Middle East and Africa - Market size and forecast 2023-2028
      • Chart on Middle East and Africa - Market size and forecast 2023-2028 ($ million)
      • Data Table on Middle East and Africa - Market size and forecast 2023-2028 ($ million)
      • Chart on Middle East and Africa - Year-over-year growth 2023-2028 (%)
      • Data Table on Middle East and Africa - Year-over-year growth 2023-2028 (%)
    • 9.7 South America - Market size and forecast 2023-2028
      • Chart on South America - Market size and forecast 2023-2028 ($ million)
      • Data Table on South America - Market size and forecast 2023-2028 ($ million)
      • Chart on South America - Year-over-year growth 2023-2028 (%)
      • Data Table on South America - Year-over-year growth 2023-2028 (%)
    • 9.8 China - Market size and forecast 2023-2028
      • Chart on China - Market size and forecast 2023-2028 ($ million)
      • Data Table on China - Market size and forecast 2023-2028 ($ million)
      • Chart on China - Year-over-year growth 2023-2028 (%)
      • Data Table on China - Year-over-year growth 2023-2028 (%)
    • 9.9 US - Market size and forecast 2023-2028
      • Chart on US - Market size and forecast 2023-2028 ($ million)
      • Data Table on US - Market size and forecast 2023-2028 ($ million)
      • Chart on US - Year-over-year growth 2023-2028 (%)
      • Data Table on US - Year-over-year growth 2023-2028 (%)
    • 9.10 Russia - Market size and forecast 2023-2028
      • Chart on Russia - Market size and forecast 2023-2028 ($ million)
      • Data Table on Russia - Market size and forecast 2023-2028 ($ million)
      • Chart on Russia - Year-over-year growth 2023-2028 (%)
      • Data Table on Russia - Year-over-year growth 2023-2028 (%)
    • 9.11 India - Market size and forecast 2023-2028
      • Chart on India - Market size and forecast 2023-2028 ($ million)
      • Data Table on India - Market size and forecast 2023-2028 ($ million)
      • Chart on India - Year-over-year growth 2023-2028 (%)
      • Data Table on India - Year-over-year growth 2023-2028 (%)
    • 9.12 Japan - Market size and forecast 2023-2028
      • Chart on Japan - Market size and forecast 2023-2028 ($ million)
      • Data Table on Japan - Market size and forecast 2023-2028 ($ million)
      • Chart on Japan - Year-over-year growth 2023-2028 (%)
      • Data Table on Japan - Year-over-year growth 2023-2028 (%)
    • 9.13 Market opportunity by geography
      • Market opportunity by geography ($ million)
      • Data Tables on Market opportunity by geography ($ million)

    10 Drivers, Challenges, and Opportunity/Restraints

    • 10.1 Market drivers
      • 10.2 Market challenges
        • 10.3 Impact of drivers and challenges
          • Impact of drivers and challenges in 2023 and 2028
        • 10.4 Market opportunities/restraints

          11 Competitive Landscape

          • 11.1 Overview
            • 11.2 Competitive Landscape
              • Overview on criticality of inputs and factors of differentiation
            • 11.3 Landscape disruption
              • Overview on factors of disruption
            • 11.4 Industry risks
              • Impact of key risks on business

            12 Competitive Analysis

            • 12.1 Companies profiled
              • Companies covered
            • 12.2 Market positioning of companies
              • Matrix on companies position and classification
            • 12.3 Alfa Laval AB
              • Alfa Laval AB - Overview
              • Alfa Laval AB - Business segments
              • Alfa Laval AB - Key news
              • Alfa Laval AB - Key offerings
              • Alfa Laval AB - Segment focus
            • 12.4 Avcon Controls Pvt. Ltd.
              • Avcon Controls Pvt. Ltd. - Overview
              • Avcon Controls Pvt. Ltd. - Product / Service
              • Avcon Controls Pvt. Ltd. - Key offerings
            • 12.5 AVK Holding AS
              • AVK Holding AS - Overview
              • AVK Holding AS - Product / Service
              • AVK Holding AS - Key offerings
            • 12.6 Baker Hughes Co.
              • Baker Hughes Co. - Overview
              • Baker Hughes Co. - Business segments
              • Baker Hughes Co. - Key news
              • Baker Hughes Co. - Key offerings
              • Baker Hughes Co. - Segment focus
            • 12.7 Bray International Inc.
              • Bray International Inc. - Overview
              • Bray International Inc. - Product / Service
              • Bray International Inc. - Key offerings
            • 12.8 Curtiss Wright Corp.
              • Curtiss Wright Corp. - Overview
              • Curtiss Wright Corp. - Business segments
              • Curtiss Wright Corp. - Key news
              • Curtiss Wright Corp. - Key offerings
              • Curtiss Wright Corp. - Segment focus
            • 12.9 DFT Inc.
              • DFT Inc. - Overview
              • DFT Inc. - Product / Service
              • DFT Inc. - Key offerings
            • 12.10 Emerson Electric Co.
              • Emerson Electric Co. - Overview
              • Emerson Electric Co. - Business segments
              • Emerson Electric Co. - Key news
              • Emerson Electric Co. - Key offerings
              • Emerson Electric Co. - Segment focus
            • 12.11 Flowserve Corp.
              • Flowserve Corp. - Overview
              • Flowserve Corp. - Business segments
              • Flowserve Corp. - Key news
              • Flowserve Corp. - Key offerings
              • Flowserve Corp. - Segment focus
            • 12.12 Goodwin PLC
              • Goodwin PLC - Overview
              • Goodwin PLC - Business segments
              • Goodwin PLC - Key offerings
              • Goodwin PLC - Segment focus
            • 12.13 Honeywell International Inc.
              • Honeywell International Inc. - Overview
              • Honeywell International Inc. - Business segments
              • Honeywell International Inc. - Key news
              • Honeywell International Inc. - Key offerings
              • Honeywell International Inc. - Segment focus
            • 12.14 IMI Hydronic Engineering Inc.
              • IMI Hydronic Engineering Inc. - Overview
              • IMI Hydronic Engineering Inc. - Product / Service
              • IMI Hydronic Engineering Inc. - Key offerings
            • 12.15 KSB SE and Co. KGaA
              • KSB SE and Co. KGaA - Overview
              • KSB SE and Co. KGaA - Business segments
              • KSB SE and Co. KGaA - Key offerings
              • KSB SE and Co. KGaA - Segment focus
            • 12.16 Parker Hannifin Corp.
              • Parker Hannifin Corp. - Overview
              • Parker Hannifin Corp. - Business segments
              • Parker Hannifin Corp. - Key news
              • Parker Hannifin Corp. - Key offerings
              • Parker Hannifin Corp. - Segment focus
            • 12.17 Watts Water Technologies Inc.
              • Watts Water Technologies Inc. - Overview
              • Watts Water Technologies Inc. - Product / Service
              • Watts Water Technologies Inc. - Key offerings

            13 Appendix

            • 13.1 Scope of the report
              • 13.2 Inclusions and exclusions checklist
                • Inclusions checklist
                • Exclusions checklist
              • 13.3 Currency conversion rates for US$
                • Currency conversion rates for US$
              • 13.4 Research methodology
                • Research methodology
              • 13.5 Data procurement
                • Information sources
              • 13.6 Data validation
                • Data validation
              • 13.7 Validation techniques employed for market sizing
                • Validation techniques employed for market sizing
              • 13.8 Data synthesis
                • Data synthesis
              • 13.9 360 degree market analysis
                • 360 degree market analysis
              • 13.10 List of abbreviations
                • List of abbreviations

              Research Methodology

              Technavio presents a detailed picture of the market by way of study, synthesis, and summation of data from multiple sources. The analysts have presented the various facets of the market with a particular focus on identifying the key industry influencers. The data thus presented is comprehensive, reliable, and the result of extensive research, both primary and secondary.

              INFORMATION SOURCES

              Primary sources

              • Manufacturers and suppliers
              • Channel partners
              • Industry experts
              • Strategic decision makers

              Secondary sources

              • Industry journals and periodicals
              • Government data
              • Financial reports of key industry players
              • Historical data
              • Press releases

              DATA ANALYSIS

              Data Synthesis

              • Collation of data
              • Estimation of key figures
              • Analysis of derived insights

              Data Validation

              • Triangulation with data models
              • Reference against proprietary databases
              • Corroboration with industry experts

              REPORT WRITING

              Qualitative

              • Market drivers
              • Market challenges
              • Market trends
              • Five forces analysis

              Quantitative

              • Market size and forecast
              • Market segmentation
              • Geographical insights
              • Competitive landscape

              Interested in this report?

              Get your sample now to see our research methodology and insights!

              Download Now

              Frequently Asked Questions

              Control Valves market growth will increase by $ 2770.3 mn during 2024-2028.

              The Control Valves market is expected to grow at a CAGR of 5.33% during 2024-2028.

              Control Valves market is segmented by Application( Pneumatic, Electrical, Hydraulic) Product( Sliding shaft, Rotating shaft, Hydraulic)

              Alfa Laval AB, Avcon Controls Pvt. Ltd., AVK Holding AS, Baker Hughes Co., Bray International Inc., Curtiss Wright Corp., DFT Inc., Emerson Electric Co., Flowserve Corp., Goodwin PLC, Honeywell International Inc., IMI Hydronic Engineering Inc., KSB SE and Co. KGaA, Parker Hannifin Corp., SAMSON AG, Schlumberger Ltd., Trillium Flow Technologies, Valmet Corp., Valvitalia SpA, Watts Water Technologies Inc. are a few of the key vendors in the Control Valves market.

              APAC will register the highest growth rate of 30% among the other regions. Therefore, the Control Valves market in APAC is expected to garner significant business opportunities for the vendors during the forecast period.

              China, US, Russia, India, Japan

              • Rising investments in fluid handlingGlobally is the driving factor this market.
              • investments in fluid handling technology have been on the rise in industries such as oil and gas and water and wastewater. The shale oil boom in North America has resulted in high demand for fluid handling equipment and components such as control valves. These control valves are required to control the shale oil exploration and production process as well as to maintain the smooth flow of shale oil while transporting it through pipelines. The commencement of new upstream oil and gas exploration projects is expected to drive demand for control valves in the oil and gas industry. In the US is the driving factor this market.
              • the new shale oil projects under development will require the construction of new pipelines for transporting the shale oil. These new shale oil and gas pipelines are expected to come online during the initial years of the forecast period is the driving factor this market.
              • thus spurring the demand for control valves in the midstream sector of the oil and gas industry.The water and wastewater industry is another major end-user of fluid handling technology owing to the growing stringency of the regulations on clean and pre-treated water. New water and wastewater treatment projects are in progress globally is the driving factor this market.
              • with North America is the driving factor this market.
              • APAC is the driving factor this market.
              • and the Middle East leading the charge for new water and wastewater projects. In North America is the driving factor this market.
              • the industry is driven by the need to revive and revamp its water and wastewater infrastructure is the driving factor this market.
              • while in regions such as Asia and Latin America is the driving factor this market.
              • additional water and wastewater projects are necessary to cater to the growing demand for water. Thus is the driving factor this market.
              • the demand for control valve is expected surge which will fuel the growth of the global market in focus during forecast period. is the driving factor this market.

              The Control Valves market vendors should focus on grabbing business opportunities from the Pneumatic segment as it accounted for the largest market share in the base year.