
Base Editing Market Size 2025-2029
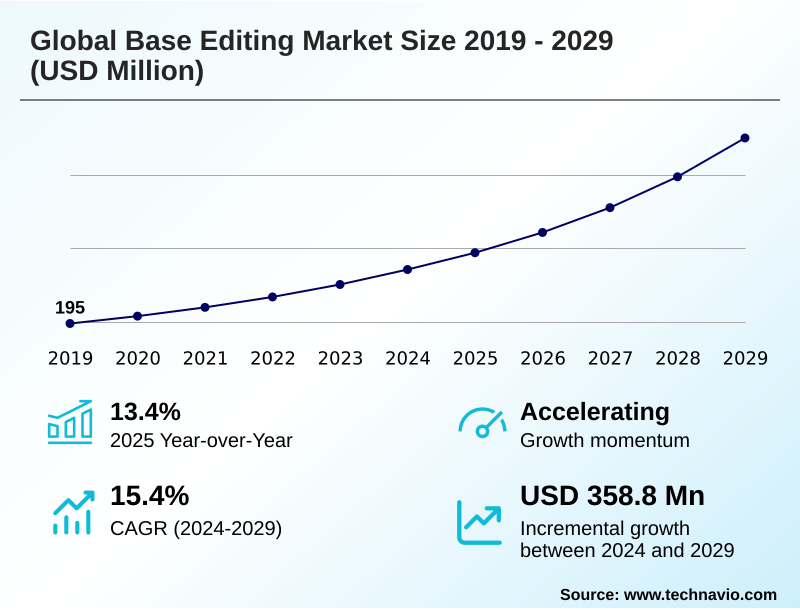
The base editing market size is valued to increase by USD 358.8 million, at a CAGR of 15.4% from 2024 to 2029. Increasing prevalence of genetic disorders and unmet medical needs will drive the base editing market.
Major Market Trends & Insights
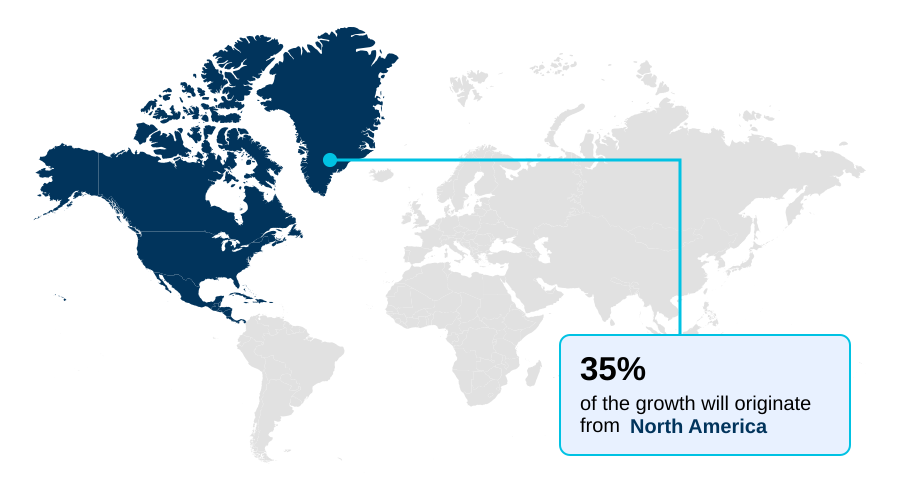
- North America dominated the market and accounted for a 35.2% growth during the forecast period.
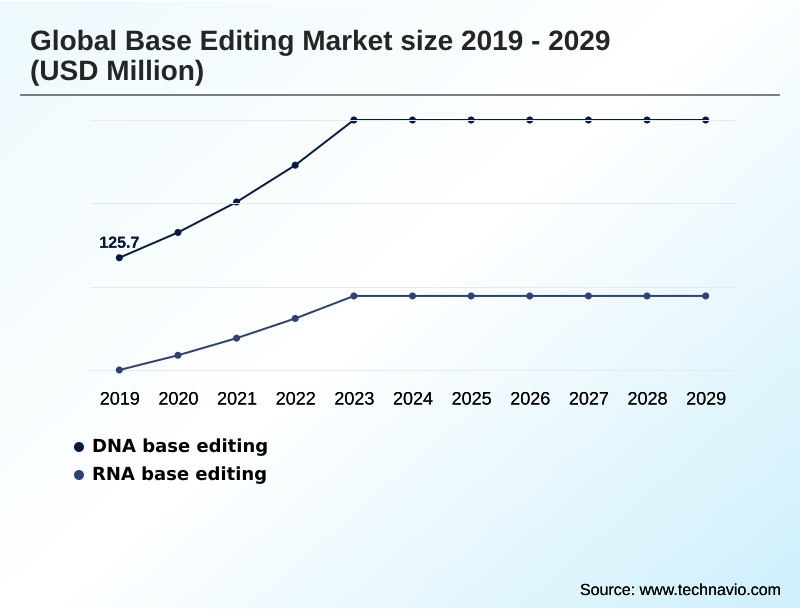
- By Type - DNA base editing segment was valued at USD 194.9 million in 2023
- By Application - Drug discovery and development segment accounted for the largest market revenue share in 2023
Market Size & Forecast
- Market Opportunities: USD 506 million
- Market Future Opportunities: USD 358.8 million
- CAGR from 2024 to 2029 : 15.4%
Market Summary
- The base editing market is advancing from a niche scientific tool to a cornerstone of modern therapeutic development. This evolution is propelled by the technology's capacity for making precise single-point mutations without causing dna double-strand breaks, a significant safety advantage over earlier methods.
- Key industry drivers include the vast unmet need for curative treatments for monogenic diseases and rising investment in genomic medicine. A primary trend is the expansion from rare disorders to prevalent conditions like cardiovascular disease, enabled by innovations in in vivo therapies.
- For instance, a business scenario involves optimizing supply chain logistics for ex vivo therapies, where patient-specific cell processing requires complex cryopreservation techniques and just-in-time delivery to clinical sites, a hurdle that scalable in vivo approaches using non-viral vectors aim to overcome.
- However, the field faces challenges in minimizing off-target effects and navigating stringent cmc requirements for manufacturing, which can extend development timelines and elevate costs, impacting the overall reimbursement landscape.
What will be the Size of the Base Editing Market during the forecast period?
Get Key Insights on Market Forecast (PDF) Get Free Sample
How is the Base Editing Market Segmented?
The base editing industry research report provides comprehensive data (region-wise segment analysis), with forecasts and estimates in "USD million" for the period 2025-2029, as well as historical data from 2019-2023 for the following segments.
- Type
- DNA base editing
- RNA base editing
- Application
- Drug discovery and development
- Agriculture
- Veterinary
- End-user
- Academic and research institutes
- Contract research organizations
- Pharmaceutical and biotechnology
- Geography
- North America
- US
- Canada
- Mexico
- Europe
- Germany
- UK
- France
- Asia
- Rest of World (ROW)
- North America
By Type Insights
The dna base editing segment is estimated to witness significant growth during the forecast period.
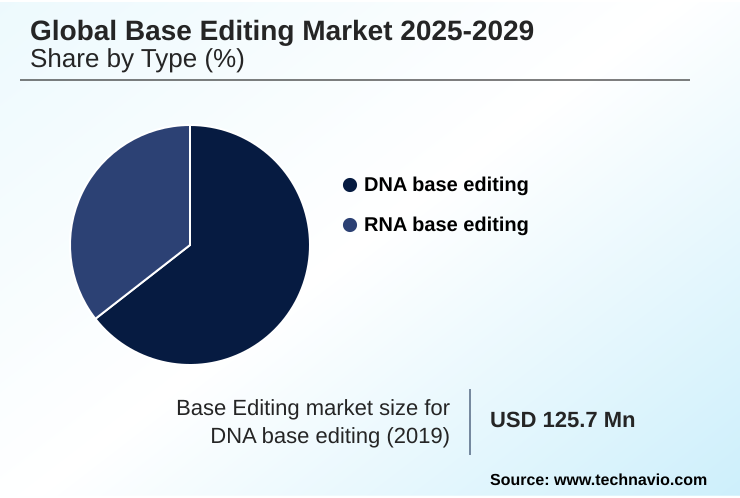
The base editing market is segmented by core technological approaches, including DNA base editing for permanent genomic alteration and RNA base editing for transient effects.
The therapeutic development pipeline prioritizes DNA-based methods for genetic disorder correction, particularly in rare disease treatment. These platforms leverage a modified crispr-cas9 system where a deaminase enzyme performs precise nucleotide conversion, bypassing the risks of older gene-editing techniques.
The intellectual property landscape is complex, requiring extensive preclinical safety studies before advancing candidates.
Innovations in transient rna editing, which can be applied and reversed, are expanding the scope of drug discovery and development, with some platforms improving on-target fidelity by over 15% compared to initial iterations.
The DNA base editing segment was valued at USD 194.9 million in 2023 and showed a gradual increase during the forecast period.
Regional Analysis
North America is estimated to contribute 35.2% to the growth of the global market during the forecast period.Technavio’s analysts have elaborately explained the regional trends and drivers that shape the market during the forecast period.
See How Base Editing Market Demand is Rising in North America Get Free Sample
The geographic landscape is led by North America, which accounts for over 35% of incremental growth, driven by a mature regulatory approval pathway and a favorable reimbursement landscape navigation.
Europe follows, with Asia projected to be the fastest-growing region, with a growth rate nearly 2% higher than Europe's, fueled by escalating investment in biotechnology. Regional success hinges on navigating distinct operational challenges.
In established markets, research focuses on advanced applications like pcsk9 gene silencing and mitochondrial base editing, using pharmacodynamic biomarkers for validation. In emerging regions, the focus is on building infrastructure for biodistribution analysis and cell line engineering.
Across all geographies, improving on-target efficiency and ensuring a predictable regulatory outcome are universal priorities shaping investment and partnership strategies.
Market Dynamics
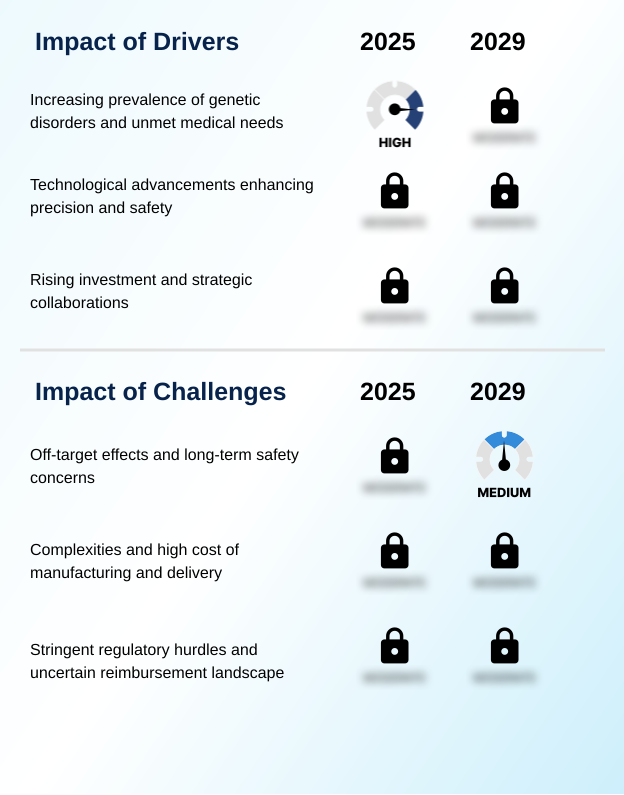
Our researchers analyzed the data with 2024 as the base year, along with the key drivers, trends, and challenges. A holistic analysis of drivers will help companies refine their marketing strategies to gain a competitive advantage.
- The strategic focus of the base editing market is rapidly expanding, driven by the profound potential to address a wide spectrum of diseases. Initial efforts have concentrated on curative approaches for monogenic conditions, with significant progress in base editing for sickle cell anemia and base editing for beta-thalassemia.
- Concurrently, the field is tackling more prevalent conditions through in vivo base editing for liver disease and exploring base editing in cardiovascular disease, highlighted by the durable silencing of the pcsk9 gene. The technological underpinnings are also advancing at a remarkable pace.
- The use of ai in base editor guide rna design is accelerating development, capable of reducing optimization timelines by up to six months compared to traditional screening. Innovations include adenine base editors for point mutations, cytosine base editors for gene correction, and dual base editors for multiple edits.
- The non-viral delivery of base editors and the development of mitochondrial dna base editing therapy are opening new frontiers. However, significant hurdles remain, chief among them being the challenges in base editing manufacturing and establishing robust cmc for base editing products.
- Ensuring base editing safety and off-target analysis is paramount for navigating regulatory pathways for gene therapies, which also scrutinize the cost-effectiveness of base editing. Beyond human health, base editing for agricultural crops promises to enhance food security, while advanced techniques like epigenome editing with base editors and allogeneic car-t cell engineering are redefining therapeutic possibilities.
What are the key market drivers leading to the rise in the adoption of Base Editing Industry?
- The market is fundamentally driven by the increasing prevalence of genetic disorders and the significant unmet medical needs of affected patient populations worldwide.
- Market growth is fundamentally propelled by technological advancements that enhance precision and expand therapeutic reach.
- The ability to correct single-point mutations with high on-target efficiency, a feat that is a challenge for approaches reliant on standard cas9 nuclease activity, addresses the root cause of thousands of genetic disorders.
- Continuous protein engineering yields novel platforms, such as dual-function editors, that increase the scope of addressable targets. The precise design of guide rna, accelerated by high-throughput screening methods that can vet candidates 50% faster than manual techniques, is crucial.
- This precision avoids the unintended consequences of dna double-strand breaks, a critical factor driving adoption in cardiovascular disease therapy.
- Furthermore, applications in agricultural trait enhancement and veterinary genetic medicine are creating diverse revenue streams, supported by a robust clinical trial execution and target validation infrastructure.
What are the market trends shaping the Base Editing Industry?
- A significant market trend is the strategic pivot toward in vivo therapeutic approaches. This shift is increasingly coupled with the adoption of non-viral delivery platforms.
- Key market trends are reshaping the therapeutic landscape, driven by a strategic shift toward in vivo therapies that promise broader applicability than traditional ex vivo methods. This transition is enabled by advances in non-viral vectors, particularly lipid nanoparticles, which have shown a 40% improvement in delivery efficiency to specific tissues compared to earlier systems.
- These aav delivery systems and mrna-based editors are critical for the advancement of genomic medicine. Another significant trend is the expansion into oncology cell therapy, where base editing is used to create next-generation allogeneic car-t cells, a key part of the allogeneic cell therapies pipeline. This complex development requires sophisticated gmp manufacturing scale-up and supply chain logistics.
- Furthermore, the use of a novel epigenome editor to achieve durable gene silencing represents a leap in technological capability, with potential applications for infectious disease targets.
What challenges does the Base Editing Industry face during its growth?
- A primary challenge affecting industry growth is the persistent concern over potential off-target effects and the unknown long-term safety of permanent genomic alterations.
- Significant challenges related to safety and manufacturing complexity constrain market expansion. The primary concern revolves around unintended genomic alterations, including off-target effects and bystander mutations within the editing window, which necessitates rigorous toxicology assessment. The immunogenicity risk profile of delivery systems and the ribonucleoprotein complex is also under intense scrutiny.
- For ex vivo therapies, the reliance on complex aseptic processing and cryopreservation techniques results in manufacturing costs that can be ten times higher than for conventional biologics. These complexities create a high bar for cmc requirements and demand sophisticated quality control assays to ensure product consistency and safety.
- Overcoming these hurdles is essential for scalable production and broader patient access, as they directly impact development timelines and final product cost.
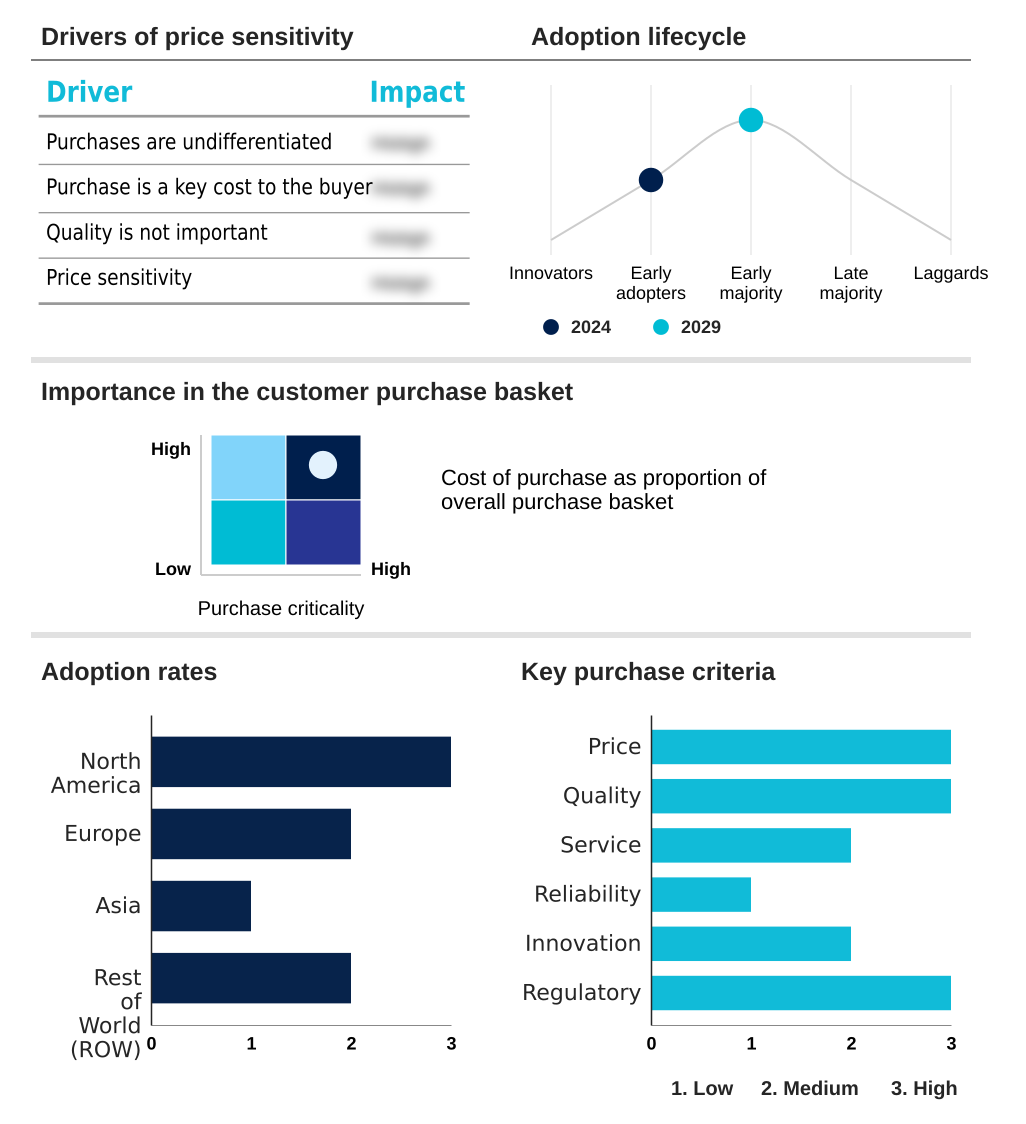
Exclusive Technavio Analysis on Customer Landscape
The base editing market forecasting report includes the adoption lifecycle of the market, covering from the innovator’s stage to the laggard’s stage. It focuses on adoption rates in different regions based on penetration. Furthermore, the base editing market report also includes key purchase criteria and drivers of price sensitivity to help companies evaluate and develop their market growth analysis strategies.
Customer Landscape of Base Editing Industry
Competitive Landscape
Companies are implementing various strategies, such as strategic alliances, base editing market forecast, partnerships, mergers and acquisitions, geographical expansion, and product/service launches, to enhance their presence in the industry.
Beam Therapeutics Inc. - Pioneering precision genetic medicines, the firm's proprietary base editing platforms enable single-base DNA changes to develop therapies for critical genetic disorders.
The industry research and growth report includes detailed analyses of the competitive landscape of the market and information about key companies, including:
- Beam Therapeutics Inc.
- Bio Palette Co., Ltd.
- Cellectis
- Creative Biogene
- Danaher Corp.
- EdiGene Inc.
- ElevateBio
- Genkore
- GenScript Biotech Corp.
- Intellia Therapeutics Inc.
- KROMATID
- Maravai LifeSciences Holdings Inc.
- Merck KGaA
- Pairwise
- PerkinElmer US LLC
- Qi Biodesign Technology
- ShapeTX
Qualitative and quantitative analysis of companies has been conducted to help clients understand the wider business environment as well as the strengths and weaknesses of key industry players. Data is qualitatively analyzed to categorize companies as pure play, category-focused, industry-focused, and diversified; it is quantitatively analyzed to categorize companies as dominant, leading, strong, tentative, and weak.
Recent Development and News in Base editing market
- In September 2024, Beam Therapeutics Inc. announced a strategic collaboration with a major pharmaceutical company to co-develop and co-commercialize its in vivo base editing candidate for Alpha-1 Antitrypsin Deficiency, involving a $300 million upfront payment.
- In November 2024, Intellia Therapeutics Inc. received Fast Track Designation from the US Food and Drug Administration (FDA) for its lead ex vivo TCR-T cell therapy candidate, developed using its proprietary base editing platform for treating acute myeloid leukemia.
- In February 2025, Merck KGaA launched a new portfolio of GMP-grade adenine and cytosine base editors through its life science division, providing researchers with high-purity, ready-to-use tools for clinical applications.
- In April 2025, Danaher Corp. announced the acquisition of a privately-held startup specializing in novel lipid nanoparticle (LNP) delivery systems optimized for base editing payloads for approximately $550 million, strengthening its position in the gene therapy manufacturing ecosystem.
Dive into Technavio’s robust research methodology, blending expert interviews, extensive data synthesis, and validated models for unparalleled Base Editing Market insights. See full methodology.
| Market Scope | |
|---|---|
| Page number | 284 |
| Base year | 2024 |
| Historic period | 2019-2023 |
| Forecast period | 2025-2029 |
| Growth momentum & CAGR | Accelerate at a CAGR of 15.4% |
| Market growth 2025-2029 | USD 358.8 million |
| Market structure | Fragmented |
| YoY growth 2024-2025(%) | 13.4% |
| Key countries | US, Canada, Mexico, Germany, UK, France, Italy, The Netherlands, Spain, Russia, China, Japan, India, South Korea, Indonesia, Thailand, Singapore, Australia, UAE, Brazil, South Africa, Saudi Arabia and Turkey |
| Competitive landscape | Leading Companies, Market Positioning of Companies, Competitive Strategies, and Industry Risks |
Research Analyst Overview
- The base editing market represents a paradigm shift in genetic medicine, defined by its precision in engineering single-point mutations at the nucleotide level. Unlike the foundational crispr-cas9 system, which induces dna double-strand breaks that can lead to genomic rearrangements, base editing utilizes a deaminase enzyme fused to a cas9 nuclease to achieve direct nucleotide conversion.
- This method's high on-target efficiency within a specific editing window is a core value proposition. The technology is advancing rapidly through protein engineering, leading to dual-function editors and mrna-based editors delivered as a ribonucleoprotein complex. Key applications include in vivo therapies using non-viral vectors like lipid nanoparticles for permanent genomic alteration, and ex vivo therapies for cell modification.
- A major focus is minimizing off-target effects and bystander mutations, as achieving a safety profile with over 99% specificity is a critical factor for boardroom decisions regarding investment in clinical progression. This precision directly impacts regulatory compliance and budgeting for long-term safety monitoring, making it a central element of strategic planning.
What are the Key Data Covered in this Base Editing Market Research and Growth Report?
-
What is the expected growth of the Base Editing Market between 2025 and 2029?
-
USD 358.8 million, at a CAGR of 15.4%
-
-
What segmentation does the market report cover?
-
The report is segmented by Type (DNA base editing, and RNA base editing), Application (Drug discovery and development, Agriculture, and Veterinary), End-user (Academic and research institutes, Contract research organizations, and Pharmaceutical and biotechnology) and Geography (North America, Europe, Asia, Rest of World (ROW))
-
-
Which regions are analyzed in the report?
-
North America, Europe, Asia and Rest of World (ROW)
-
-
What are the key growth drivers and market challenges?
-
Increasing prevalence of genetic disorders and unmet medical needs, Off-target effects and long-term safety concerns
-
-
Who are the major players in the Base Editing Market?
-
Beam Therapeutics Inc., Bio Palette Co., Ltd., Cellectis, Creative Biogene, Danaher Corp., EdiGene Inc., ElevateBio, Genkore, GenScript Biotech Corp., Intellia Therapeutics Inc., KROMATID, Maravai LifeSciences Holdings Inc., Merck KGaA, Pairwise, PerkinElmer US LLC, Qi Biodesign Technology and ShapeTX
-
Market Research Insights
- The market's momentum is contingent on navigating a complex operational landscape. Success in therapeutic development requires mastery of preclinical safety studies and a clear regulatory approval pathway, where a low immunogenicity risk profile is critical. For instance, innovations in non-viral delivery have demonstrated a 30% reduction in immunogenicity compared to some viral vectors.
- In manufacturing, gmp manufacturing scale-up is a primary focus, with process analytical technology improving batch consistency by over 20%. The high cost of goods, however, necessitates strategic reimbursement landscape navigation and robust quality control assays.
- These factors directly influence the clinical trial execution and the viability of the entire supply chain logistics, where effective cryopreservation techniques are paramount for ex vivo products.
We can help! Our analysts can customize this base editing market research report to meet your requirements.
 RIA -
RIA - 
