Battery Raw Materials Market Analysis, Size, and Forecast 2026-2030: APAC (China, South Korea, and Japan), North America (US, Canada, and Mexico), Europe (Germany, France, and UK), South America (Brazil, Argentina, and Colombia), Middle East and Africa (Saudi Arabia, UAE, and South Africa), and Rest of World (ROW)

Battery Raw Materials Market Analysis, Size, and Forecast 2026-2030:
APAC (China, South Korea, and Japan), North America (US, Canada, and Mexico), Europe (Germany, France, and UK), South America (Brazil, Argentina, and Colombia), Middle East and Africa (Saudi Arabia, UAE, and South Africa), and Rest of World (ROW)

Published: Dec 2025 302 Pages SKU: IRTNTR81225

Market Overview at a Glance

$30.62 B
Market Opportunity
8.1%
CAGR 2025 - 2030
46.8%
APAC Growth
$23.84 B
Cathodes materials segment 2024

Battery Raw Materials Market Size 2026-2030

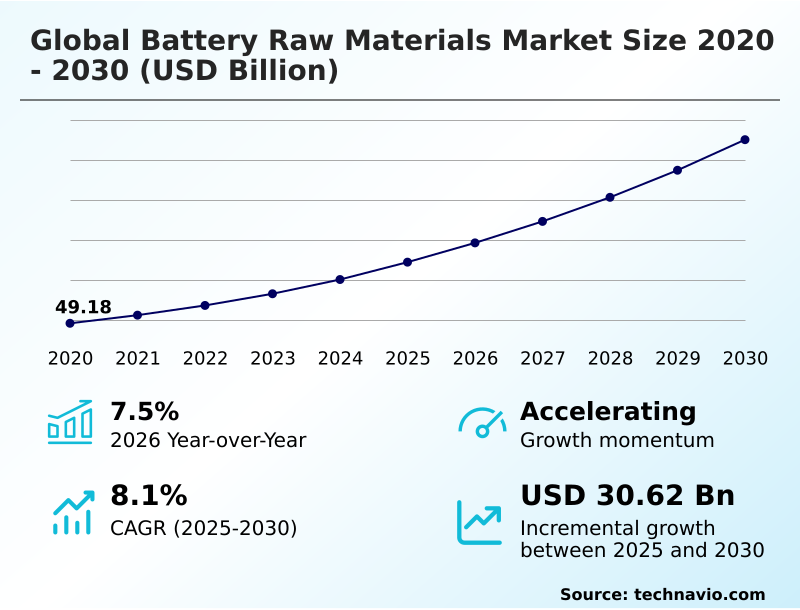
The battery raw materials market size is valued to increase by USD 30.62 billion, at a CAGR of 8.1% from 2025 to 2030. Global policy mandates and accelerated electrification of transport will drive the battery raw materials market.

Major Market Trends & Insights

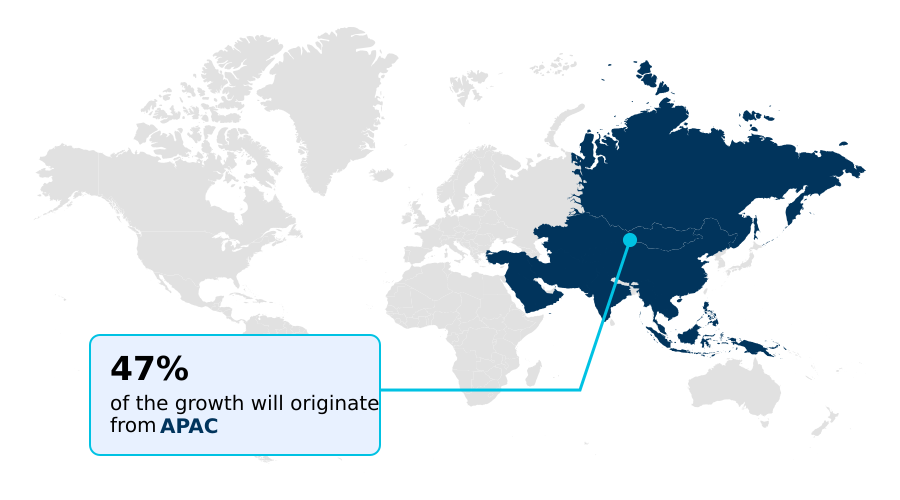
  • APAC dominated the market and accounted for a 46.8% growth during the forecast period.
  • By Material - Cathodes materials segment was valued at USD 23.84 billion in 2024
  • By Application - Lead-acid battery segment accounted for the largest market revenue share in 2024

Market Size & Forecast

  • Market Opportunities: USD 45.90 billion
  • Market Future Opportunities: USD 30.62 billion
  • CAGR from 2025 to 2030 : 8.1%

Market Summary

  • The battery raw materials market is undergoing a period of intense transformation, driven by the global transition to electrification. The unprecedented demand for key minerals such as lithium, nickel, and cobalt is compelling a structural realignment of supply chains.
  • A central theme is the strategic pivot from transactional procurement to deep-seated partnerships and vertical integration, where automotive OEMs are directly investing in mining and refining to de-risk production pipelines. For instance, an automaker might secure a long-term offtake agreement for lithium carbonate to hedge against extreme price volatility, a move critical for maintaining stable EV pricing and production schedules.
  • This landscape is further shaped by technological diversification, with lithium iron phosphate (LFP) chemistries gaining ground for their cost and safety benefits, altering the demand profile for specific metals. Concurrently, geopolitical tensions are fostering resource nationalism and a push for regionalized supply networks, challenging the established global trade flows.
  • The industry also grapples with intense ESG scrutiny, making ethical sourcing and the development of a circular economy through recycling essential for long-term operational viability and market acceptance. This dynamic environment requires market participants to navigate complex trade policies, technological shifts, and sustainability mandates.

What will be the Size of the Battery Raw Materials Market during the forecast period?

Get Key Insights on Market Forecast (PDF) Request Free Sample

How is the Battery Raw Materials Market Segmented?

The battery raw materials industry research report provides comprehensive data (region-wise segment analysis), with forecasts and estimates in "USD million" for the period 2026-2030, as well as historical data from 2020-2024 for the following segments.

  • Material
    • Cathodes materials
    • Anodes materials
    • Electrolyte materials
    • Others
  • Application
    • Lead-acid battery
    • Lithium-ion battery
    • Others
  • End-user
    • Secondary batteries
    • Primary batteries
  • Geography
    • APAC
      • China
      • South Korea
      • Japan
    • North America
      • US
      • Canada
      • Mexico
    • Europe
      • Germany
      • France
      • UK
    • South America
      • Brazil
      • Argentina
      • Colombia
    • Middle East and Africa
      • Saudi Arabia
      • UAE
      • South Africa
    • Rest of World (ROW)

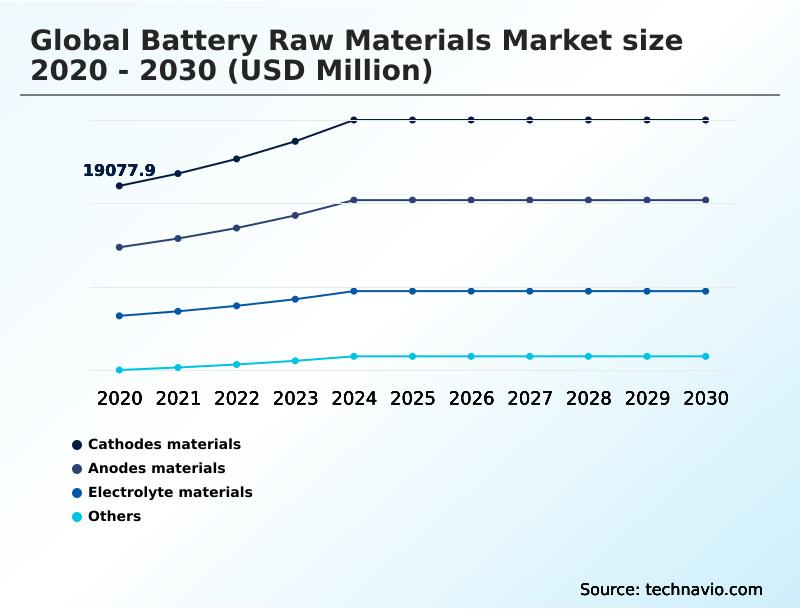
By Material Insights

The cathodes materials segment is estimated to witness significant growth during the forecast period.

The market is segmented by material, with cathodes representing the most critical segment.

The performance of cathode active materials (CAM) dictates battery cost and energy density, with a notable industry split between high-purity nickel chemistries like nickel-manganese-cobalt (NMC) and iron-based alternatives.

Ensuring ethical sourcing standards for inputs like battery-grade cobalt is paramount, driven by battery passport regulation. Advanced hydrometallurgical recycling is emerging as a crucial source of secondary raw materials, with facilities demonstrating over 95% recovery rates.

Other segments include anodes, where silicon-carbon composites are being developed to boost capacity, and electrolytes, where compounds like lithium hexafluorophosphate (LiPF6) are essential for ionic conductivity and overall cell stability.

Request Free Sample

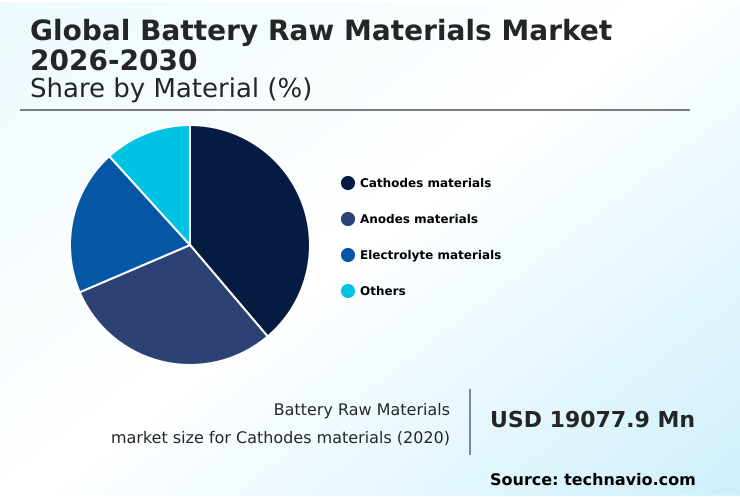
The Cathodes materials segment was valued at USD 23.84 billion in 2024 and showed a gradual increase during the forecast period.

Request Free Sample

Regional Analysis

APAC is estimated to contribute 46.8% to the growth of the global market during the forecast period.Technavio’s analysts have elaborately explained the regional trends and drivers that shape the market during the forecast period.

See How Battery Raw Materials Market Demand is Rising in APAC Request Free Sample

The geographic landscape is defined by strategic realignment. APAC continues to dominate midstream anode material graphitization and downstream processing capacity, but resource nationalism impacts are forcing diversification.

In contrast, North America and Europe are rapidly building regional supply chains, guided by policies like the critical raw materials act to mitigate geopolitical supply risk.

This has spurred massive capital expenditure in mining and refining, with a focus on developing local sources of nickel sulphate and spodumene concentrate.

For instance, investments in North American projects aim to increase domestic processing by over 40% in the coming years.

Technologies like high-pressure acid leaching (HPAL) in Indonesia and advanced raw material traceability systems are becoming standard, ensuring feedstock security across these evolving regional hubs.

Market Dynamics

Our researchers analyzed the data with 2025 as the base year, along with the key drivers, trends, and challenges. A holistic analysis of drivers will help companies refine their marketing strategies to gain a competitive advantage.

  • Strategic decision-making in the battery raw materials market now revolves around a complex matrix of interconnected factors, as highlighted by an lfp vs nmc cathode material cost analysis, which often dictates OEM platform choices. The long-term outlook is heavily influenced by solid-state battery raw material requirements, pushing R&D toward novel materials.
  • Concurrently, advancements in black mass recycling technology are becoming central to supply strategies, with some firms reporting recovery rates over 20% higher than older methods, thereby enhancing the circular economy models for ev batteries. However, significant headwinds persist, including geopolitical risks in cobalt supply chains and graphite anode supply chain vulnerabilities.
  • The impact of ira on battery material sourcing is forcing a regionalization of supply, while regulatory hurdles for new mine development continue to delay projects. Automaker investment in upstream mining is a direct response to these pressures, aiming to improve supply chain resilience for critical minerals.
  • Debates over direct lithium extraction vs solar evaporation and the sustainability of lithium brine extraction reflect intense esg factors in raw material procurement. The price volatility effects on battery oems are profound, complicating capital investment for greenfield mining projects and highlighting the logistical challenges in mineral transport.
  • Ultimately, technological diversification in battery chemistries, such as sodium-ion battery commercial viability and overcoming challenges in nickel laterite processing, will determine the market's future structure.

What are the key market drivers leading to the rise in the adoption of Battery Raw Materials Industry?

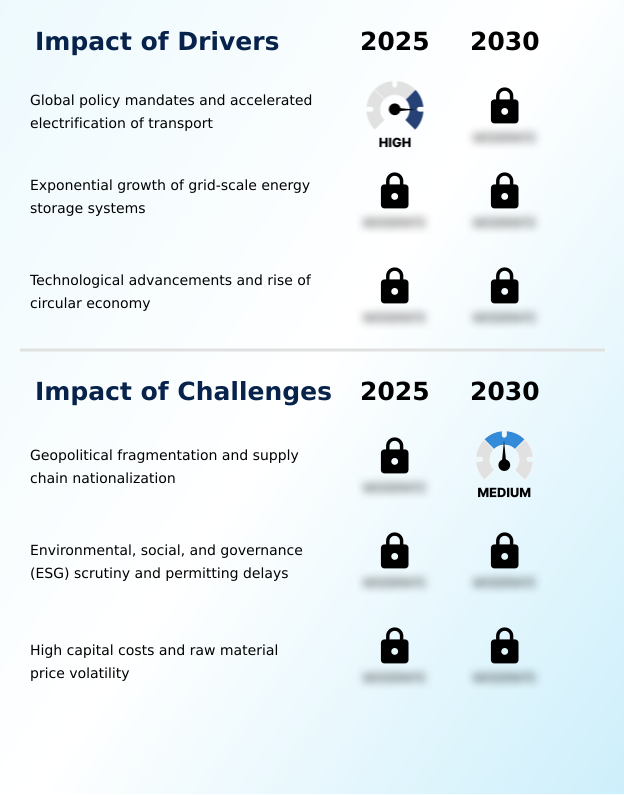
  • Accelerated transport electrification, propelled by stringent global policy mandates, serves as a primary driver for market expansion and raw material demand.

  • Technological advancement and the expansion of energy storage systems (ESS) are major market drivers.
  • The rapid deployment of grid-scale energy storage is creating massive demand for specific chemistries like lithium iron phosphate (LFP), which is favored for its stability and cost-effectiveness.
  • The risk of technological obsolescence is pushing R&D into diverse areas, including sodium-ion battery chemistry and advanced chemistry cells.
  • The development of solid-state electrolytes promises enhanced safety and energy density, while innovations in direct lithium extraction (DLE) can improve lithium recovery efficiency by up to 40% compared to conventional methods.
  • The demand for fast-charging battery materials and certain rare earth elements for specialized applications further diversifies the raw material requirements, fueling growth across multiple sub-segments.

What are the market trends shaping the Battery Raw Materials Industry?

  • A strategic shift toward vertical integration is reshaping the market, as industry players increasingly pursue supply chain localization to secure upstream resources.

  • A dominant market trend is the aggressive pursuit of supply chain localization and vertical integration. Companies are investing heavily in downstream processing capacity to convert raw minerals into high-value chemicals like lithium hydroxide and synthetic graphite. This strategic shift is designed to secure a closed-loop supply chain, reducing reliance on volatile global markets.
  • As part of this, offtake agreement strategies are becoming more sophisticated, often involving direct equity stakes in mining operations. This aligns with national industrial goals, such as regional critical minerals strategy frameworks.
  • Investments in urban mining infrastructure are also accelerating, with new facilities for black mass processing capable of recovering over 90% of materials, including essentials like polyvinylidene fluoride (PVDF), bolstering domestic supply.

What challenges does the Battery Raw Materials Industry face during its growth?

  • The market's growth trajectory is constrained by geopolitical fragmentation and the rising trend of supply chain nationalization, which introduces supply uncertainty.

  • The market faces significant challenges from geopolitical supply risk and the rising tide of resource nationalism impact, which can disrupt feedstock security. Navigating ESG compliance in mining has become a critical hurdle, with stringent permitting delays stalling projects and increasing capital expenditure in mining. For example, new mines can face approval timelines 50% longer than a decade ago.
  • Price volatility hedging remains a persistent issue for both producers and consumers. Furthermore, technological hurdles in processes like high-pressure acid leaching (HPAL) for nickel extraction present operational risks.
  • Ensuring a stable supply of intermediate products like mixed hydroxide precipitate (MHP) and low-carbon nickel is essential, but market fragmentation and trade barriers complicate procurement strategies, creating a complex operating environment for all participants.

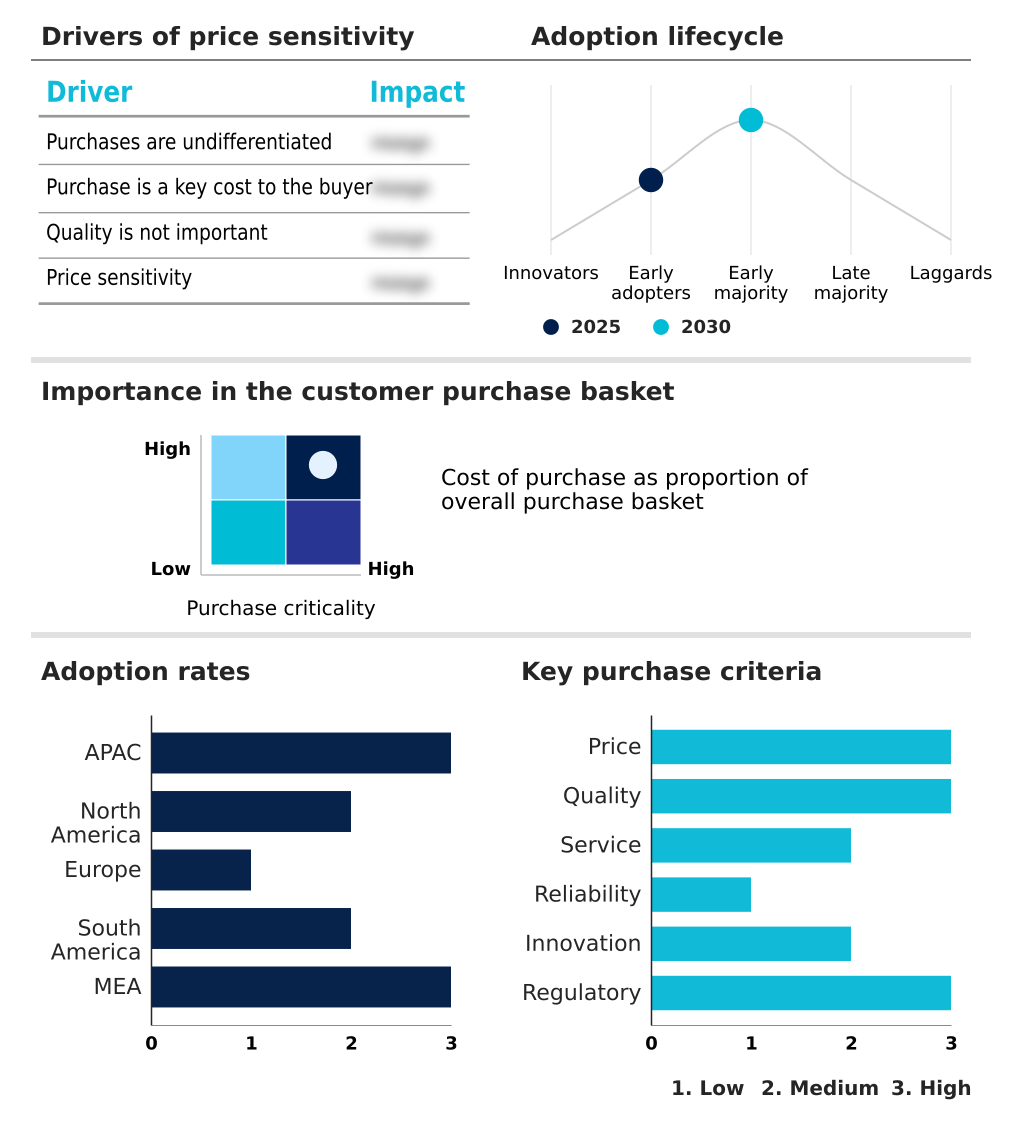
Exclusive Technavio Analysis on Customer Landscape

The battery raw materials market forecasting report includes the adoption lifecycle of the market, covering from the innovator’s stage to the laggard’s stage. It focuses on adoption rates in different regions based on penetration. Furthermore, the battery raw materials market report also includes key purchase criteria and drivers of price sensitivity to help companies evaluate and develop their market growth analysis strategies.

Customer Landscape of Battery Raw Materials Industry

Competitive Landscape

Companies are implementing various strategies, such as strategic alliances, battery raw materials market forecast, partnerships, mergers and acquisitions, geographical expansion, and product/service launches, to enhance their presence in the industry.

Albemarle Corp. - Provides essential lithium compounds, including carbonate and hydroxide, sourced from diverse brine and hard rock deposits to support advanced battery manufacturing.

The industry research and growth report includes detailed analyses of the competitive landscape of the market and information about key companies, including:

  • Albemarle Corp.
  • Arcadium Lithium
  • BASF SE
  • BHP Group Ltd.
  • CMOC Group Limited
  • Freeport McMoRan Inc.
  • Ganfeng Lithium Group Ltd.
  • Glencore Plc
  • LG Chem Ltd.
  • Pilbara Minerals Ltd.
  • PJSC MMC Norilsk Nickel
  • Rio Tinto Ltd.
  • SQM S.A.
  • Sumitomo Corp.
  • Teck Resources Ltd.
  • Tianqi Lithium Corp.
  • Umicore SA
  • Vale SA
  • Zhejiang Huayou Cobalt Co., Ltd.

Qualitative and quantitative analysis of companies has been conducted to help clients understand the wider business environment as well as the strengths and weaknesses of key industry players. Data is qualitatively analyzed to categorize companies as pure play, category-focused, industry-focused, and diversified; it is quantitatively analyzed to categorize companies as dominant, leading, strong, tentative, and weak.

Recent Development and News in Battery raw materials market

  • In August 2024, Tesla broke ground on a proprietary lithium refinery in Texas, aiming to produce battery-grade lithium hydroxide domestically to reduce logistical costs and secure its supply chain.
  • In November 2024, BYD launched a compact electric vehicle powered by its second-generation sodium-ion battery pack, demonstrating the commercial viability of this alternative chemistry for cost-sensitive market segments.
  • In January 2025, a leading Japanese automotive manufacturer revealed a prototype vehicle equipped with a proprietary solid-state battery, announcing plans for pilot production and signaling a future shift in material requirements.
  • In April 2025, a consortium of major European truck manufacturers announced a joint venture to construct a dedicated battery cell production facility in Sweden, designed for heavy-duty applications and requiring substantial volumes of high-purity nickel.

Dive into Technavio’s robust research methodology, blending expert interviews, extensive data synthesis, and validated models for unparalleled Battery Raw Materials Market insights. See full methodology.

Market Scope
Page number 302
Base year 2025
Historic period 2020-2024
Forecast period 2026-2030
Growth momentum & CAGR Accelerate at a CAGR of 8.1%
Market growth 2026-2030 USD 30622.0 million
Market structure Fragmented
YoY growth 2025-2026(%) 7.5%
Key countries China, South Korea, Japan, India, Australia, Indonesia, US, Canada, Mexico, Germany, France, UK, The Netherlands, Spain, Italy, Brazil, Argentina, Colombia, Saudi Arabia, UAE, South Africa, Israel and Turkey
Competitive landscape Leading Companies, Market Positioning of Companies, Competitive Strategies, and Industry Risks

Request Free Sample

Research Analyst Overview

  • The battery raw materials sector is in a state of strategic flux, defined by the dual pressures of accelerated electrification and geopolitical realignment. A primary focus is securing access to foundational inputs like lithium carbonate, lithium hydroxide, and spodumene concentrate.
  • The industry is rapidly shifting from a commoditized supply model to one of deep vertical integration, where the control of cathode active materials (CAM) and high-purity nickel is paramount. This strategic imperative is compelling boardroom decisions to balance investments between new greenfield projects and urban mining infrastructure.
  • Advanced hydrometallurgical recycling, which can recover up to 95% of battery-grade cobalt and other key metals from black mass processing, now offers a viable alternative to traditional extraction. This push toward circular economy principles is reinforced by battery passport regulation and the critical raw materials act.
  • As the market diversifies with chemistries like lithium iron phosphate (LFP) and technologies like direct lithium extraction (DLE), navigating the complexities of synthetic graphite, silicon-carbon composites, solid-state electrolytes, and end-of-life battery management becomes essential for sustained competitive advantage and supply chain stability.

What are the Key Data Covered in this Battery Raw Materials Market Research and Growth Report?

  • What is the expected growth of the Battery Raw Materials Market between 2026 and 2030?

    • USD 30.62 billion, at a CAGR of 8.1%

  • What segmentation does the market report cover?

    • The report is segmented by Material (Cathodes materials, Anodes materials, Electrolyte materials, and Others), Application (Lead-acid battery, Lithium-ion battery, and Others), End-user (Secondary batteries, and Primary batteries) and Geography (APAC, North America, Europe, South America, Middle East and Africa)

  • Which regions are analyzed in the report?

    • APAC, North America, Europe, South America and Middle East and Africa

  • What are the key growth drivers and market challenges?

    • Global policy mandates and accelerated electrification of transport, Geopolitical fragmentation and supply chain nationalization

  • Who are the major players in the Battery Raw Materials Market?

    • Albemarle Corp., Arcadium Lithium, BASF SE, BHP Group Ltd., CMOC Group Limited, Freeport McMoRan Inc., Ganfeng Lithium Group Ltd., Glencore Plc, LG Chem Ltd., Pilbara Minerals Ltd., PJSC MMC Norilsk Nickel, Rio Tinto Ltd., SQM S.A., Sumitomo Corp., Teck Resources Ltd., Tianqi Lithium Corp., Umicore SA, Vale SA and Zhejiang Huayou Cobalt Co., Ltd.

Market Research Insights

  • Market dynamics are defined by a strategic push for supply chain resilience and technological diversification. The emphasis on supply chain localization is driving unprecedented capital expenditure in mining and downstream processing capacity. This is complemented by the rapid adoption of alternative chemistries, such as sodium-ion battery chemistry, to mitigate geopolitical supply risk associated with critical minerals like cobalt.
  • The efficiency gains from new technologies are significant; advanced hydrometallurgical recycling plants now recover over 95% of key metals, creating a vital stream of secondary raw materials.
  • Furthermore, stringent regulations, such as mandates requiring a 90% reduction in emissions for new heavy-duty vehicles, are accelerating the demand for advanced chemistry cells and forcing alignment with a closed-loop supply chain model, bolstering feedstock security for all participants.

We can help! Our analysts can customize this battery raw materials market research report to meet your requirements.

Get in touch

1. Executive Summary

1.1 Market overview

Executive Summary - Chart on Market Overview
Executive Summary - Data Table on Market Overview
Executive Summary - Chart on Global Market Characteristics
Executive Summary - Chart on Market by Geography
Executive Summary - Chart on Market Segmentation by Material
Executive Summary - Chart on Market Segmentation by Application
Executive Summary - Chart on Market Segmentation by End-user
Executive Summary - Chart on Incremental Growth
Executive Summary - Data Table on Incremental Growth
Executive Summary - Chart on Company Market Positioning

2. Technavio Analysis

2.1 Analysis of price sensitivity, lifecycle, customer purchase basket, adoption rates, and purchase criteria

2.2 Criticality of inputs and Factors of differentiation

Chart on Overview on criticality of inputs and factors of differentiation

2.3 Factors of disruption

Chart on Overview on factors of disruption

2.4 Impact of drivers and challenges

Chart on Impact of drivers and challenges in 2025 and 2030

3. Market Landscape

3.1 Market ecosystem

Chart on Parent Market
Data Table on - Parent Market

3.2 Market characteristics

Chart on Market characteristics analysis

3.3 Value chain analysis

Chart on Value chain analysis

4. Market Sizing

4.1 Market definition

Data Table on Offerings of companies included in the market definition

4.2 Market segment analysis

Market segments

4.3 Market size 2025

4.4 Market outlook: Forecast for 2025-2030

Chart on Global - Market size and forecast 2025-2030 ($ million)
Data Table on Global - Market size and forecast 2025-2030 ($ million)
Chart on Global Market: Year-over-year growth 2025-2030 (%)
Data Table on Global Market: Year-over-year growth 2025-2030 (%)

5. Historic Market Size

5.1 Global Battery Raw Materials Market 2020 - 2024

Historic Market Size - Data Table on Global Battery Raw Materials Market 2020 - 2024 ($ million)

5.2 Material segment analysis 2020 - 2024

Historic Market Size - Material Segment 2020 - 2024 ($ million)

5.3 Application segment analysis 2020 - 2024

Historic Market Size - Application Segment 2020 - 2024 ($ million)

5.4 End-user segment analysis 2020 - 2024

Historic Market Size - End-user Segment 2020 - 2024 ($ million)

5.5 Geography segment analysis 2020 - 2024

Historic Market Size - Geography Segment 2020 - 2024 ($ million)

5.6 Country segment analysis 2020 - 2024

Historic Market Size - Country Segment 2020 - 2024 ($ million)

6. Qualitative Analysis

6.1 Impact of AI on the Global Battery Raw Materials Market

7. Five Forces Analysis

7.1 Five forces summary

Five forces analysis - Comparison between 2025 and 2030

7.2 Bargaining power of buyers

Bargaining power of buyers - Impact of key factors 2025 and 2030

7.3 Bargaining power of suppliers

Bargaining power of suppliers - Impact of key factors in 2025 and 2030

7.4 Threat of new entrants

Threat of new entrants - Impact of key factors in 2025 and 2030

7.5 Threat of substitutes

Threat of substitutes - Impact of key factors in 2025 and 2030

7.6 Threat of rivalry

Threat of rivalry - Impact of key factors in 2025 and 2030

7.7 Market condition

Chart on Market condition - Five forces 2025 and 2030

8. Market Segmentation by Material

8.1 Market segments

Chart on Material - Market share 2025-2030 (%)
Data Table on Material - Market share 2025-2030 (%)

8.2 Comparison by Material

Chart on Comparison by Material
Data Table on Comparison by Material

8.3 Cathodes materials - Market size and forecast 2025-2030

Chart on Cathodes materials - Market size and forecast 2025-2030 ($ million)
Data Table on Cathodes materials - Market size and forecast 2025-2030 ($ million)
Chart on Cathodes materials - Year-over-year growth 2025-2030 (%)
Data Table on Cathodes materials - Year-over-year growth 2025-2030 (%)

8.4 Anodes materials - Market size and forecast 2025-2030

Chart on Anodes materials - Market size and forecast 2025-2030 ($ million)
Data Table on Anodes materials - Market size and forecast 2025-2030 ($ million)
Chart on Anodes materials - Year-over-year growth 2025-2030 (%)
Data Table on Anodes materials - Year-over-year growth 2025-2030 (%)

8.5 Electrolyte materials - Market size and forecast 2025-2030

Chart on Electrolyte materials - Market size and forecast 2025-2030 ($ million)
Data Table on Electrolyte materials - Market size and forecast 2025-2030 ($ million)
Chart on Electrolyte materials - Year-over-year growth 2025-2030 (%)
Data Table on Electrolyte materials - Year-over-year growth 2025-2030 (%)

8.6 Others - Market size and forecast 2025-2030

Chart on Others - Market size and forecast 2025-2030 ($ million)
Data Table on Others - Market size and forecast 2025-2030 ($ million)
Chart on Others - Year-over-year growth 2025-2030 (%)
Data Table on Others - Year-over-year growth 2025-2030 (%)

8.7 Market opportunity by Material

Market opportunity by Material ($ million)
Data Table on Market opportunity by Material ($ million)

9. Market Segmentation by Application

9.1 Market segments

Chart on Application - Market share 2025-2030 (%)
Data Table on Application - Market share 2025-2030 (%)

9.2 Comparison by Application

Chart on Comparison by Application
Data Table on Comparison by Application

9.3 Lead-acid battery - Market size and forecast 2025-2030

Chart on Lead-acid battery - Market size and forecast 2025-2030 ($ million)
Data Table on Lead-acid battery - Market size and forecast 2025-2030 ($ million)
Chart on Lead-acid battery - Year-over-year growth 2025-2030 (%)
Data Table on Lead-acid battery - Year-over-year growth 2025-2030 (%)

9.4 Lithium-ion battery - Market size and forecast 2025-2030

Chart on Lithium-ion battery - Market size and forecast 2025-2030 ($ million)
Data Table on Lithium-ion battery - Market size and forecast 2025-2030 ($ million)
Chart on Lithium-ion battery - Year-over-year growth 2025-2030 (%)
Data Table on Lithium-ion battery - Year-over-year growth 2025-2030 (%)

9.5 Others - Market size and forecast 2025-2030

Chart on Others - Market size and forecast 2025-2030 ($ million)
Data Table on Others - Market size and forecast 2025-2030 ($ million)
Chart on Others - Year-over-year growth 2025-2030 (%)
Data Table on Others - Year-over-year growth 2025-2030 (%)

9.6 Market opportunity by Application

Market opportunity by Application ($ million)
Data Table on Market opportunity by Application ($ million)

10. Market Segmentation by End-user

10.1 Market segments

Chart on End-user - Market share 2025-2030 (%)
Data Table on End-user - Market share 2025-2030 (%)

10.2 Comparison by End-user

Chart on Comparison by End-user
Data Table on Comparison by End-user

10.3 Secondary batteries - Market size and forecast 2025-2030

Chart on Secondary batteries - Market size and forecast 2025-2030 ($ million)
Data Table on Secondary batteries - Market size and forecast 2025-2030 ($ million)
Chart on Secondary batteries - Year-over-year growth 2025-2030 (%)
Data Table on Secondary batteries - Year-over-year growth 2025-2030 (%)

10.4 Primary batteries - Market size and forecast 2025-2030

Chart on Primary batteries - Market size and forecast 2025-2030 ($ million)
Data Table on Primary batteries - Market size and forecast 2025-2030 ($ million)
Chart on Primary batteries - Year-over-year growth 2025-2030 (%)
Data Table on Primary batteries - Year-over-year growth 2025-2030 (%)

10.5 Market opportunity by End-user

Market opportunity by End-user ($ million)
Data Table on Market opportunity by End-user ($ million)

11. Customer Landscape

11.1 Customer landscape overview

Analysis of price sensitivity, lifecycle, customer purchase basket, adoption rates, and purchase criteria

12. Geographic Landscape

12.1 Geographic segmentation

Chart on Market share by geography 2025-2030 (%)
Data Table on Market share by geography 2025-2030 (%)

12.2 Geographic comparison

Chart on Geographic comparison
Data Table on Geographic comparison

12.3 APAC - Market size and forecast 2025-2030

Chart on APAC - Market size and forecast 2025-2030 ($ million)
Data Table on APAC - Market size and forecast 2025-2030 ($ million)
Chart on APAC - Year-over-year growth 2025-2030 (%)
Data Table on APAC - Year-over-year growth 2025-2030 (%)
Chart on Regional Comparison - APAC
Data Table on Regional Comparison - APAC

12.3.1 China - Market size and forecast 2025-2030

Chart on China - Market size and forecast 2025-2030 ($ million)
Data Table on China - Market size and forecast 2025-2030 ($ million)
Chart on China - Year-over-year growth 2025-2030 (%)
Data Table on China - Year-over-year growth 2025-2030 (%)

12.3.2 South Korea - Market size and forecast 2025-2030

Chart on South Korea - Market size and forecast 2025-2030 ($ million)
Data Table on South Korea - Market size and forecast 2025-2030 ($ million)
Chart on South Korea - Year-over-year growth 2025-2030 (%)
Data Table on South Korea - Year-over-year growth 2025-2030 (%)

12.3.3 Japan - Market size and forecast 2025-2030

Chart on Japan - Market size and forecast 2025-2030 ($ million)
Data Table on Japan - Market size and forecast 2025-2030 ($ million)
Chart on Japan - Year-over-year growth 2025-2030 (%)
Data Table on Japan - Year-over-year growth 2025-2030 (%)

12.3.4 India - Market size and forecast 2025-2030

Chart on India - Market size and forecast 2025-2030 ($ million)
Data Table on India - Market size and forecast 2025-2030 ($ million)
Chart on India - Year-over-year growth 2025-2030 (%)
Data Table on India - Year-over-year growth 2025-2030 (%)

12.3.5 Australia - Market size and forecast 2025-2030

Chart on Australia - Market size and forecast 2025-2030 ($ million)
Data Table on Australia - Market size and forecast 2025-2030 ($ million)
Chart on Australia - Year-over-year growth 2025-2030 (%)
Data Table on Australia - Year-over-year growth 2025-2030 (%)

12.3.6 Indonesia - Market size and forecast 2025-2030

Chart on Indonesia - Market size and forecast 2025-2030 ($ million)
Data Table on Indonesia - Market size and forecast 2025-2030 ($ million)
Chart on Indonesia - Year-over-year growth 2025-2030 (%)
Data Table on Indonesia - Year-over-year growth 2025-2030 (%)

12.4 North America - Market size and forecast 2025-2030

Chart on North America - Market size and forecast 2025-2030 ($ million)
Data Table on North America - Market size and forecast 2025-2030 ($ million)
Chart on North America - Year-over-year growth 2025-2030 (%)
Data Table on North America - Year-over-year growth 2025-2030 (%)
Chart on Regional Comparison - North America
Data Table on Regional Comparison - North America

12.4.1 US - Market size and forecast 2025-2030

Chart on US - Market size and forecast 2025-2030 ($ million)
Data Table on US - Market size and forecast 2025-2030 ($ million)
Chart on US - Year-over-year growth 2025-2030 (%)
Data Table on US - Year-over-year growth 2025-2030 (%)

12.4.2 Canada - Market size and forecast 2025-2030

Chart on Canada - Market size and forecast 2025-2030 ($ million)
Data Table on Canada - Market size and forecast 2025-2030 ($ million)
Chart on Canada - Year-over-year growth 2025-2030 (%)
Data Table on Canada - Year-over-year growth 2025-2030 (%)

12.4.3 Mexico - Market size and forecast 2025-2030

Chart on Mexico - Market size and forecast 2025-2030 ($ million)
Data Table on Mexico - Market size and forecast 2025-2030 ($ million)
Chart on Mexico - Year-over-year growth 2025-2030 (%)
Data Table on Mexico - Year-over-year growth 2025-2030 (%)

12.5 Europe - Market size and forecast 2025-2030

Chart on Europe - Market size and forecast 2025-2030 ($ million)
Data Table on Europe - Market size and forecast 2025-2030 ($ million)
Chart on Europe - Year-over-year growth 2025-2030 (%)
Data Table on Europe - Year-over-year growth 2025-2030 (%)
Chart on Regional Comparison - Europe
Data Table on Regional Comparison - Europe

12.5.1 Germany - Market size and forecast 2025-2030

Chart on Germany - Market size and forecast 2025-2030 ($ million)
Data Table on Germany - Market size and forecast 2025-2030 ($ million)
Chart on Germany - Year-over-year growth 2025-2030 (%)
Data Table on Germany - Year-over-year growth 2025-2030 (%)

12.5.2 France - Market size and forecast 2025-2030

Chart on France - Market size and forecast 2025-2030 ($ million)
Data Table on France - Market size and forecast 2025-2030 ($ million)
Chart on France - Year-over-year growth 2025-2030 (%)
Data Table on France - Year-over-year growth 2025-2030 (%)

12.5.3 UK - Market size and forecast 2025-2030

Chart on UK - Market size and forecast 2025-2030 ($ million)
Data Table on UK - Market size and forecast 2025-2030 ($ million)
Chart on UK - Year-over-year growth 2025-2030 (%)
Data Table on UK - Year-over-year growth 2025-2030 (%)

12.5.4 The Netherlands - Market size and forecast 2025-2030

Chart on The Netherlands - Market size and forecast 2025-2030 ($ million)
Data Table on The Netherlands - Market size and forecast 2025-2030 ($ million)
Chart on The Netherlands - Year-over-year growth 2025-2030 (%)
Data Table on The Netherlands - Year-over-year growth 2025-2030 (%)

12.5.5 Spain - Market size and forecast 2025-2030

Chart on Spain - Market size and forecast 2025-2030 ($ million)
Data Table on Spain - Market size and forecast 2025-2030 ($ million)
Chart on Spain - Year-over-year growth 2025-2030 (%)
Data Table on Spain - Year-over-year growth 2025-2030 (%)

12.5.6 Italy - Market size and forecast 2025-2030

Chart on Italy - Market size and forecast 2025-2030 ($ million)
Data Table on Italy - Market size and forecast 2025-2030 ($ million)
Chart on Italy - Year-over-year growth 2025-2030 (%)
Data Table on Italy - Year-over-year growth 2025-2030 (%)

12.6 South America - Market size and forecast 2025-2030

Chart on South America - Market size and forecast 2025-2030 ($ million)
Data Table on South America - Market size and forecast 2025-2030 ($ million)
Chart on South America - Year-over-year growth 2025-2030 (%)
Data Table on South America - Year-over-year growth 2025-2030 (%)
Chart on Regional Comparison - South America
Data Table on Regional Comparison - South America

12.6.1 Brazil - Market size and forecast 2025-2030

Chart on Brazil - Market size and forecast 2025-2030 ($ million)
Data Table on Brazil - Market size and forecast 2025-2030 ($ million)
Chart on Brazil - Year-over-year growth 2025-2030 (%)
Data Table on Brazil - Year-over-year growth 2025-2030 (%)

12.6.2 Argentina - Market size and forecast 2025-2030

Chart on Argentina - Market size and forecast 2025-2030 ($ million)
Data Table on Argentina - Market size and forecast 2025-2030 ($ million)
Chart on Argentina - Year-over-year growth 2025-2030 (%)
Data Table on Argentina - Year-over-year growth 2025-2030 (%)

12.6.3 Colombia - Market size and forecast 2025-2030

Chart on Colombia - Market size and forecast 2025-2030 ($ million)
Data Table on Colombia - Market size and forecast 2025-2030 ($ million)
Chart on Colombia - Year-over-year growth 2025-2030 (%)
Data Table on Colombia - Year-over-year growth 2025-2030 (%)

12.7 Middle East and Africa - Market size and forecast 2025-2030

Chart on Middle East and Africa - Market size and forecast 2025-2030 ($ million)
Data Table on Middle East and Africa - Market size and forecast 2025-2030 ($ million)
Chart on Middle East and Africa - Year-over-year growth 2025-2030 (%)
Data Table on Middle East and Africa - Year-over-year growth 2025-2030 (%)
Chart on Regional Comparison - Middle East and Africa
Data Table on Regional Comparison - Middle East and Africa

12.7.1 Saudi Arabia - Market size and forecast 2025-2030

Chart on Saudi Arabia - Market size and forecast 2025-2030 ($ million)
Data Table on Saudi Arabia - Market size and forecast 2025-2030 ($ million)
Chart on Saudi Arabia - Year-over-year growth 2025-2030 (%)
Data Table on Saudi Arabia - Year-over-year growth 2025-2030 (%)

12.7.2 UAE - Market size and forecast 2025-2030

Chart on UAE - Market size and forecast 2025-2030 ($ million)
Data Table on UAE - Market size and forecast 2025-2030 ($ million)
Chart on UAE - Year-over-year growth 2025-2030 (%)
Data Table on UAE - Year-over-year growth 2025-2030 (%)

12.7.3 South Africa - Market size and forecast 2025-2030

Chart on South Africa - Market size and forecast 2025-2030 ($ million)
Data Table on South Africa - Market size and forecast 2025-2030 ($ million)
Chart on South Africa - Year-over-year growth 2025-2030 (%)
Data Table on South Africa - Year-over-year growth 2025-2030 (%)

12.7.4 Israel - Market size and forecast 2025-2030

Chart on Israel - Market size and forecast 2025-2030 ($ million)
Data Table on Israel - Market size and forecast 2025-2030 ($ million)
Chart on Israel - Year-over-year growth 2025-2030 (%)
Data Table on Israel - Year-over-year growth 2025-2030 (%)

12.7.5 Turkey - Market size and forecast 2025-2030

Chart on Turkey - Market size and forecast 2025-2030 ($ million)
Data Table on Turkey - Market size and forecast 2025-2030 ($ million)
Chart on Turkey - Year-over-year growth 2025-2030 (%)
Data Table on Turkey - Year-over-year growth 2025-2030 (%)

12.8 Market opportunity by geography

Market opportunity by geography ($ million)
Data Tables on Market opportunity by geography ($ million)

13. Drivers, Challenges, and Opportunity

13.1 Market drivers

Global policy mandates and accelerated electrification of transport
Exponential growth of grid-scale energy storage systems
Technological advancements and rise of circular economy

13.2 Market challenges

Geopolitical fragmentation and supply chain nationalization
Environmental, social, and governance (ESG) scrutiny and permitting delays
High capital costs and raw material price volatility

13.3 Impact of drivers and challenges

Impact of drivers and challenges in 2025 and 2030

13.4 Market opportunities

Vertical integration and supply chain localization
Acceleration of iron-based and sodium-ion chemistries
Industrialization of black mass recycling

14. Competitive Landscape

14.1 Overview

14.2

Overview on criticality of inputs and factors of differentiation

14.3 Landscape disruption

Overview on factors of disruption

14.4 Industry risks

Impact of key risks on business

15. Competitive Analysis

15.1 Companies profiled

Companies covered

15.2 Company ranking index

15.3 Market positioning of companies

Matrix on companies position and classification

15.4 Albemarle Corp.

Albemarle Corp. - Overview
Albemarle Corp. - Business segments
Albemarle Corp. - Key news
Albemarle Corp. - Key offerings
Albemarle Corp. - Segment focus
SWOT

15.5 Arcadium Lithium

Arcadium Lithium - Overview
Arcadium Lithium - Product / Service
Arcadium Lithium - Key offerings
SWOT

15.6 BASF SE

BASF SE - Overview
BASF SE - Business segments
BASF SE - Key news
BASF SE - Key offerings
BASF SE - Segment focus
SWOT

15.7 BHP Group Ltd.

BHP Group Ltd. - Overview
BHP Group Ltd. - Business segments
BHP Group Ltd. - Key offerings
BHP Group Ltd. - Segment focus
SWOT

15.8 CMOC Group Limited

CMOC Group Limited - Overview
CMOC Group Limited - Product / Service
CMOC Group Limited - Key offerings
SWOT

15.9 Ganfeng Lithium Group Ltd.

Ganfeng Lithium Group Ltd. - Overview
Ganfeng Lithium Group Ltd. - Product / Service
Ganfeng Lithium Group Ltd. - Key offerings
SWOT

15.10 Glencore Plc

Glencore Plc - Overview
Glencore Plc - Business segments
Glencore Plc - Key news
Glencore Plc - Key offerings
Glencore Plc - Segment focus
SWOT

15.11 Pilbara Minerals Ltd.

Pilbara Minerals Ltd. - Overview
Pilbara Minerals Ltd. - Product / Service
Pilbara Minerals Ltd. - Key offerings
SWOT

15.12 Rio Tinto Ltd.

Rio Tinto Ltd. - Overview
Rio Tinto Ltd. - Business segments
Rio Tinto Ltd. - Key news
Rio Tinto Ltd. - Key offerings
Rio Tinto Ltd. - Segment focus
SWOT

15.13 SQM S.A.

SQM S.A. - Overview
SQM S.A. - Business segments
SQM S.A. - Key news
SQM S.A. - Key offerings
SQM S.A. - Segment focus
SWOT

15.14 Sumitomo Corp.

Sumitomo Corp. - Overview
Sumitomo Corp. - Business segments
Sumitomo Corp. - Key offerings
Sumitomo Corp. - Segment focus
SWOT

15.15 Tianqi Lithium Corp.

Tianqi Lithium Corp. - Overview
Tianqi Lithium Corp. - Product / Service
Tianqi Lithium Corp. - Key offerings
SWOT

15.16 Umicore SA

Umicore SA - Overview
Umicore SA - Business segments
Umicore SA - Key news
Umicore SA - Key offerings
Umicore SA - Segment focus
SWOT

15.17 Vale SA

Vale SA - Overview
Vale SA - Product / Service
Vale SA - Key offerings
SWOT

15.18 Zhejiang Huayou Cobalt Co., Ltd.

Zhejiang Huayou Cobalt Co., Ltd. - Overview
Zhejiang Huayou Cobalt Co., Ltd. - Product / Service
Zhejiang Huayou Cobalt Co., Ltd. - Key offerings
SWOT

16. Appendix

16.1 Scope of the report

Market definition
Objectives
Notes and caveats

16.2 Inclusions and exclusions checklist

Inclusions checklist
Exclusions checklist

16.3 Currency conversion rates for US$

16.4 Research methodology

16.5 Data procurement

Information sources

16.6 Data validation

16.7 Validation techniques employed for market sizing

16.8 Data synthesis

16.9 360 degree market analysis

16.10 List of abbreviations

Research Methodology

Technavio presents a detailed picture of the market by way of study, synthesis, and summation of data from multiple sources. The analysts have presented the various facets of the market with a particular focus on identifying the key industry influencers. The data thus presented is comprehensive, reliable, and the result of extensive research, both primary and secondary.

INFORMATION SOURCES

Primary sources

  • Manufacturers and suppliers
  • Channel partners
  • Industry experts
  • Strategic decision makers

Secondary sources

  • Industry journals and periodicals
  • Government data
  • Financial reports of key industry players
  • Historical data
  • Press releases

DATA ANALYSIS

Data Synthesis

  • Collation of data
  • Estimation of key figures
  • Analysis of derived insights

Data Validation

  • Triangulation with data models
  • Reference against proprietary databases
  • Corroboration with industry experts

REPORT WRITING

Qualitative

  • Market drivers
  • Market challenges
  • Market trends
  • Five forces analysis

Quantitative

  • Market size and forecast
  • Market segmentation
  • Geographical insights
  • Competitive landscape

Interested in this report?

Get your sample now to see our research methodology and insights!

Download Now

Frequently Asked Questions

Battery Raw Materials market growth will increase by USD 30622.0 million during 2026-2030 .

The Battery Raw Materials market is expected to grow at a CAGR of 8.1% during 2026-2030 .

Battery Raw Materials market is segmented by Material (Cathodes materials, Anodes materials, Electrolyte materials, Others) Application (Lead-acid battery, Lithium-ion battery, Others) End-user (Secondary batteries, Primary batteries)

Albemarle Corp., Arcadium Lithium, BASF SE, BHP Group Ltd., CMOC Group Limited, Freeport McMoRan Inc., Ganfeng Lithium Group Ltd., Glencore Plc, LG Chem Ltd., Pilbara Minerals Ltd., PJSC MMC Norilsk Nickel, Rio Tinto Ltd., SQM S.A., Sumitomo Corp., Teck Resources Ltd., Tianqi Lithium Corp., Umicore SA, Vale SA, Zhejiang Huayou Cobalt Co., Ltd. are a few of the key vendors in the Battery Raw Materials market.

APAC will register the highest growth rate of 46.8% among the other regions. Therefore, the Battery Raw Materials market in APAC is expected to garner significant business opportunities for the vendors during the forecast period.

China, South Korea, Japan, India, Australia, Indonesia, US, Canada, Mexico, Germany, France, UK, The Netherlands, Spain, Italy, Brazil, Argentina, Colombia, Saudi Arabia, UAE, South Africa, Israel, Turkey

  • Global policy mandates and accelerated electrification of transport is the driving factor this market.

The Battery Raw Materials market vendors should focus on grabbing business opportunities from the Material segment as it accounted for the largest market share in the base year.