Synthetic Graphite Market Size 2025-2029
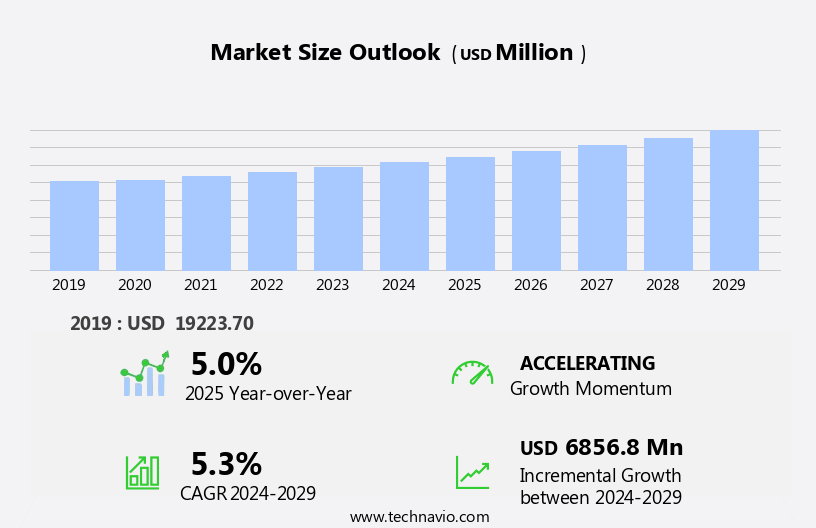
The synthetic graphite market size is forecast to increase by USD 6.86 billion at a CAGR of 5.3% between 2024 and 2029.
- The market is experiencing significant growth, driven primarily by the increasing demand for high-purity synthetic graphite in various industries, including metallurgical applications. This trend is attributed to the superior properties of synthetic graphite, such as its high electrical conductivity, thermal stability, and resistance to corrosion. However, the market growth is tempered by certain challenges. Firstly, the high cost of synthetic graphite compared to natural graphite remains a significant barrier to widespread adoption. The market is driven by the increasing demand for Terawatt-Hours of energy storage from EVs and the shift towards renewable energy. This cost differential is due to the more complex and energy-intensive production process of synthetic graphite. Additionally, regulatory hurdles impact adoption, as stringent environmental regulations and safety concerns necessitate significant investments in production facilities and compliance measures.
- Supply chain inconsistencies further complicate matters, as the market relies on a limited number of producers, leading to potential price volatility and supply shortages. Despite this, opportunities exist for companies to capitalize on the expanding use of synthetic graphite in advanced technologies such as lithium-ion batteries, fuel cells, and solar panels. Companies seeking to capitalize on the opportunities in the market must navigate these challenges effectively, focusing on cost reduction strategies, regulatory compliance, and supply chain resilience.
What will be the Size of the Synthetic Graphite Market during the forecast period?
- The market is experiencing significant activity and trends as the energy transition gains momentum. Battery management systems are increasingly utilizing synthetic graphite in proton exchange membrane fuel cells for improved energy density and power density. The digital transformation is driving the need for faster charging times, leading to advancements in battery technology, such as solid-state batteries and flow batteries. Thermal runaway risks are a concern for battery manufacturers, necessitating the development of advanced anode materials and cathode materials. Hydrogen fuel cells, another area of focus, require high-performance synthetic graphite for fuel cell stacks. Renewable energy sources are driving the demand for resource efficiency, and synthetic graphite's role in energy storage systems is becoming increasingly important. It is also used in the chemical sector for the production of aluminum, calcium carbide, and other alloys.
- Big data, artificial intelligence, and machine learning are revolutionizing battery performance analysis, enabling predictive maintenance and optimizing charging time. Circular economy principles are guiding the development of battery materials, with a focus on reducing waste and improving material science. The pursuit of carbon neutrality is further propelling the market forward, as synthetic graphite's role in battery production aligns with this goal. In the realm of charging infrastructure, wireless charging and fast charging are gaining traction, necessitating the production of large quantities of high-quality synthetic graphite. One of the primary drivers is the electric vehicle (EV) industry, where synthetic graphite is essential for producing Terawatt-Hours of energy from lithium-ion batteries. The market is expected to continue growing as the demand for energy storage solutions increases, driven by the global shift towards renewable energy and the digital transformation.
How is this Synthetic Graphite Industry segmented?
The synthetic graphite industry research report provides comprehensive data (region-wise segment analysis), with forecasts and estimates in "USD million" for the period 2025-2029, as well as historical data from 2019-2023 for the following segments.
- Distribution Channel
- Direct sales
- Distributors
- Application
- Electrodes
- Metallurgy
- Parts and components
- Nuclear
- Others
- Grade Type
- High-purity graphite
- Fine-grain graphite
- Coarse-grain graphite
- Isotropic graphite
- Geography
- North America
- US
- Canada
- Europe
- France
- Germany
- UK
- APAC
- Australia
- China
- India
- Japan
- South Korea
- Rest of World (ROW)
- North America
By Distribution Channel Insights
The direct sales segment is estimated to witness significant growth during the forecast period. The market is characterized by a dynamic supply chain that fosters direct relationships between manufacturers and customers through direct sales channels. This approach allows for detailed technical communication and product knowledge exchange, particularly beneficial in industries where precise material specifications are crucial. Synthesized graphite is employed in a range of industries, necessitating tailored solutions. In the production of anodes for lithium-ion batteries, for instance, precise material properties are essential. The graphitization process, cycle life, and flake size are significant factors in the production of high-quality spherical graphite for lithium-ion batteries. Synthetic graphite electrodes hold significant importance in the electric arc furnaces (EAFs) utilized for steel production. Conductive fillers, process optimization, and life cycle analysis are other critical aspects in the manufacturing process.
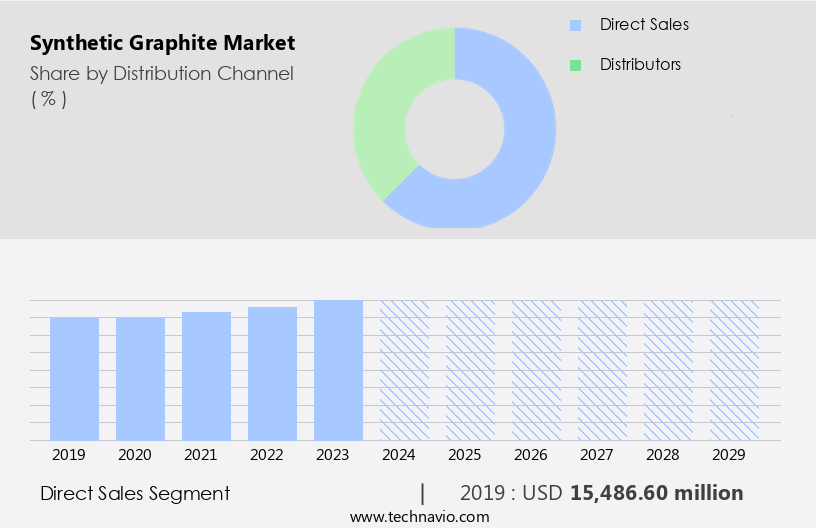
The Direct sales segment was valued at USD 15.49 billion in 2019 and showed a gradual increase during the forecast period. Synthetic graphite also finds applications in fuel cells, lead-acid batteries, and various other energy storage systems, power electronics, and high-temperature applications. Production capacity expansion, heat treatment, and quality control are essential for maintaining consistency and meeting increasing demand. This higher cost poses a significant challenge for cost-sensitive industries, such as steel manufacturing, where synthetic graphite is extensively used in electric arc furnaces. Environmental impact, oxidation resistance, and chemical resistance are key considerations in applications ranging from electric vehicles and solar energy to nuclear reactors and refractory materials. Research and development efforts continue to explore new applications, such as wind energy and chemical processing, further expanding the market's scope.
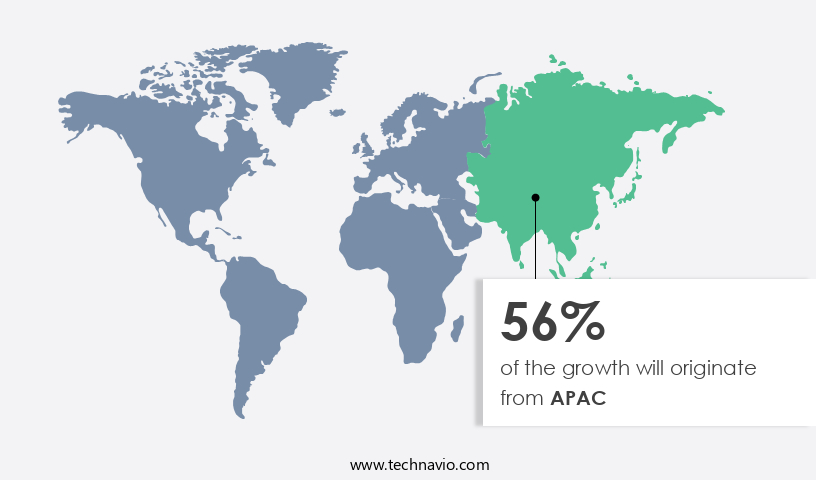
Regional Analysis
APAC is estimated to contribute 56% to the growth of the global market during the forecast period. Technavio's analysts have elaborately explained the regional trends and drivers that shape the market during the forecast period.
The market is experiencing significant growth due to the increasing demand for this material in various industries. In the foundry sector, synthetic graphite is utilized as a refractory material for its high temperature resistance and chemical inertness. In the electrical industry, it is used as an anode material in primary batteries and as a filler in secondary batteries, such as lithium-ion and nickel-metal hydride batteries. The graphitization process is crucial in enhancing the electrochemical performance, rate capability, and cycle life of these batteries. The demand for electric vehicles (EVs) and hybrid electric vehicles (HEVs) is driving the consumption of synthetic graphite in the production of lithium-ion batteries.
This trend is particularly prominent in countries like China, India, and Japan, where the adoption of EVs is rapidly increasing. Moreover, the production of fuel cells, which use synthetic graphite as a bipolar plate material, is also contributing to the market growth. The production process of synthetic graphite involves the optimization of various parameters, such as particle size, flake size, and heat treatment, to achieve the desired properties. The life cycle analysis of synthetic graphite is essential to assess its environmental impact and carbon footprint. In addition, the material's chemical resistance and thermal conductivity make it suitable for use in various high-temperature applications, such as solar energy, wind energy, and nuclear reactors.
Furthermore, synthetic graphite is used in various industrial applications, including coatings, corrosion products, rubber and plastic compounds, drilling, and power electronics. The demand for these applications is expected to continue, further fueling the growth of the market. Research and development efforts in the field of synthetic graphite are ongoing, with a focus on improving the production capacity, quality control, and cost-effectiveness of the material. These advancements are expected to provide new opportunities for the market in the coming years.
Market Dynamics
Our researchers analyzed the data with 2024 as the base year, along with the key drivers, trends, and challenges. A holistic analysis of drivers will help companies refine their marketing strategies to gain a competitive advantage.
What are the Synthetic Graphite market drivers leading to the rise in the adoption of Industry?
- The market is primarily driven by the significant demand for high-purity synthetic graphite, which is essential in various industries, including lithium-ion batteries and nuclear reactors, due to its superior properties. High-purity synthetic graphite holds significant importance in numerous industries, primarily in the production of anodes for lithium-ion batteries. With the increasing popularity of electric vehicles (EVs) and the expansion of renewable energy storage systems, the market demand for high-purity synthetic graphite in battery applications is anticipated to experience substantial growth. In the semiconductor and electronics sectors, this material is indispensable due to its superior thermal and electrical conductivity, which is crucial for thermal management. It is employed as a crucible material and contributes to the manufacturing of electronic components. Furthermore, high-purity synthetic graphite is extensively utilized in metallurgical processes, specifically in the production of specialty steel and iron alloys.
- In solar energy and nuclear reactors, high-purity synthetic graphite is employed as a moderator due to its ability to enhance the reactivity of nuclear fuel and improve the efficiency of solar panels. Additionally, it is used in chemical processing industries for various applications, including catalyst supports and electrodes. Ongoing research and development initiatives in these sectors are expected to further expand the applications of high-purity synthetic graphite.
What are the Synthetic Graphite market trends shaping the Industry?
- Metallurgical applications are witnessing an upward trend in the utilization of synthetic graphite due to its increasing demand. This emerging market pattern underscores the importance of synthetic graphite as a key material in various industrial processes. Synthetic graphite plays a pivotal role in various industries, particularly in metallurgical applications. In steel production, it is extensively used in electric arc furnaces (EAFs) due to its ability to provide the high temperatures required for melting and refining scrap metal. The increasing demand for infrastructure, construction, and industrial expansion has led to a higher usage of synthetic graphite electrodes in steelmaking.
- Moreover, synthetic graphite functions as a carbon additive in specialty steel and iron alloys, enhancing their hardness and strength, with a growing demand from the automotive and aerospace sectors. In the aluminum industry, synthetic graphite electrodes are essential for smelting processes, supporting the rising need for lightweight and energy-efficient materials in transportation and industrial applications. The graphitization process is a critical factor in the production of synthetic graphite, and process optimization and life cycle analysis are crucial for improving cycle life and reducing the carbon footprint. Furthermore, synthetic graphite is increasingly used as a conductive filler in lithium-ion batteries and fuel cells, underscoring its versatility and importance in diverse applications.
How does Synthetic Graphite market faces challenges during its growth?
- The high cost of synthetic graphite poses a significant challenge to the expansion and growth of the industry. Synthetic graphite, while offering superior electrochemical performance and oxidation resistance, faces a challenge in cost competitiveness compared to natural graphite. The high production cost of synthetic graphite makes it less favorable for cost-sensitive industries, such as steel manufacturing, where efficiency is paramount. In industries relying on synthetic graphite electrodes, like electric arc furnaces in steelmaking, escalating production costs can pose financial hurdles for manufacturers. These high-priced inputs can ultimately influence the profitability of industries that utilize synthetic graphite, including energy storage solutions for electric vehicles and power electronics, potentially hindering its widespread adoption. Despite its advantages in electrochemical performance and rate capability, the financial implications of synthetic graphite production costs necessitate a careful consideration for its implementation in various industries.
Exclusive Customer Landscape
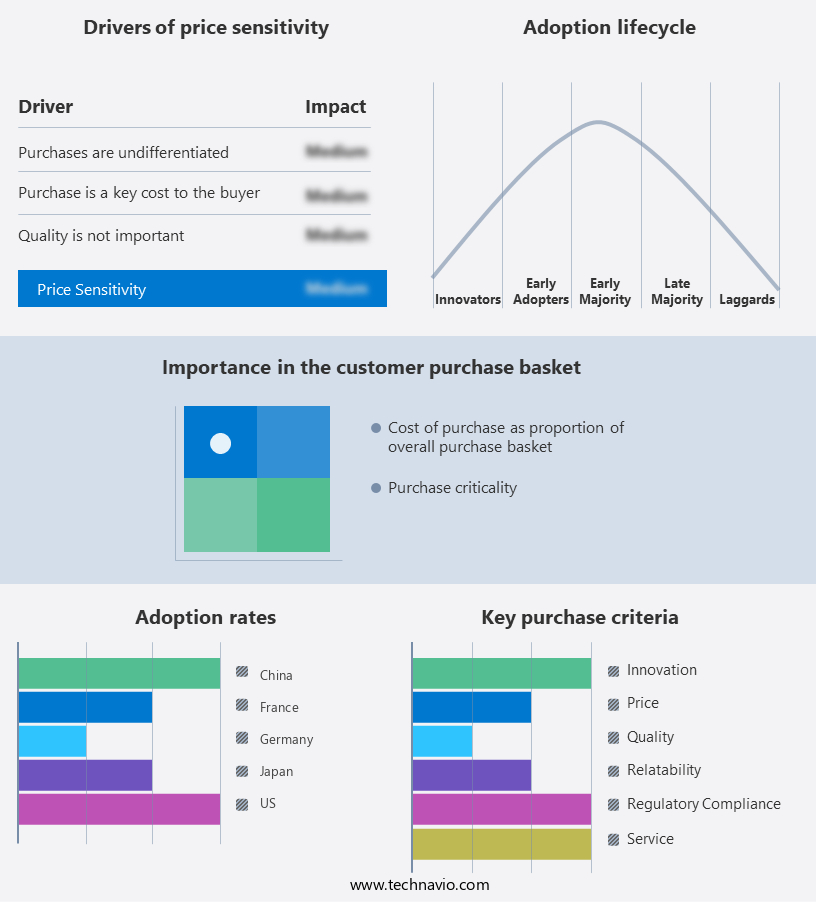
The synthetic graphite market forecasting report includes the adoption lifecycle of the market, covering from the innovator's stage to the laggard's stage. It focuses on adoption rates in different regions based on penetration. Furthermore, the synthetic graphite market report also includes key purchase criteria and drivers of price sensitivity to help companies evaluate and develop their market growth analysis strategies.
Customer Landscape
Key Companies & Market Insights
Companies are implementing various strategies, such as strategic alliances, synthetic graphite market forecast, partnerships, mergers and acquisitions, geographical expansion, and product/service launches, to enhance their presence in the industry.
AMG Advanced Metallurgical Group NV - The company specializes in the production of synthetic graphite, derived from various feedstocks including lignite, hard coal, petroleum, pitches, and plastics.
The industry research and growth report includes detailed analyses of the competitive landscape of the market and information about key companies, including:
- AMG Advanced Metallurgical Group NV
- Asbury Carbons Inc.
- Brookfield Business Partners LP
- BTR New material Group Co. Ltd.
- Graphite India Ltd.
- Imerys S.A.
- KAIYU INDUSTRIAL HK LTD.
- Lianyungang Jinli Carbon Co.Ltd.
- Mersen Corporate Services SAS
- Mitsubishi Chemical Group Corp.
- Morgan Advanced Materials Plc
- Nippon Carbon Co. Ltd
- Resonac Holdings Corp.
- Schunk GmbH
- SGL Carbon SE
- Tokai Carbon Co. Ltd.
- Toyo Tanso Co.Ltd.
Qualitative and quantitative analysis of companies has been conducted to help clients understand the wider business environment as well as the strengths and weaknesses of key industry players. Data is qualitatively analyzed to categorize companies as pure play, category-focused, industry-focused, and diversified; it is quantitatively analyzed to categorize companies as dominant, leading, strong, tentative, and weak.
Recent Development and News in Synthetic Graphite Market
- In February 2024, SGL Carbon, a leading global graphite material producer, announced the commissioning of its new synthetic graphite plant in China, expanding its production capacity by 25,000 tons per year (TPA) (SGL Carbon press release, 2024). This strategic expansion aimed to cater to the growing demand for synthetic graphite in the lithium-ion battery market.
- In October 2024, Sumitomo Chemical, a Japanese chemical company, completed the acquisition of a 50% stake in Nexeon, a UK-based lithium-ion battery technology company, for approximately USD 200 million. This investment was aimed at accelerating the development and commercialization of Nexeon's advanced synthetic graphite technology (Sumitomo Chemical press release, 2024).
- In March 2025, the European Union (EU) announced the approval of a â¬1.3 billion (USD 1.5 billion) battery cell manufacturing project, which included the production of synthetic graphite anodes. This initiative was part of the EU's Green Deal, focusing on reducing carbon emissions and promoting sustainable technologies (European Commission press release, 2025).
Research Analyst Overview
The market continues to evolve, driven by the dynamic interplay of various factors. The supply chain, from the graphitization process to the production of graphite materials, undergoes constant optimization to meet the evolving demands of diverse sectors. Graphite's role in energy storage, particularly in lithium-ion batteries, is paramount. Factors such as cycle life, flake size, and spherical graphite's electrochemical performance and rate capability are pivotal in enhancing battery efficiency and longevity. Beyond energy storage, graphite's applications extend to conductive fillers, fuel cells, and various high-tech industries like power electronics and renewable energy. The carbon footprint of graphite production is a critical concern, with ongoing research focusing on process optimization and life cycle analysis.
Graphite's versatility is further stressed in its use as an anode material in lead-acid batteries, where oxidation resistance is crucial. In the realm of electric vehicles, graphite's high thermal conductivity and electrical conductivity are essential for efficient energy transfer. Quality assurance and control are integral to the production of graphite materials, ensuring consistency in particle size and chemical resistance for various applications. The graphite market's continuous evolution reflects the ongoing research and development in this field, with potential applications in solar energy, nuclear reactors, and electronic components. The graphitization process, from natural graphite to expanded graphite, plays a significant role in the market's dynamics.
Heat treatment and refractory materials are essential in enhancing graphite's properties for high-temperature applications. The market's unfolding patterns are shaped by the interplay of these factors, with ongoing research and development shaping its future trajectory.
Dive into Technavio's strong research methodology, blending expert interviews, extensive data synthesis, and validated models for unparalleled Synthetic Graphite Market insights. See full methodology.
|
Market Scope |
|
|
Report Coverage |
Details |
|
Page number |
214 |
|
Base year |
2024 |
|
Historic period |
2019-2023 |
|
Forecast period |
2025-2029 |
|
Growth momentum & CAGR |
Accelerate at a CAGR of 5.3% |
|
Market growth 2025-2029 |
USD 6.86 billion |
|
Market structure |
Fragmented |
|
YoY growth 2024-2025(%) |
5.0 |
|
Key countries |
China, US, Germany, France, Japan, UK, Canada, South Korea, Australia, and India |
|
Competitive landscape |
Leading Companies, Market Positioning of Companies, Competitive Strategies, and Industry Risks |
What are the Key Data Covered in this Synthetic Graphite Market Research and Growth Report?
- CAGR of the Synthetic Graphite industry during the forecast period
- Detailed information on factors that will drive the growth and forecasting between 2025 and 2029
- Precise estimation of the size of the market and its contribution of the industry in focus to the parent market
- Accurate predictions about upcoming growth and trends and changes in consumer behaviour
- Growth of the market across APAC, Europe, North America, South America, and Middle East and Africa
- Thorough analysis of the market's competitive landscape and detailed information about companies
- Comprehensive analysis of factors that will challenge the synthetic graphite market growth of industry companies
We can help! Our analysts can customize this synthetic graphite market research report to meet your requirements.
 RIA -
RIA - 
