US Beef Market Size 2026-2030
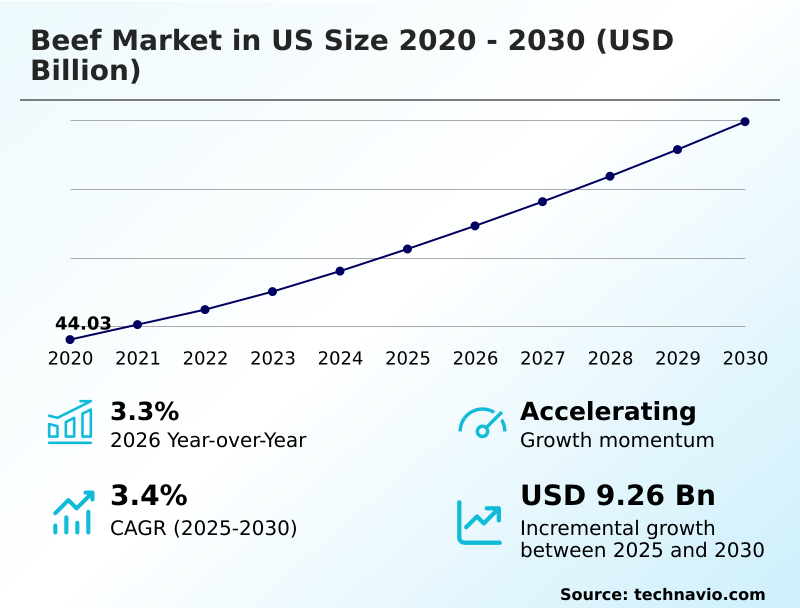
The US Beef Market size was valued at USD 50.62 billion in 2025, growing at a CAGR of 3.4% during the forecast period 2026-2030.
Major Market Trends & Insights
- By Distribution Channel - Offline segment was valued at USD 42.68 billion in 2024
- By Type - Loin segment accounted for the largest market revenue share in 2024
Market Size & Forecast
- Historic Market Opportunities 2020-2024: USD 15.85 billion
- Market Future Opportunities 2025-2030: USD 9.26 billion
- CAGR from 2025 to 2030 : 3.4%
Market Summary
- The beef market in US is defined by a significant structural tension, with the national herd contracting to its lowest level in over 70 years while consumer demand remains robust. This imbalance has driven retail prices to record highs, with ground beef accounting for over 50% of volume, creating a high-stakes environment for the entire supply chain.
- A key driver is the ultra-premiumization trend, where demand for domestic wagyu and heritage breed products has surged, commanding price premiums of up to 40% over conventional beef. As a business scenario, packers are adapting to diminishing margins by investing in automated fabrication and consolidating operations.
- However, a major challenge is the persistent structural deficit in cattle inventories, which extends the herd rebuilding timeline and creates prolonged supply constraints. The reliance on technologies like precision nutrition and genomic selection is therefore critical for maximizing carcass yield from a smaller inventory, balancing production efficiency with market demand for high-quality beef.
What will be the Size of the US Beef Market during the forecast period?
Get Key Insights on Market Forecast (PDF) Request Free Sample
How is the US Beef Market Segmented?
The us beef industry research report provides comprehensive data (region-wise segment analysis), with forecasts and analysis for the period 2026-2030, as well as historical data from 2020-2024 for the following segments.
- Distribution channel
- Offline
- Online
- Type
- Loin
- Brisket
- Shank
- Others
- Product
- Fresh beef
- Processed beef
- Geography
- North America
- US
- North America
How is the US Beef Market Segmented by Distribution Channel?
The offline segment is estimated to witness significant growth during the forecast period.
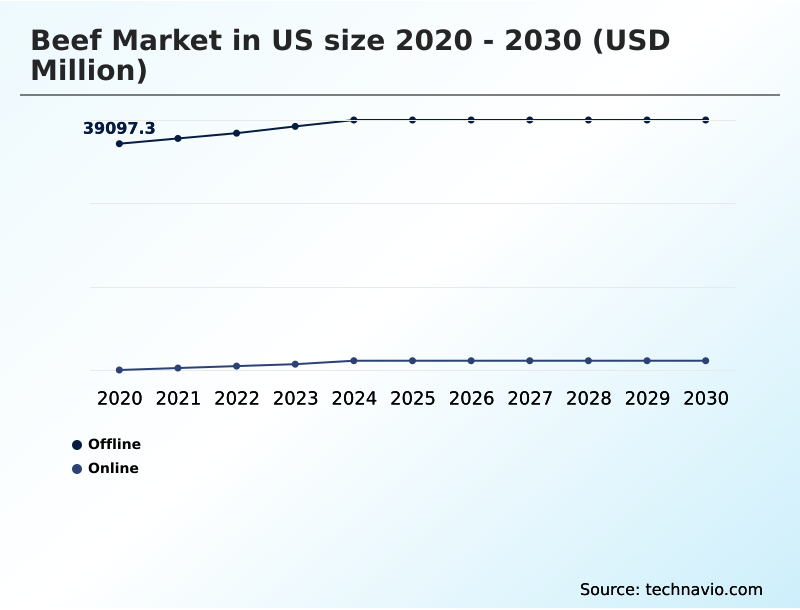
The offline channel, representing over 90% of sales, is the bedrock of the beef market, driven by consumer preference for visually inspecting meat. Supermarkets and foodservice dominate this space, with ground beef alone comprising more than half of retail volume.
However, historically low cow-and-bull slaughter rates have tightened supply, affecting food price stability. This has shifted focus to premium segments like grass-fed beef and crossbred wagyu, where consumer willingness to pay is higher.
Retailers are using this premiumization to offset rising costs, leveraging enhanced displays to justify higher price points for products with superior marbling and longer finishing time, even without digital traceability.
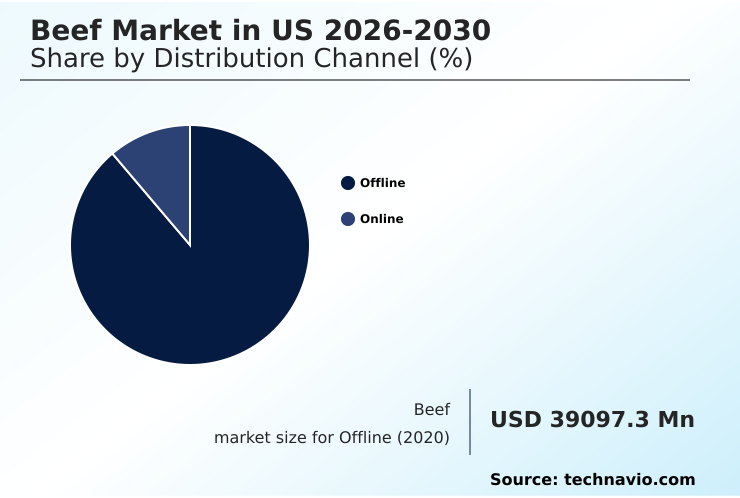
The Offline segment was valued at USD 42.68 billion in 2024 and showed a gradual increase during the forecast period.
What are the key Drivers, Trends, and Challenges in the US Beef Market?
Our researchers analyzed the data with 2025 as the base year, along with the key drivers, trends, and challenges. A holistic analysis of drivers will help companies refine their marketing strategies to gain a competitive advantage.
- The beef market in US is grappling with significant structural changes, where the impact of herd contraction on beef prices remains a central concern for both producers and consumers. With the national herd at a 75-year low, retail prices have seen increases of over 15% for some premium cuts.
- This has amplified the focus on us beef market supply chain challenges, forcing processors to enhance efficiency and explore alternative sourcing for lean trim. In response, producers are increasingly adopting ai driven cattle health optimization technologies, which use IoT sensors and predictive analytics to improve feed conversion and carcass yield, boosting output by up to 5% per head.
- Simultaneously, evolving consumer trends in premium beef are driving demand for products with verifiable sustainability claims. This shift is elevating the importance of understanding the regenerative grazing impact on beef quality, where practices that improve soil health are linked to enhanced meat flavor profiles and command a significant market premium.
- This complex interplay between supply scarcity, technological adoption, and consumer preference is redefining profitability and sustainability benchmarks across the industry, from cow-calf operations to the final retail product.
What are the key market drivers leading to the rise in the adoption of US Beef Industry?
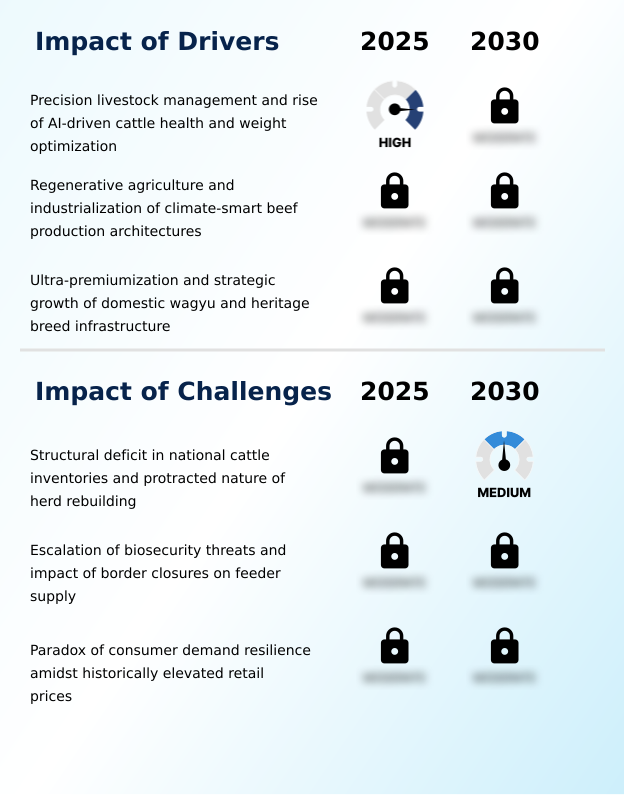
- The rise of precision livestock management, including AI-driven cattle health and weight optimization systems, is a key driver enhancing supply chain efficiency and operational profitability.
- A key driver is the dual push of ultra-premiumization and sustainability, creating significant demand for domestic wagyu and heritage breed beef. These niche products, often commanding a 40% price premium, rely on verifiable production stories enabled by blockchain-based traceability.
- Concurrently, the adoption of regenerative agriculture, which includes practices like rotational grazing and advanced soil health monitoring, is becoming a market differentiator. Producers are using genomic selection to optimize genetics for both high-end marbling and climate resilience.
- This shift not only caters to eco-conscious consumers but also provides a buffer against operational disruptions like biosecurity threats.
What are the market trends shaping the US Beef Industry?
- A strategic shift in supply dynamics is reshaping the market, driven by a significant contraction in herd inventories to multi-decade lows. This structural realignment compels a transition from volume-based growth to a value-driven model.
- A fundamental trend is the institutionalization of herd inventory contraction, which has shrunk the national cattle supply to a 75-year low, causing significant shifts in supply chain integration. This scarcity is a primary factor behind record retail beef prices, yet consumer demand resilience has remained surprisingly strong.
- The industry is responding by maximizing carcass yield from fewer animals, with feedlot finishing operations leveraging precision nutrition to improve marbling quality by over 10% in some cases. This value-driven approach is critical as cow-calf operations slowly begin the multi-year herd rebuilding process, ensuring that every animal contributes more to the final output.
What challenges does the US Beef Industry face during its growth?
- A structural deficit in national cattle inventories and the protracted nature of herd rebuilding present a significant challenge, creating long-term supply-side constraints and price volatility.
- The primary challenge is a severe supply-side constraint stemming from a protracted national inventory deficit, which is exacerbated by biosecurity risks. The threat of transboundary animal diseases has led to restrictions on livestock movements, further tightening the feeder cattle supply and increasing reliance on domestic stock. This has driven placement costs for feedlots up by over 25% in some regions.
- While processors are investing in automated fabrication and automated weight-monitoring to improve efficiency, the fundamental scarcity of animals remains. The situation heightens the threat from lower-priced protein substitutes and forces the industry to consider supply chain diversification and land restoration as long-term resilience strategies.
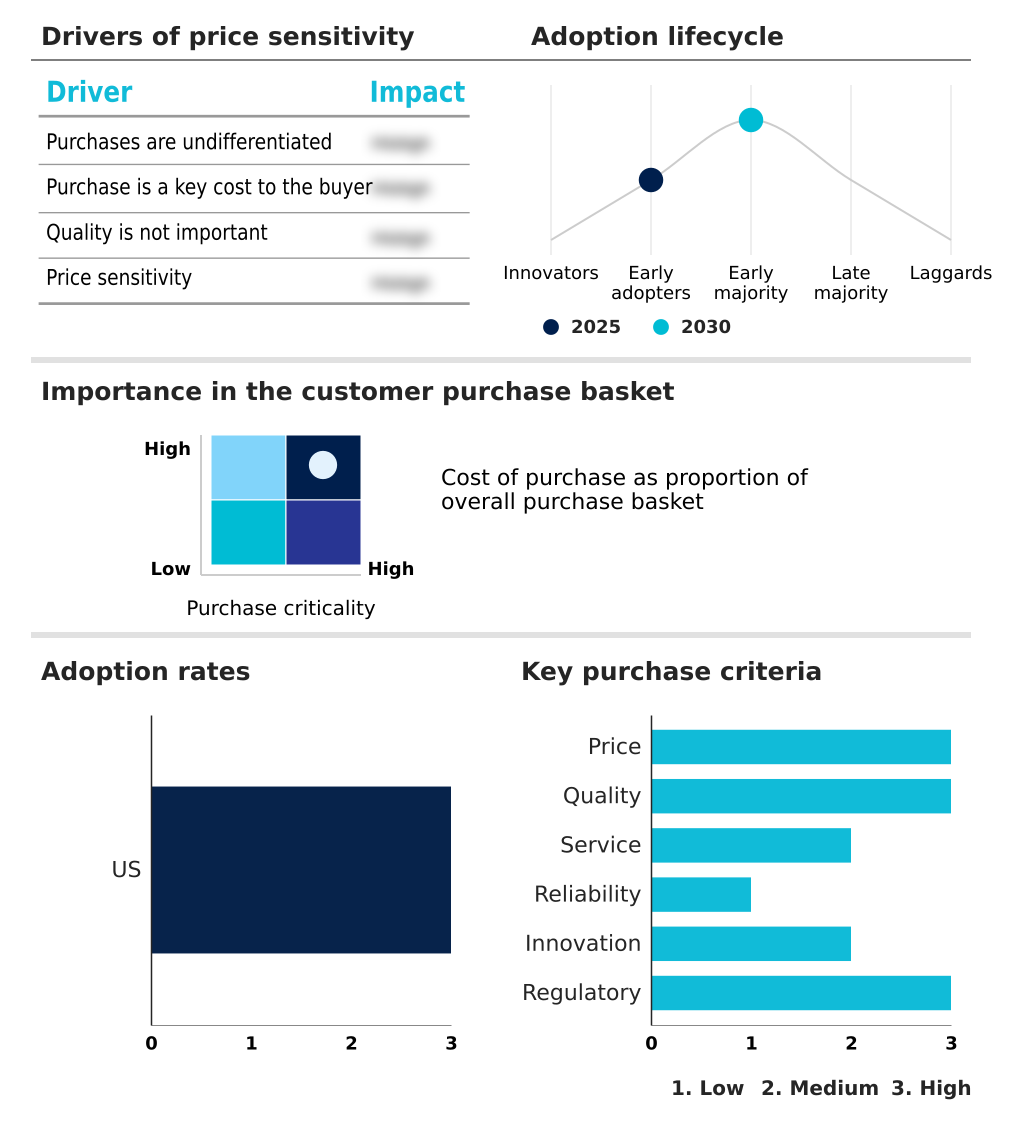
Exclusive Technavio Analysis on Customer Landscape
The us beef market forecasting report includes the adoption lifecycle of the market, covering from the innovator’s stage to the laggard’s stage. It focuses on adoption rates in different regions based on penetration. Furthermore, the us beef market report also includes key purchase criteria and drivers of price sensitivity to help companies evaluate and develop their market growth analysis strategies.
Customer Landscape of US Beef Industry
Competitive Landscape
Companies are implementing various strategies, such as strategic alliances, us beef market forecast, partnerships, mergers and acquisitions, geographical expansion, and product/service launches, to enhance their presence in the industry.
Agri Beef Co. - Key vendors provide integrated supply chain solutions, from ranching and precision nutrition to large-scale processing of value-added beef products for global retail and foodservice.
The industry research and growth report includes detailed analyses of the competitive landscape of the market and information about key companies, including:
- Agri Beef Co.
- B and W Foods
- Cargill Inc.
- Conagra Brands Inc.
- CTI Foods LLC
- Greater Omaha Packing Co.
- Green Vista Farm LLC
- Hormel Foods Corp.
- JBS SA
- Marfrig Global Foods SA
- Minerva Foods SA
- NH Foods Ltd.
- OSI Group LLC
- Perdue Farms Inc.
- Premium Brands Holdings Corp.
- Rain Crow Ranch
- Stoltzfus Meats
- Sysco Corp.
- Tyson Foods Inc.
- Verde Farms
Qualitative and quantitative analysis of companies has been conducted to help clients understand the wider business environment as well as the strengths and weaknesses of key industry players. Data is qualitatively analyzed to categorize companies as pure play, category-focused, industry-focused, and diversified; it is quantitatively analyzed to categorize companies as dominant, leading, strong, tentative, and weak.
Market Intelligence Radar: High-Impact Developments & Growth Signals
- In the Packaged Foods and Meats industry, the institutionalization of stringent food safety regulations has mandated enhanced traceability and biosecurity protocols, directly impacting the beef market by increasing compliance costs and necessitating investments in systems like blockchain-based traceability to manage supply chain integration.
- The expansion of private-label programs within major retail channels is creating new competitive dynamics, which for the beef market, pressures branded product margins but also offers high-volume opportunities for processors capable of meeting retailer specifications, influencing retail beef prices.
- A significant consumer shift toward foods with clear health and wellness attributes, including minimally processed and high-protein options, is reshaping product development, directly benefiting the beef market by reinforcing demand for lean cuts and spurring innovation in grass-fed and organic offerings.
- The rapid growth of online retail and direct-to-consumer e-commerce platforms has created alternative distribution channels, enabling beef producers in niche segments like heritage breed or domestic wagyu to bypass traditional intermediaries, foster direct consumer relationships, and capture higher margins.
Dive into Technavio’s robust research methodology, blending expert interviews, extensive data synthesis, and validated models for unparalleled US Beef Market insights. See full methodology.
| Market Scope | |
|---|---|
| Page number | 183 |
| Base year | 2025 |
| Historic period | 2020-2024 |
| Forecast period | 2026-2030 |
| Growth momentum & CAGR | Accelerate at a CAGR of 3.4% |
| Market growth 2026-2030 | USD 9263.9 million |
| Market structure | Fragmented |
| YoY growth 2025-2026(%) | 3.3% |
| Key countries | US |
| Competitive landscape | Leading Companies, Market Positioning of Companies, Competitive Strategies, and Industry Risks |
Research Analyst Overview
- The beef market ecosystem in the US operates as a complex value chain, starting with cow-calf operators, who are currently benefiting from record-high calf prices due to inventory shortages. These animals move to feedlots and then to a highly concentrated processing sector, where the top four packers handle over 80% of all fed cattle.
- This concentration creates a significant bottleneck, influencing pricing for both producers and buyers. Regulatory bodies like the USDA enforce stringent safety and grading standards, which are critical for maintaining consumer trust and export market access. Distribution is bifurcated between retail channels, where ground beef makes up over 50% of sales, and foodservice, which drives demand for premium cuts.
- The entire system is shaped by consumer demand resilience, which has remained strong despite record prices, and is increasingly influenced by factors like traceability and sustainability practices like regenerative agriculture.
What are the Key Data Covered in this US Beef Market Research and Growth Report?
-
What is the expected growth of the US Beef Market between 2026 and 2030?
-
The US Beef Market is expected to grow by USD 9.26 billion during 2026-2030, registering a CAGR of 3.4%. Year-over-year growth in 2026 is estimated at 3.3%%. This acceleration is shaped by precision livestock management and rise of ai-driven cattle health and weight optimization, which is intensifying demand across multiple end-use verticals covered in the report.
-
-
What segmentation does the market report cover?
-
The report is segmented by Distribution Channel (Offline, and Online), Type (Loin, Brisket, Shank, and Others), Product (Fresh beef, and Processed beef) and Geography (North America). Among these, the Offline segment is estimated to witness significant growth during the forecast period, driven by rising adoption across key application areas. Each segment includes detailed qualitative and quantitative analysis, along with historical data from 2020-2024 and forecasts through 2030 with year-over-year growth rates.
-
-
Which regions are analyzed in the report?
-
The report covers North America. Country-level analysis includes US, with dedicated market size tables and year-over-year growth for each.
-
-
What are the key growth drivers and market challenges?
-
The primary driver is precision livestock management and rise of ai-driven cattle health and weight optimization, which is accelerating investment and industry demand. The main challenge is structural deficit in national cattle inventories and protracted nature of herd rebuilding, creating operational barriers for key market participants. The report quantifies the impact of each driver and challenge across 2026 and 2030 with comparative analysis.
-
-
Who are the major players in the US Beef Market?
-
Key vendors include Agri Beef Co., B and W Foods, Cargill Inc., Conagra Brands Inc., CTI Foods LLC, Greater Omaha Packing Co., Green Vista Farm LLC, Hormel Foods Corp., JBS SA, Marfrig Global Foods SA, Minerva Foods SA, NH Foods Ltd., OSI Group LLC, Perdue Farms Inc., Premium Brands Holdings Corp., Rain Crow Ranch, Stoltzfus Meats, Sysco Corp., Tyson Foods Inc. and Verde Farms. The report provides qualitative and quantitative analysis categorizing companies as dominant, leading, strong, tentative, and weak based on their market positioning. Company profiles include business segment analysis, SWOT assessment, key offerings, and recent strategic developments.
-
Market Research Insights
- The competitive landscape is dominated by a few major players who control over 80% of the processing capacity, creating intense rivalry for a shrinking supply of cattle. Major processors like Tyson Foods are consolidating operations by closing less efficient plants to optimize their network, a direct response to tighter margins.
- This environment is further shaped by strategic government actions, such as the increase of the tariff-rate quota for lean beef trimmings by 80,000 metric tons, aimed at stabilizing domestic ground beef prices. These actions highlight the challenge of balancing processor profitability with consumer affordability.
- In response, companies are accelerating investments in technology, leveraging precision genomics and advanced traceability to enhance carcass yield and differentiate their products in a market characterized by historic supply constraints and resilient consumer demand.
We can help! Our analysts can customize this us beef market research report to meet your requirements.
 RIA -
RIA - 
