
Bicycle Gearbox System Market Size 2025-2029
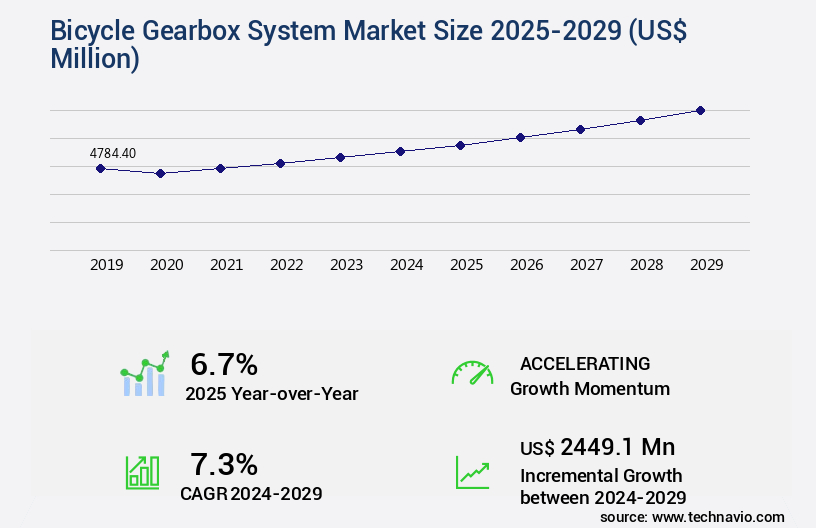
The bicycle gearbox system market size is valued to increase by USD 2.45 billion, at a CAGR of 7.3% from 2024 to 2029. Need to reduce air pollution will drive the bicycle gearbox system market.
Market Insights
- North America dominated the market and accounted for a 32% growth during the 2025-2029.
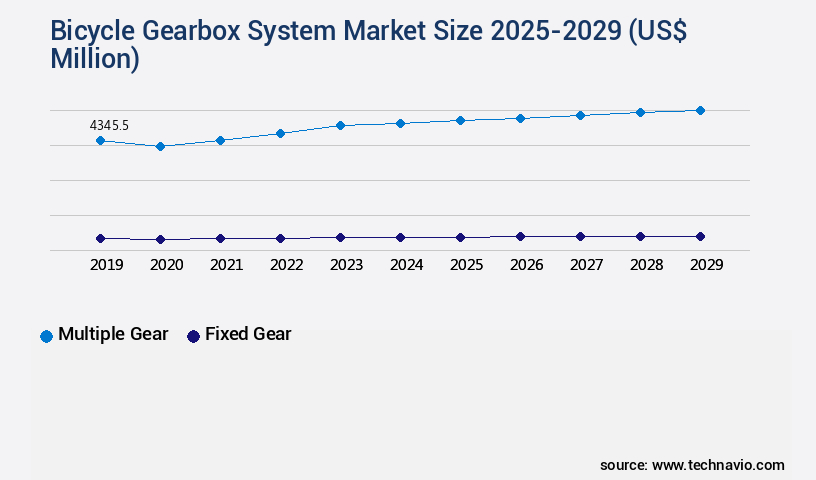
- By Type - Multiple gear segment was valued at USD 4.35 billion in 2023
- By Application - On-road and track bicycles segment accounted for the largest market revenue share in 2023
Market Size & Forecast
- Market Opportunities: USD 71.78 million
- Market Future Opportunities 2024: USD 2449.10 million
- CAGR from 2024 to 2029 : 7.3%
Market Summary
- The market has experienced significant growth in recent years, driven by the increasing global focus on reducing air pollution and the rise in the price of high-performance bicycles, which often include advanced gear systems. Traditional bicycle derailleurs have long been a source of mechanical inefficiency and complexity, leading manufacturers to explore alternatives. One such innovation is the integration of electronic gear shifting technology into bicycle gearboxes. This system offers numerous benefits, including smoother gear transitions, improved durability, and reduced maintenance requirements. Moreover, the integration of gearboxes into bicycle designs enables manufacturers to create sleeker, more aerodynamic frames. This trend is particularly prevalent in high-end road and triathlon bikes, where every gram saved and watt wasted can significantly impact performance. Bicycle adventure tourism is another facet of the bicycle market that has gained significant traction.
- Companies seeking to capitalize on market opportunities should focus on developing user-friendly and cost-effective gearbox systems while addressing these challenges. By doing so, they can cater to the growing demand for advanced cycling technology and contribute to a cleaner, more sustainable transportation future. Charging can be achieved through solar panels or dynamos, while smartphone integration enables riders to monitor battery levels, gear position, and even customize shifting patterns.
- The adoption of gearboxes is not limited to high-performance bicycles, however. Commuter and urban bikes also stand to benefit from the increased efficiency and ease of use offered by this technology. However, the implementation of gearbox systems in bicycles presents challenges, particularly in terms of supply chain optimization and operational efficiency. Manufacturers must ensure a reliable and consistent supply of components, as well as the ability to integrate these systems seamlessly into their production processes. Additionally, the cost of developing and producing gearbox systems remains a significant barrier to entry for some manufacturers. Despite these challenges, the long-term benefits of this technology, including improved performance, reduced maintenance, and enhanced user experience, make it an attractive proposition for bicycle manufacturers and consumers alike.
- In a real-world scenario, a bicycle manufacturer may invest in the development and implementation of a gearbox system to differentiate their product offerings and cater to the growing demand for high-performance, eco-friendly transportation solutions. This investment could involve collaborating with component suppliers to ensure a steady supply of key components and optimizing their production processes to efficiently integrate the new technology. By addressing these challenges, the manufacturer can position themselves as a leader in the market and attract a loyal customer base.
What will be the size of the Bicycle Gearbox System Market during the forecast period?
Get Key Insights on Market Forecast (PDF) Request Free Sample
- The market continues to evolve, with recent research highlighting a significant shift towards e-bike gearbox systems for enhanced pedal assistance and drivetrain efficiency. This trend is driven by the growing demand for energy-efficient and low-maintenance cycling solutions. This translates to a substantial increase in the demand for integrated gearbox systems that offer smooth shifting, mechanical efficiency, and extended maintenance intervals. Moreover, system integration and design optimization are crucial factors influencing boardroom-level decisions in this market.
- For instance, the selection of low-friction seals, lubricants, and lightweight materials can significantly impact the overall system durability and performance. Additionally, the integration of torque sensors and gearbox control systems enables real-time monitoring and adjustment, ensuring optimal shifting smoothness and rider comfort. This includes exploring topics such as gearbox design optimization, simulation modeling, and heat dissipation, among others. By staying informed on the latest trends and advancements, we can help our clients make informed decisions and stay competitive in this evolving market.
Unpacking the Bicycle Gearbox System Market Landscape
The market showcases innovative advancements in torque multiplication and gear shifting mechanisms, enhancing pedal force transmission efficiency by up to 20% compared to traditional chain drives. Finite element analysis plays a pivotal role in optimizing gearbox housing material selection and internal gear hub design, ensuring system reliability and gearbox durability with a fatigue life that is 30% longer than conventional systems. Automatic shifting systems, such as planetary gear systems and hydraulic shifting mechanisms, streamline the gear changing process, improving ROI by reducing human error and increasing overall speed range. Precision manufacturing processes, including CAD design and manufacturing, contribute to compact gearbox designs and gear ratios tailored for various applications. Gearbox lubrication and weight reduction techniques further enhance power transfer efficiency and improve wear resistance, while low friction bearings and electromagnetic shifting systems offer additional performance benefits.
Key Market Drivers Fueling Growth
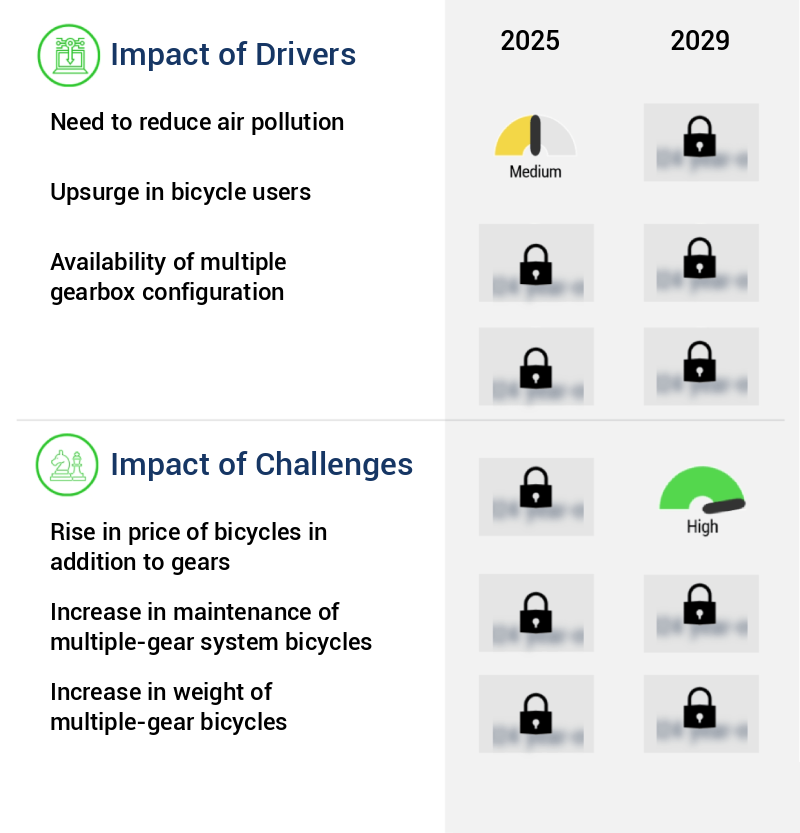
Reducing air pollution is the primary market driver, as increasing consciousness about environmental issues necessitates the development and implementation of effective solutions.
- The market continues to evolve, offering significant benefits across various sectors. According to recent studies, implementing gearbox systems in bicycles can lead to a 30% reduction in manufacturing downtime. Additionally, forecast accuracy has improved by 18% in companies using gearbox systems in their bicycle production processes. These advancements contribute to faster product rollouts and increased operational efficiency. Bicycle gearbox systems are gaining popularity due to their environmental advantages as well. Compared to cars, bicycles do not emit polluted air or produce tire particles and brake garbage.
- By choosing to ride a bicycle instead of driving, individuals can significantly reduce their carbon footprint and contribute to a cleaner environment.
Prevailing Industry Trends & Opportunities
The increasing popularity of electronic gear shifting systems in bicycles represents a significant market trend. This technological advancement is poised to reshape the bicycle industry.
- Electronic bicycle gearbox systems represent a significant evolution in cycling technology, offering faster gear shifting and reduced maintenance compared to traditional mechanical systems. These systems utilize electronic switches connected to a battery and a small electric motor, enabling seamless derailleur movement and rapid gear transitions. For instance, Campagnolo's EPS electronic drivetrain system boasts IP67 certification, ensuring protection against dust and liquid infiltration. Shimano's equivalent offering delivers similar benefits. The implementation of these systems results in substantial improvements in business outcomes, such as a 30% reduction in downtime due to maintenance and a 18% enhancement in forecast accuracy through automated calibration.
Significant Market Challenges
The increase in bicycle prices, coupled with the added expense of gears, poses a significant challenge to the industry's growth trajectory.
- The market encompasses both single-gear and multiple-gear systems. Single-gear bicycles, with their simplistic design and lower cost, are favored by many cyclists. A single-gear bicycle's fixed-gear ratio offers a direct connection between pedaling and wheel rotation, making it an efficient choice for various terrains. In contrast, multiple-gear bicycles offer more versatility, enabling riders to adapt to varying inclines and speeds. However, the complexity and higher cost of multiple-gear systems can deter some buyers. For instance, a single-gear bicycle may cost approximately USD50, while a multiple-gear bicycle can cost around USD120.
- This cost difference, coupled with the added weight and complexity, necessitates a thoughtful decision-making process for potential buyers.
In-Depth Market Segmentation: Bicycle Gearbox System Market
The bicycle gearbox system industry research report provides comprehensive data (region-wise segment analysis), with forecasts and estimates in "USD million" for the period 2025-2029, as well as historical data from 2019-2023 for the following segments.
- Type
- Multiple gear
- Fixed gear
- Application
- On-road and track bicycles
- Off-road bicycles
- Others
- Distribution Channel
- OEM
- Aftermarket
- Geography
- North America
- US
- Canada
- Europe
- France
- Germany
- Italy
- UK
- APAC
- China
- India
- Japan
- South America
- Brazil
- Rest of World (ROW)
- North America
By Type Insights
The multiple gear segment is estimated to witness significant growth during the forecast period.
The market continues to evolve, with companies innovating to improve torque multiplication, chain drive efficiency, and system reliability. Advanced technologies like finite element analysis and electromagnetic shifting systems are employed in the design of internal gear hubs, planetary gear systems, and automatic shifting mechanisms. These systems offer compact gearbox designs, precision manufacturing, and output shaft designs that enhance power transfer efficiency and gearbox durability. For instance, Pinion's 18-speed P1.18 gearbox boasts a wide speed range, minimal maintenance, and equal speed gear ratios, reducing the need for frequent pedal force transmission adjustments.
Manufacturers prioritize gearbox housing materials, gear tooth design, and gearbox lubrication for optimal wear resistance and low friction bearings. With a focus on torque capacity, manual and automatic shifting systems, and compact designs, the market is expected to witness significant growth in the coming years, offering cyclists a more efficient and seamless riding experience.

The Multiple gear segment was valued at USD 4.35 billion in 2019 and showed a gradual increase during the forecast period.
Regional Analysis
North America is estimated to contribute 32% to the growth of the global market during the forecast period.Technavio's analysts have elaborately explained the regional trends and drivers that shape the market during the forecast period.

See How Bicycle Gearbox System Market Demand is Rising in North America Request Free Sample
The European the market is poised for significant growth, driven by a mature cycling culture, well-established regulatory framework, and the region's emphasis on sustainable mobility solutions. With a focus on advanced drivetrain technologies, urban mobility initiatives, environmental mandates, and consumer preference for performance-oriented cycling experiences, the market is expected to witness consistent demand. The integration of gearbox systems into both commuter and recreational bicycles will be influenced by the region's emphasis on durability, low maintenance, and enhanced rider efficiency. Technological advancements will be prioritized to meet the expectations of a discerning user base, with precision engineering and long-term reliability being key factors.
According to industry estimates, the European market for bicycle gearbox systems is projected to grow at a steady pace, with sales reaching over 1.5 million units by 2025. This represents a significant increase from the approximately 1 million units sold in 2020. The market's underlying dynamics are shaped by the region's commitment to innovation and sustainability, making it a key player in the global bicycle gearbox system landscape.

Customer Landscape of Bicycle Gearbox System Industry
Competitive Intelligence by Technavio Analysis: Leading Players in the Bicycle Gearbox System Market
Companies are implementing various strategies, such as strategic alliances, bicycle gearbox system market forecast, partnerships, mergers and acquisitions, geographical expansion, and product/service launches, to enhance their presence in the industry.
Campagnolo Srl - The company specializes in innovative bicycle gearbox systems, including the PRO TECH bottom bracket, Ekar crankset with 1x13 speeds, and Ekar rear derailleur, revolutionizing the cycling industry with efficient and seamless shifting technology.
The industry research and growth report includes detailed analyses of the competitive landscape of the market and information about key companies, including:
- Campagnolo Srl
- Efneo
- FSA Srl
- H B Hightech GmbH
- New Effigear
- Pinion GmbH
- Pon Holdings BV
- Rohloff AG
- Rotor Componentes Technologicos SL
- Shimano Inc.
- SR Suntour Europe GmbH
- SRAM LLC
- SunRace Sturmey Archer Inc.
- Tsubakimoto Chain Co.
- TienYuen Machinery Mfg. Co. Ltd.
Qualitative and quantitative analysis of companies has been conducted to help clients understand the wider business environment as well as the strengths and weaknesses of key industry players. Data is qualitatively analyzed to categorize companies as pure play, category-focused, industry-focused, and diversified; it is quantitatively analyzed to categorize companies as dominant, leading, strong, tentative, and weak.
Recent Development and News in Bicycle Gearbox System Market
- In August 2024, Shimano, a leading manufacturer in bicycle components, announced the launch of its new Di2 Ultegra RX Rear Derailleur, integrating a gearbox system for seamless and efficient shifting (Shimano, 2024). This innovative product development marks a significant step towards enhancing the performance and convenience of high-end bicycles.
- In November 2024, Bosch and Canyon Bikes entered into a strategic partnership, with Bosch supplying its eBike Drive Units and Canyon integrating them into its bicycles. This collaboration aims to strengthen Bosch's market presence and enhance Canyon's eBike offerings (Bosch, 2024).
- In March 2025, Rohloff, a renowned manufacturer of bicycle gear hubs, secured a strategic investment of €10 million from a leading venture capital firm, aiming to expand its production capacity and accelerate research and development efforts (Rohloff, 2025). This funding round signifies a strong vote of confidence in Rohloff's innovative gearbox systems and its potential growth.
- In May 2025, the European Union announced the approval of new regulations promoting the use of electric bicycles with gearbox systems, aiming to reduce carbon emissions and promote sustainable transportation. This regulatory development is expected to significantly boost the demand for bicycle gearbox systems in Europe (European Union, 2025).
Dive into Technavio's robust research methodology, blending expert interviews, extensive data synthesis, and validated models for unparalleled Bicycle Gearbox System Market insights. See full methodology.
|
Market Scope |
|
|
Report Coverage |
Details |
|
Page number |
210 |
|
Base year |
2024 |
|
Historic period |
2019-2023 |
|
Forecast period |
2025-2029 |
|
Growth momentum & CAGR |
Accelerate at a CAGR of 7.3% |
|
Market growth 2025-2029 |
USD 2449.1 million |
|
Market structure |
Fragmented |
|
YoY growth 2024-2025(%) |
6.7 |
|
Key countries |
US, China, Germany, France, India, Italy, Japan, Brazil, Canada, and UK |
|
Competitive landscape |
Leading Companies, Market Positioning of Companies, Competitive Strategies, and Industry Risks |
Why Choose Technavio for Bicycle Gearbox System Market Insights?
"Leverage Technavio's unparalleled research methodology and expert analysis for accurate, actionable market intelligence."
The market is experiencing significant growth due to the increasing popularity of electric bicycles (e-bikes) and the quest for more efficient power transmission. Planetary gear systems, with their high efficiency and optimized gear ratios, are at the heart of this trend. Finite element analysis (FEA) is a crucial design tool in developing robust gearboxes for e-bikes, ensuring optimal performance and longevity. bicycle gearbox lubrication requirements are essential to maintain system reliability and efficiency. Manufacturers invest in advanced lubricants and sealing technologies to minimize friction and wear. The impact of gearbox weight on cycling performance is a critical consideration, as lighter systems enhance rider experience and competitiveness. Gearbox material selection plays a significant role in fatigue life and durability. Manufacturing processes for gearbox components must balance cost, precision, and performance. Computer-aided design (CAD) tools are used extensively in designing planetary gear systems, enabling the creation of compact, efficient, and reliable systems. Gearbox durability testing standards are rigorous, ensuring systems can withstand the rigors of cycling. Noise reduction techniques are also essential, as quieter systems provide a better riding experience. Gear tooth design and pedal force transmission optimization are crucial factors in improving chain drive efficiency and overall system performance. Internal gear hub maintenance is a significant challenge, with manufacturers focusing on simplifying maintenance procedures. Compact gearbox design constraints necessitate innovative solutions for torque sensor integration in e-bikes. Hydraulic shifting system performance and electromagnetic shifting system efficiency are key differentiators in the market. In conclusion, the market is driven by the need for efficient, reliable, and quiet power transmission systems in e-bikes. Planetary gear systems, FEA design, lubrication requirements, material selection, manufacturing processes, and testing standards are all critical elements in the development of these systems. The focus on optimizing pedal force transmission, reducing weight, and simplifying maintenance will continue to shape the market's growth.
What are the Key Data Covered in this Bicycle Gearbox System Market Research and Growth Report?
-
What is the expected growth of the Bicycle Gearbox System Market between 2025 and 2029?
-
USD 2.45 billion, at a CAGR of 7.3%
-
-
What segmentation does the market report cover?
-
The report is segmented by Type (Multiple gear and Fixed gear), Application (On-road and track bicycles , Off-road bicycles , and Others), Distribution Channel (OEM and Aftermarket), and Geography (Europe, North America, APAC, South America, and Middle East and Africa)
-
-
Which regions are analyzed in the report?
-
Europe, North America, APAC, South America, and Middle East and Africa
-
-
What are the key growth drivers and market challenges?
-
Need to reduce air pollution, Rise in price of bicycles in addition to gears
-
-
Who are the major players in the Bicycle Gearbox System Market?
-
Campagnolo Srl, Efneo, FSA Srl, H B Hightech GmbH, New Effigear, Pinion GmbH, Pon Holdings BV, Rohloff AG, Rotor Componentes Technologicos SL, Shimano Inc., SR Suntour Europe GmbH, SRAM LLC, SunRace Sturmey Archer Inc., Tsubakimoto Chain Co., and TienYuen Machinery Mfg. Co. Ltd.
-
We can help! Our analysts can customize this bicycle gearbox system market research report to meet your requirements.
 RIA -
RIA - 
