Biofuel From Sugar Crops Market Analysis South America, APAC, North America, Europe, Middle East and Africa - Brazil, India, US, China, France - Size and Forecast 2024-2028

Biofuel From Sugar Crops Market Analysis South America, APAC, North America, Europe, Middle East and Africa - Brazil, India, US, China, France - Size and Forecast 2024-2028

Published: Jul 2024 144 Pages SKU: IRTNTR74237

Market Overview at a Glance

$509.1 Mn
Market Opportunity
3.19%
CAGR
3.09
YoY growth 2023-2024(%)

Biofuel From Sugar Crops Market Size 2024-2028

The biofuel from sugar crops market size is forecast to increase by USD 509.1 million at a CAGR of 3.19% between 2023 and 2028.

  • The market is experiencing significant growth, driven by the increased adoption of renewable sources of energy and the rising need for cleaner fuels. This trend is further bolstered by fluctuations in oil prices, which have made biofuels more economically viable. The market is expected to continue its upward trajectory, with key players focusing on improving production efficiency and reducing costs. Advanced biofuels, such as cellulosic ethanol and biodiesel, are also gaining popularity due to their potential to reduce carbon emissions.  Additionally, governments worldwide are implementing policies to promote the use of biofuels, creating a favorable regulatory environment. However, challenges such as competition with food crops for land usage and water resources, as well as sustainability concerns, must be addressed to ensure the long-term growth and success of the market.

What will be the Size of the Biofuel From Sugar Crops Market During the Forecast Period?

Biofuel From Sugar Crops Market Size

 Request Free Sample

  • The market is witnessing significant growth due to increasing environmental concerns and the need for clean energy. With the awareness of reducing greenhouse gas emissions and moving away from conventional fuels like coal and natural gas, biofuels derived from sugar crops have gained prominence. Sugarcane is a major source of biofuels, particularly ethanol, which is widely used as a blended fuel in the automotive sector. Governments around the world are implementing taxes and mandates to encourage the use of biofuels, providing tax benefits to producers and consumers. Corn is another significant biofuel-producing crop, with ethanol being the most common biofuel derived from it.
  • The infrastructure required for the production and distribution of biofuels is a key challenge, but the market is expected to continue its growth trajectory in the coming years. Prices of conventional biofuels and conventional fuels also play a role in the market dynamics. Cutting edge innovators are shaping business strategies to navigate the global market scenario, with in-depth studies on profit margins, pricing models, promotions, and the influence of industry leaders driving market success.

How is this Biofuel From Sugar Crops Industry segmented and which is the largest segment?

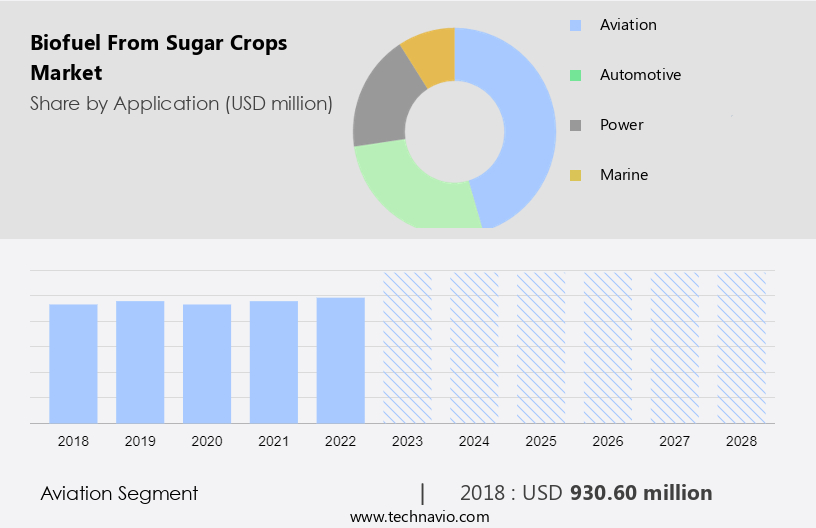
The industry research report provides comprehensive data (region-wise segment analysis), with forecasts and estimates in "USD million" for the period 2024-2028, as well as historical data from 2018-2022 for the following segments.

  • Application
    • Aviation
    • Automotive
    • Power
    • Marine
  • Geography
    • South America
      • Brazil
    • APAC
      • China
      • India
    • North America
      • US
    • Europe
      • France
    • Middle East and Africa

By Application Insights

  • The aviation segment is estimated to witness significant growth during the forecast period.

The market derived from sugar crops is gaining significant traction due to environmental concerns and the need for clean energy. Traditional fuels, such as coal and natural gas, contribute substantially to greenhouse gas emissions, leading to a shift towards biofuels. The automotive sector is a major consumer of biofuels, with ethanol derived from sugarcane being a popular choice. Governments worldwide have implemented taxes, mandates, and incentives to promote the use of blended fuels and offer tax benefits to consumers. Biofuel-producing crops like sugarcane and corn are at the forefront of this transition. Advanced biofuels, such as cellulosic ethanol, are also gaining momentum due to their potential to reduce carbon emissions and improve efficiency.

Companies are investing heavily in research and development to innovate and improve their product and business strategies. Environmental concerns and energy security are key drivers of government support for biofuels. The framework for biofuels production and consumption is evolving, with a focus on creating a cleaner and more sustainable energy future. The GDP impact of the biofuels industry is significant, with investments in biofuels expected to continue growing in the coming years. The use of biofuels in the aviation sector is also gaining attention due to its potential to reduce carbon emissions and improve energy efficiency. As awareness of the environmental benefits of biofuels grows, the market is expected to expand further.

Biofuel From Sugar Crops Market Size

Get a glance at the market report of share of various segments Request Free Sample

The Aviation segment was valued at USD 930.60 million in 2018 and showed a gradual increase during the forecast period.

Regional Analysis

  • APAC is estimated to contribute 41% to the growth of the global market during the forecast period.

Technavio's analysts have elaborately explained the regional trends and drivers that shape the market during the forecast period.

Biofuel From Sugar Crops Market Share by Geography

For more insights on the market size of various regions, Request Free Sample

The biofuel market from sugar crops is gaining significant attention due to environmental concerns and the need for clean energy alternatives to conventional fuels such as coal and natural gas. Biofuel producing crops, particularly sugarcane for ethanol and corn for corn ethanol, have emerged as viable solutions for reducing greenhouse gas emissions in the automotive sector. Government mandates and taxes, including carbon taxes, have been implemented to incentivize the use of blended fuels and provide tax benefits to automobile owners. Advanced biofuels, such as cellulosic ethanol and biodiesel, are also gaining traction due to their potential to offer greater efficiency and lower carbon footprint compared to conventional biofuels.

Companies in this sector are actively investing in research and development to innovate and improve their product and business strategies. The environmental and energy security concerns, coupled with government support for cleaner fuels, have created a favorable framework for investments in biofuels. The market is expected to grow significantly, contributing to the GDP and creating new jobs. The efficiency of airlines and other transportation sectors can also be improved by utilizing biofuels, further increasing their demand.

Market Dynamics

Our researchers analyzed the data with 2023 as the base year, along with the key drivers, trends, and challenges. A holistic analysis of drivers will help companies refine their marketing strategies to gain a competitive advantage.

What are the key market drivers leading to the rise in the adoption of Biofuel From Sugar Crops Industry?

Increased adoption of renewable sources of energy is the key driver of the market.

  • The environmental concerns associated with the emission of greenhouse gases (GHG) from conventional fuels such as coal and natural gas have led to a growing awareness and demand for cleaner energy sources. Renewable biofuels derived from sugar crops, like sugarcane and corn, are gaining popularity as viable alternatives to conventional fuels in various sectors, including the automotive industry. Ethanol, a common biofuel produced from sugarcane, is increasingly being used as a blended fuel with gasoline to reduce GHG emissions. Government mandates and taxes are key drivers for the biofuel market. For instance, the US Renewable Fuel Standard (RFS) mandates the use of a certain percentage of renewable fuels in transportation fuel.
  • Similarly, tax benefits and carbon taxes incentivize companies to invest in biofuels. The automotive sector is a significant consumer of biofuels, with automobiles accounting for a significant portion of global GHG emissions. The use of biofuels in the aviation industry is also gaining traction due to energy security concerns and the need for cleaner fuels. The market is witnessing significant investments, with companies adopting cutting-edge product and business strategies to stay active and competitive. Advanced biofuels, such as cellulosic ethanol and biodiesel, are expected to play a crucial role in reducing GHG emissions further. The market is expected to grow significantly in the coming years, with various frameworks and company profiles shaping the industry landscape.

What are the market trends shaping the Biofuel From Sugar Crops Industry?

Rising need for cleaner fuels is the upcoming market trend.

  • The global shift towards cleaner and renewable energy sources has led to a growing emphasis on biofuels as an alternative to conventional fuels such as coal and natural gas. Environmental concerns, including the emission of greenhouse gases, have heightened awareness of the need for sustainable energy solutions. Biofuel producing crops, like sugarcane and corn, have emerged as viable options for producing ethanol and other advanced biofuels. The automotive sector is a significant consumer of these biofuels, with blended fuels increasingly being used in vehicles with minimal engine modifications. This trend is particularly prevalent in regions with stringent emission norms, such as Europe, where the use of cleaner fuels is mandated.
  • The implementation of taxes and mandates to promote biofuels has further incentivized investments in this sector. Biofuels offer several advantages, including reduced greenhouse gas emissions, energy security, and improved efficiency in various sectors, including aviation. However, the infrastructure required for the production and distribution of biofuels can be costly. Companies in this space are actively innovating and implementing cutting-edge product and business strategies to address these challenges and remain competitive. Government support, in the form of subsidies and tax benefits, continues to play a crucial role in the growth of the biofuels industry. Advanced biofuels, such as cellulosic ethanol, are expected to offer greater efficiency and reduced carbon footprint compared to conventional biofuels.

What challenges does the Biofuel From Sugar Crops Industry face during its growth?

Fluctuations in oil prices is a key challenge affecting the industry growth.

  • The market faces competition from conventional fuels, primarily coal and natural gas, in the energy sector. The increasing awareness of environmental concerns and the need for clean energy have driven the demand for biofuels. However, the volatile nature of the global crude oil industry, with its unpredictable price fluctuations, poses a challenge to the growth of this market. The automotive sector, a major consumer of biofuels, relies on blended fuels like ethanol derived from sugarcane and corn. Government mandates and tax benefits have been instrumental in promoting the use of biofuels. Advanced biofuels, such as cellulosic ethanol and biodiesel, are gaining popularity due to their higher efficiency and lower carbon footprint.
  • Despite these advantages, the market from sugar crops faces challenges in terms of infrastructure development and the high prices of conventional biofuels. The global economic framework and government support are crucial factors influencing investments in this sector. Key players in the industry are focusing on innovation and product strategy to gain a competitive edge in the market. The efficiency of airlines and energy security concerns are also driving the demand for cleaner fuels. Companies profiled in this report are active leaders in the biofuel industry, leveraging cutting-edge technology and business strategies to address the challenges and opportunities in the market.

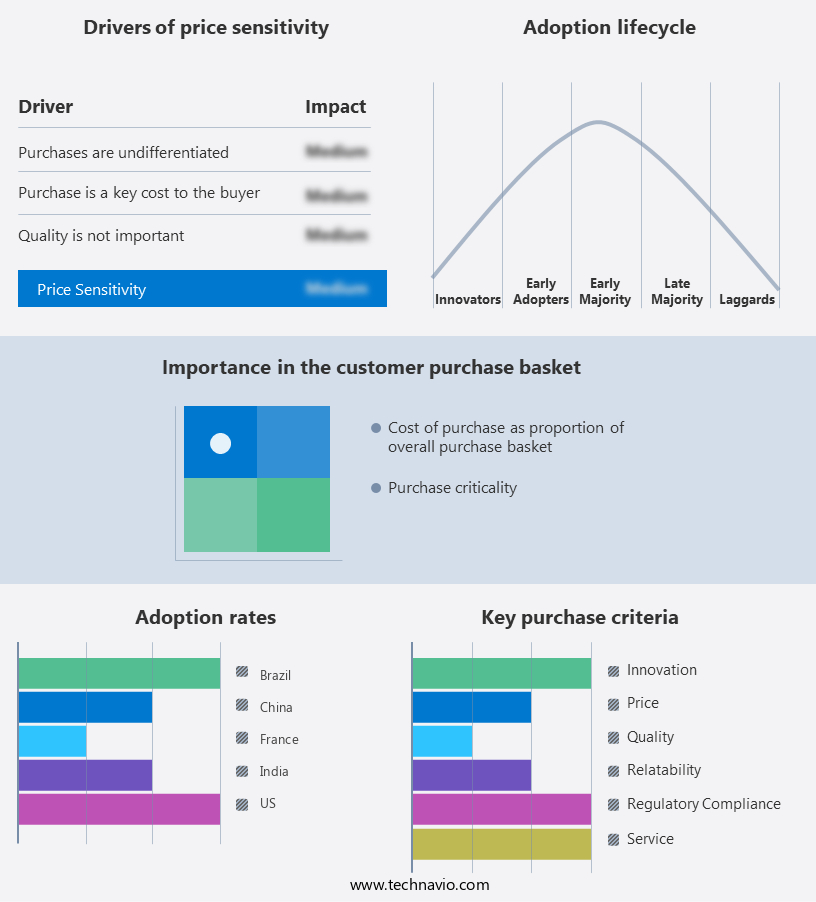
Exclusive Customer Landscape

The market forecasting report includes the adoption lifecycle of the market, covering from the innovator's stage to the laggard's stage. It focuses on adoption rates in different regions based on penetration. Furthermore, the market report also includes key purchase criteria and drivers of price sensitivity to help companies evaluate and develop their market growth analysis strategies.

Biofuel From Sugar Crops Market Share by Geography

 Customer Landscape

Key Companies & Market Insights

Companies are implementing various strategies, such as strategic alliances, market forecast, partnerships, mergers and acquisitions, geographical expansion, and product/service launches, to enhance their presence in the industry.

The industry research and growth report includes detailed analyses of the competitive landscape of the market and information about key companies, including:

  • Abengoa SA
  • ALTO INGREDIENTS Inc.
  • Archer Daniels Midland Co.
  • Aurora Cooperative Elevator Co.
  • BP Plc
  • Bunge Ltd.
  • Cargill Inc.
  • Chevron Corp.
  • Dow Inc.
  • GranBio Investimentos SA
  • My Own Eco Energy Pvt. Ltd.
  • POET LLC
  • Shell plc
  • SZVG eG
  • VERBIO Vereinigte BioEnergie AG
  • Wilmar International Ltd.
  • Woodland Biofuels Inc.

Qualitative and quantitative analysis of companies has been conducted to help clients understand the wider business environment as well as the strengths and weaknesses of key industry players. Data is qualitatively analyzed to categorize companies as pure play, category-focused, industry-focused, and diversified; it is quantitatively analyzed to categorize companies as dominant, leading, strong, tentative, and weak.

Research Analyst Overview

Biofuel from sugar crops, particularly ethanol derived from sugarcane, has emerged as a promising alternative to conventional fuels such as coal and natural gas. Environmental concerns over the increasing levels of greenhouse gases (GHGs) have led to a growing awareness for clean energy. The automotive sector is at the forefront of this transition, with blended fuels and tax incentives driving the demand for biofuels. Sugarcane is one of the most widely used biofuel producing crops, with Brazil being a leading producer of ethanol.

Moreover, ethanol production reduces GHG emissions by up to 60% compared to conventional fuels. Mandates and taxes, such as the Renewable Fuel Standard in the US and the Ethanol Blending Program in Brazil, have played a significant role in promoting the use of biofuels. The infrastructure required for the production and distribution of biofuels is a critical factor in their adoption. Companies are investing in advanced biofuels, such as cellulosic ethanol and biodiesel, to increase efficiency and reduce the reliance on conventional biofuels like corn-based ethanol. Government support and energy security concerns have also fueled investments in biofuels. Companies are adopting cutting-edge product and business strategies to stay active in this competitive market. The market is expected to grow significantly, driven by increasing GDP, government frameworks, and the need for cleaner fuels. The market is expected to witness significant growth in the coming years, with investments in research and development and the adoption of advanced technologies playing a crucial role.

Market Scope

Report Coverage

Details

Page number

144

Base year

2023

Historic period

2018-2022

Forecast period

2024-2028

Growth momentum & CAGR

Accelerate at a CAGR of 3.19%

Market growth 2024-2028

USD 509.1 million

Market structure

Fragmented

YoY growth 2023-2024(%)

3.09

Key countries

Brazil, India, US, China, and France

Competitive landscape

Leading Companies, Market Positioning of Companies, Competitive Strategies, and Industry Risks

Request Free Sample

What are the Key Data Covered in this Biofuel From Sugar Crops Market Research and Growth Report?

  • CAGR of the Biofuel From Sugar Crops industry during the forecast period
  • Detailed information on factors that will drive the market growth and forecasting between 2024 and 2028
  • Precise estimation of the size of the market and its contribution of the industry in focus to the parent market
  • Accurate predictions about upcoming growth and trends and changes in consumer behaviour
  • Growth of the market across South America, APAC, North America, Europe, and Middle East and Africa
  • Thorough analysis of the market's competitive landscape and detailed information about companies
  • Comprehensive analysis of factors that will challenge the biofuel from sugar crops market growth of industry companies

We can help! Our analysts can customize this biofuel from sugar crops market research report to meet your requirements.

Get in touch

1 Executive Summary

  • 1.1 Market overview
    • Executive Summary - Chart on Market Overview
    • Executive Summary - Data Table on Market Overview
    • Executive Summary - Chart on Global Market Characteristics
    • Executive Summary - Chart on Market by Geography
    • Executive Summary - Chart on Market Segmentation by Application
    • Executive Summary - Chart on Incremental Growth
    • Executive Summary - Data Table on Incremental Growth
    • Executive Summary - Chart on Company Market Positioning

2 Market Landscape

  • 2.1 Market ecosystem
    • Parent Market
    • Data Table on - Parent Market
  • 2.2 Market characteristics
    • Market characteristics analysis
  • 2.3 Value chain analysis
    • Value Chain Analysis

3 Market Sizing

  • 3.1 Market definition
    • Offerings of companies included in the market definition
  • 3.2 Market segment analysis
    • Market segments
  • 3.3 Market size 2023
    • 3.4 Market outlook: Forecast for 2023-2028
      • Chart on Global - Market size and forecast 2023-2028 ($ million)
      • Data Table on Global - Market size and forecast 2023-2028 ($ million)
      • Chart on Global Market: Year-over-year growth 2023-2028 (%)
      • Data Table on Global Market: Year-over-year growth 2023-2028 (%)

    4 Historic Market Size

    • 4.1 Global Biofuel From Sugar Crops Market 2018 - 2022
      • Historic Market Size - Data Table on Global Biofuel From Sugar Crops Market 2018 - 2022 ($ million)
    • 4.2 Application segment analysis 2018 - 2022
      • Historic Market Size - Application Segment 2018 - 2022 ($ million)
    • 4.3 Geography segment analysis 2018 - 2022
      • Historic Market Size - Geography Segment 2018 - 2022 ($ million)
    • 4.4 Country segment analysis 2018 - 2022
      • Historic Market Size - Country Segment 2018 - 2022 ($ million)

    5 Five Forces Analysis

    • 5.1 Five forces summary
      • Five forces analysis - Comparison between 2023 and 2028
    • 5.2 Bargaining power of buyers
      • Bargaining power of buyers - Impact of key factors 2023 and 2028
    • 5.3 Bargaining power of suppliers
      • Bargaining power of suppliers - Impact of key factors in 2023 and 2028
    • 5.4 Threat of new entrants
      • Threat of new entrants - Impact of key factors in 2023 and 2028
    • 5.5 Threat of substitutes
      • Threat of substitutes - Impact of key factors in 2023 and 2028
    • 5.6 Threat of rivalry
      • Threat of rivalry - Impact of key factors in 2023 and 2028
    • 5.7 Market condition
      • Chart on Market condition - Five forces 2023 and 2028

    6 Market Segmentation by Application

    • 6.1 Market segments
      • Chart on Application - Market share 2023-2028 (%)
      • Data Table on Application - Market share 2023-2028 (%)
    • 6.2 Comparison by Application
      • Chart on Comparison by Application
      • Data Table on Comparison by Application
    • 6.3 Aviation - Market size and forecast 2023-2028
      • Chart on Aviation - Market size and forecast 2023-2028 ($ million)
      • Data Table on Aviation - Market size and forecast 2023-2028 ($ million)
      • Chart on Aviation - Year-over-year growth 2023-2028 (%)
      • Data Table on Aviation - Year-over-year growth 2023-2028 (%)
    • 6.4 Automotive - Market size and forecast 2023-2028
      • Chart on Automotive - Market size and forecast 2023-2028 ($ million)
      • Data Table on Automotive - Market size and forecast 2023-2028 ($ million)
      • Chart on Automotive - Year-over-year growth 2023-2028 (%)
      • Data Table on Automotive - Year-over-year growth 2023-2028 (%)
    • 6.5 Power - Market size and forecast 2023-2028
      • Chart on Power - Market size and forecast 2023-2028 ($ million)
      • Data Table on Power - Market size and forecast 2023-2028 ($ million)
      • Chart on Power - Year-over-year growth 2023-2028 (%)
      • Data Table on Power - Year-over-year growth 2023-2028 (%)
    • 6.6 Marine - Market size and forecast 2023-2028
      • Chart on Marine - Market size and forecast 2023-2028 ($ million)
      • Data Table on Marine - Market size and forecast 2023-2028 ($ million)
      • Chart on Marine - Year-over-year growth 2023-2028 (%)
      • Data Table on Marine - Year-over-year growth 2023-2028 (%)
    • 6.7 Market opportunity by Application
      • Market opportunity by Application ($ million)
      • Data Table on Market opportunity by Application ($ million)

    7 Customer Landscape

    • 7.1 Customer landscape overview
      • Analysis of price sensitivity, lifecycle, customer purchase basket, adoption rates, and purchase criteria

    8 Geographic Landscape

    • 8.1 Geographic segmentation
      • Chart on Market share by geography 2023-2028 (%)
      • Data Table on Market share by geography 2023-2028 (%)
    • 8.2 Geographic comparison
      • Chart on Geographic comparison
      • Data Table on Geographic comparison
    • 8.3 South America - Market size and forecast 2023-2028
      • Chart on South America - Market size and forecast 2023-2028 ($ million)
      • Data Table on South America - Market size and forecast 2023-2028 ($ million)
      • Chart on South America - Year-over-year growth 2023-2028 (%)
      • Data Table on South America - Year-over-year growth 2023-2028 (%)
    • 8.4 APAC - Market size and forecast 2023-2028
      • Chart on APAC - Market size and forecast 2023-2028 ($ million)
      • Data Table on APAC - Market size and forecast 2023-2028 ($ million)
      • Chart on APAC - Year-over-year growth 2023-2028 (%)
      • Data Table on APAC - Year-over-year growth 2023-2028 (%)
    • 8.5 North America - Market size and forecast 2023-2028
      • Chart on North America - Market size and forecast 2023-2028 ($ million)
      • Data Table on North America - Market size and forecast 2023-2028 ($ million)
      • Chart on North America - Year-over-year growth 2023-2028 (%)
      • Data Table on North America - Year-over-year growth 2023-2028 (%)
    • 8.6 Europe - Market size and forecast 2023-2028
      • Chart on Europe - Market size and forecast 2023-2028 ($ million)
      • Data Table on Europe - Market size and forecast 2023-2028 ($ million)
      • Chart on Europe - Year-over-year growth 2023-2028 (%)
      • Data Table on Europe - Year-over-year growth 2023-2028 (%)
    • 8.7 Middle East and Africa - Market size and forecast 2023-2028
      • Chart on Middle East and Africa - Market size and forecast 2023-2028 ($ million)
      • Data Table on Middle East and Africa - Market size and forecast 2023-2028 ($ million)
      • Chart on Middle East and Africa - Year-over-year growth 2023-2028 (%)
      • Data Table on Middle East and Africa - Year-over-year growth 2023-2028 (%)
    • 8.8 Brazil - Market size and forecast 2023-2028
      • Chart on Brazil - Market size and forecast 2023-2028 ($ million)
      • Data Table on Brazil - Market size and forecast 2023-2028 ($ million)
      • Chart on Brazil - Year-over-year growth 2023-2028 (%)
      • Data Table on Brazil - Year-over-year growth 2023-2028 (%)
    • 8.9 India - Market size and forecast 2023-2028
      • Chart on India - Market size and forecast 2023-2028 ($ million)
      • Data Table on India - Market size and forecast 2023-2028 ($ million)
      • Chart on India - Year-over-year growth 2023-2028 (%)
      • Data Table on India - Year-over-year growth 2023-2028 (%)
    • 8.10 US - Market size and forecast 2023-2028
      • Chart on US - Market size and forecast 2023-2028 ($ million)
      • Data Table on US - Market size and forecast 2023-2028 ($ million)
      • Chart on US - Year-over-year growth 2023-2028 (%)
      • Data Table on US - Year-over-year growth 2023-2028 (%)
    • 8.11 China - Market size and forecast 2023-2028
      • Chart on China - Market size and forecast 2023-2028 ($ million)
      • Data Table on China - Market size and forecast 2023-2028 ($ million)
      • Chart on China - Year-over-year growth 2023-2028 (%)
      • Data Table on China - Year-over-year growth 2023-2028 (%)
    • 8.12 France - Market size and forecast 2023-2028
      • Chart on France - Market size and forecast 2023-2028 ($ million)
      • Data Table on France - Market size and forecast 2023-2028 ($ million)
      • Chart on France - Year-over-year growth 2023-2028 (%)
      • Data Table on France - Year-over-year growth 2023-2028 (%)
    • 8.13 Market opportunity by geography
      • Market opportunity by geography ($ million)
      • Data Tables on Market opportunity by geography ($ million)

    9 Drivers, Challenges, and Opportunity/Restraints

    • 9.1 Market drivers
      • 9.2 Market challenges
        • 9.3 Impact of drivers and challenges
          • Impact of drivers and challenges in 2023 and 2028
        • 9.4 Market opportunities/restraints

          10 Competitive Landscape

          • 10.1 Overview
            • 10.2 Competitive Landscape
              • Overview on criticality of inputs and factors of differentiation
            • 10.3 Landscape disruption
              • Overview on factors of disruption
            • 10.4 Industry risks
              • Impact of key risks on business

            11 Competitive Analysis

            • 11.1 Companies profiled
              • Companies covered
            • 11.2 Market positioning of companies
              • Matrix on companies position and classification
            • 11.3 Aurora Cooperative Elevator Co.
              • Aurora Cooperative Elevator Co. - Overview
              • Aurora Cooperative Elevator Co. - Product / Service
              • Aurora Cooperative Elevator Co. - Key offerings
            • 11.4 BP Plc
              • BP Plc - Overview
              • BP Plc - Business segments
              • BP Plc - Key news
              • BP Plc - Key offerings
              • BP Plc - Segment focus
            • 11.5 Bunge Ltd.
              • Bunge Ltd. - Overview
              • Bunge Ltd. - Business segments
              • Bunge Ltd. - Key news
              • Bunge Ltd. - Key offerings
              • Bunge Ltd. - Segment focus
            • 11.6 Chevron Corp.
              • Chevron Corp. - Overview
              • Chevron Corp. - Business segments
              • Chevron Corp. - Key news
              • Chevron Corp. - Key offerings
              • Chevron Corp. - Segment focus
            • 11.7 GranBio Investimentos SA
              • GranBio Investimentos SA - Overview
              • GranBio Investimentos SA - Product / Service
              • GranBio Investimentos SA - Key offerings
            • 11.8 POET LLC
              • POET LLC - Overview
              • POET LLC - Product / Service
              • POET LLC - Key offerings
            • 11.9 Shell plc
              • Shell plc - Overview
              • Shell plc - Business segments
              • Shell plc - Key news
              • Shell plc - Key offerings
              • Shell plc - Segment focus
            • 11.10 SZVG eG
              • SZVG eG - Overview
              • SZVG eG - Product / Service
              • SZVG eG - Key offerings
            • 11.11 Wilmar International Ltd.
              • Wilmar International Ltd. - Overview
              • Wilmar International Ltd. - Business segments
              • Wilmar International Ltd. - Key news
              • Wilmar International Ltd. - Key offerings
              • Wilmar International Ltd. - Segment focus

            12 Appendix

            • 12.1 Scope of the report
              • 12.2 Inclusions and exclusions checklist
                • Inclusions checklist
                • Exclusions checklist
              • 12.3 Currency conversion rates for US$
                • Currency conversion rates for US$
              • 12.4 Research methodology
                • Research methodology
              • 12.5 Data procurement
                • Information sources
              • 12.6 Data validation
                • Data validation
              • 12.7 Validation techniques employed for market sizing
                • Validation techniques employed for market sizing
              • 12.8 Data synthesis
                • Data synthesis
              • 12.9 360 degree market analysis
                • 360 degree market analysis
              • 12.10 List of abbreviations
                • List of abbreviations

              Research Methodology

              Technavio presents a detailed picture of the market by way of study, synthesis, and summation of data from multiple sources. The analysts have presented the various facets of the market with a particular focus on identifying the key industry influencers. The data thus presented is comprehensive, reliable, and the result of extensive research, both primary and secondary.

              INFORMATION SOURCES

              Primary sources

              • Manufacturers and suppliers
              • Channel partners
              • Industry experts
              • Strategic decision makers

              Secondary sources

              • Industry journals and periodicals
              • Government data
              • Financial reports of key industry players
              • Historical data
              • Press releases

              DATA ANALYSIS

              Data Synthesis

              • Collation of data
              • Estimation of key figures
              • Analysis of derived insights

              Data Validation

              • Triangulation with data models
              • Reference against proprietary databases
              • Corroboration with industry experts

              REPORT WRITING

              Qualitative

              • Market drivers
              • Market challenges
              • Market trends
              • Five forces analysis

              Quantitative

              • Market size and forecast
              • Market segmentation
              • Geographical insights
              • Competitive landscape

              Interested in this report?

              Get your sample now to see our research methodology and insights!

              Download Now

              Frequently Asked Questions

              Biofuel From Sugar Crops market growth will increase by $ 509.1 mn during 2024-2028 .

              The Biofuel From Sugar Crops market is expected to grow at a CAGR of 3.19% during 2024-2028 .

              Biofuel From Sugar Crops market is segmented by Application( Aviation, Automotive, Power, Marine)

              Abengoa SA, ALTO INGREDIENTS Inc., Archer Daniels Midland Co., Aurora Cooperative Elevator Co., BP Plc, Bunge Ltd., Cargill Inc., Chevron Corp., Dow Inc., GranBio Investimentos SA, My Own Eco Energy Pvt. Ltd., POET LLC, Shell plc, SZVG eG, VERBIO Vereinigte BioEnergie AG, Wilmar International Ltd., Woodland Biofuels Inc. are a few of the key vendors in the Biofuel From Sugar Crops market.

              APAC will register the highest growth rate of 41% among the other regions. Therefore, the Biofuel From Sugar Crops market in APAC is expected to garner significant business opportunities for the vendors during the forecast period.

              Brazil, India, US, China, France

              • Increased adoption of renewable sources of energyAn increase in GHG emissions is of prime concern to mankind nowadays as these emissions have harmful implications and cause valuable ozone layer depletion is the driving factor this market.
              • resulting in global warming is the driving factor this market.
              • melting of ice caps is the driving factor this market.
              • and change in weather conditions. The need to reduce GHG emissions and prevent the degradation of the environment are the major driving forces for the rapid adoption of renewable sources of energy.Renewable sources of energy are now cost-competitive with fossil fuels and are now considered established sources of primary energy in various countries. As per the US Energy Information Administration is the driving factor this market.
              • in 2021 is the driving factor this market.
              • the share of renewables in the US electricity generation will increase from 21% in 2020 to 42% in 2050. Several countries in Europe is the driving factor this market.
              • including Norway is the driving factor this market.
              • Iceland is the driving factor this market.
              • and Sweden is the driving factor this market.
              • meet more than half of their total annual energy requirement through renewable sources of energy. The need to reduce GHG emissions and the increased adoption of renewables will be major driving forces for the growth of the global biofuel from sugar crops market during the forecast period. is the driving factor this market.

              The Biofuel From Sugar Crops market vendors should focus on grabbing business opportunities from the Aviation segment as it accounted for the largest market share in the base year.