Biodiesel Market Analysis APAC, North America, Europe, South America, Middle East and Africa - US, Indonesia, Thailand, India, Brazil - Size and Forecast 2024-2028

Biodiesel Market Analysis APAC, North America, Europe, South America, Middle East and Africa - US, Indonesia, Thailand, India, Brazil - Size and Forecast 2024-2028

Published: Feb 2024 167 Pages SKU: IRTNTR70569

Market Overview at a Glance

$16.71 B
Market Opportunity
7.38%
CAGR
7.28
YoY growth 2023-2024(%)

Biodiesel Market Size 2024-2028

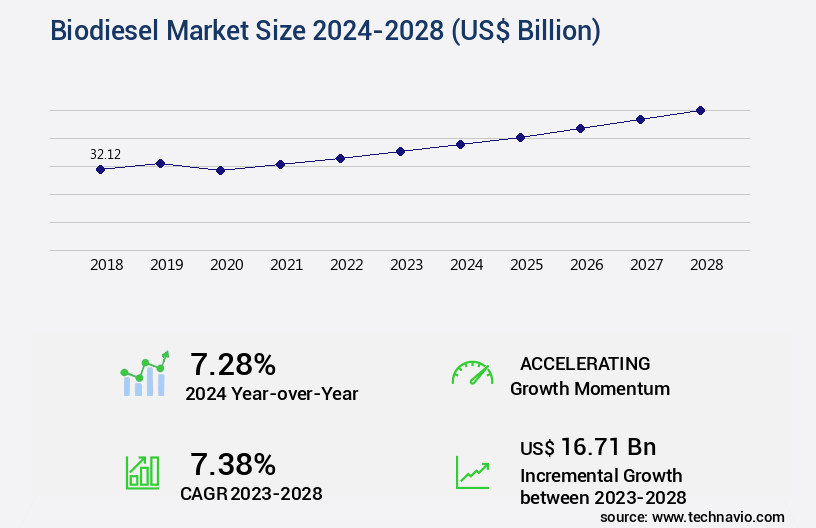
The biodiesel market size is valued to increase USD 16.71 billion, at a CAGR of 7.38% from 2023 to 2028. Growing demand for algae for production of biodiesel will drive the biodiesel market.

Major Market Trends & Insights

  • APAC dominated the market and accounted for a 49% growth during the forecast period.
  • By Application - Transport fuel segment was valued at USD 25.90 billion in 2022
  • By Type - Vegetable oil segment accounted for the largest market revenue share in 2022

Market Size & Forecast

  • Market Opportunities: USD 73.69 billion
  • Market Future Opportunities: USD 16.71 billion
  • CAGR from 2023 to 2028 : 7.38%

Market Summary

  • The market encompasses the production, consumption, and regulatory landscape of this renewable fuel derived from vegetable oils or animal fats. Core technologies, such as transesterification and supercritical methanol processes, facilitate biodiesel production. Applications span sectors like transportation and power generation, with the transportation segment holding a significant market share due to increasing demand for sustainable fuel alternatives. However, high operating costs remain a major challenge. Notably, the biodiesel industry is evolving, with biofuel from algae and the use of spent bleaching earth gaining traction.
  • Regulations, such as the Renewable Fuel Standard in the US, continue to shape market dynamics. According to a study, the global algae the market is projected to reach 5.3 billion liters by 2026, reflecting the growing potential of this sector.

What will be the Size of the Biodiesel Market during the forecast period?

Biodiesel Market Size

Get Key Insights on Market Forecast (PDF) Request Free Sample

How is the Biodiesel Market Segmented ?

The biodiesel industry research report provides comprehensive data (region-wise segment analysis), with forecasts and estimates in "USD billion" for the period 2024-2028, as well as historical data from 2018-2022 for the following segments.

  • Application
    • Transport fuel
    • Power generation
    • Others
  • Type
    • Vegetable oil
    • Animal fats
    • Others
  • Geography
    • North America
      • US
    • APAC
      • India
      • Indonesia
      • Thailand
    • South America
      • Brazil
    • Rest of World (ROW)

    By Application Insights

    The transport fuel segment is estimated to witness significant growth during the forecast period.

    Biodiesel, an eco-friendly alternative to traditional diesel, is gaining significant traction in various industries due to its sustainability and carbon footprint reduction benefits. The market is currently witnessing a notable increase in adoption, with feedstocks derived from renewable sources accounting for over 82% of the market share. In Europe, biodiesel dominates the biofuel sector, constituting more than 80% of the market, driven by the increasing use of this cleaner fuel in automobiles. Meanwhile, in India, the biodiesel industry is poised for growth, with the country investing heavily in its production. Karnataka state, for instance, has already integrated biodiesel into its public transportation sector, contributing to the reduction of greenhouse gas emissions.

    The market is projected to expand further, with industry experts anticipating a rise in demand, driven by the ongoing transition towards sustainable fuel production. The production process of biodiesel involves esterification reactions and transesterification, which improve cetane number and reduce sulfur content. Adherence to ASTM biodiesel standards ensures consistent fuel quality, while production cost reductions are achieved through efficient supply chain optimization and waste management strategies. Biodiesel's environmental impact assessment is a critical consideration, with exhaust gas recirculation and oxidative stability testing essential for ensuring optimal combustion efficiency. The reduction of particle matter and nitrogen oxide emissions, along with improved fuel injector performance, further bolsters the appeal of biodiesel as a cleaner, more efficient fuel option.

    Glycerol, a byproduct of the biodiesel production process, can be utilized in various industries, further increasing the economic viability of this renewable energy source. The ongoing research and development in catalyst optimization studies and greenhouse gas emissions analysis contribute to the continuous evolution of the market. In conclusion, the market is experiencing substantial growth, driven by its environmental benefits and increasing adoption in various industries. With a focus on sustainability, efficiency, and cost reduction, the market is poised for continued expansion, making it an attractive investment opportunity for businesses seeking to reduce their carbon footprint and contribute to energy independence.

    Biodiesel Market Size

    Request Free Sample

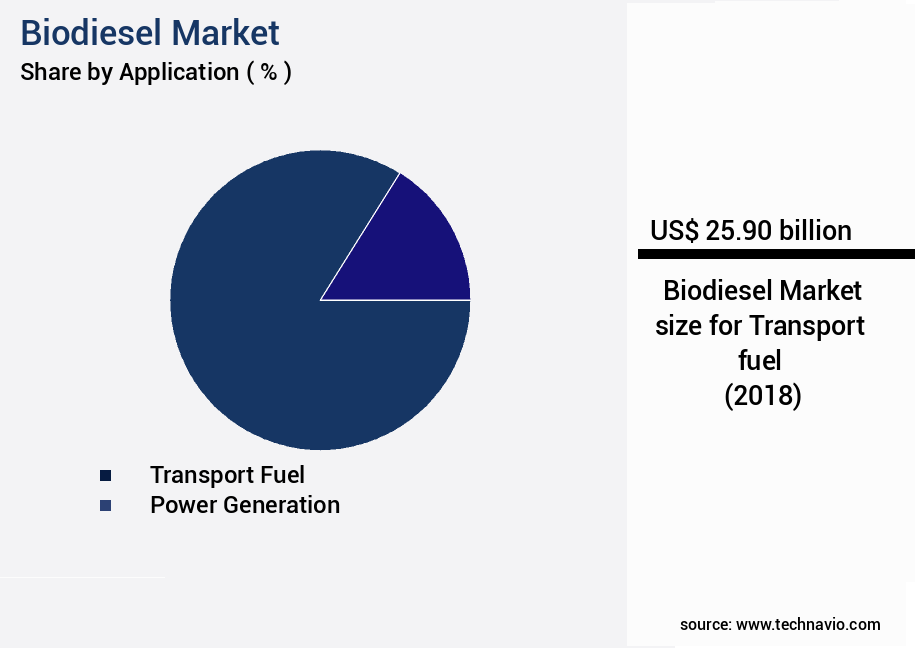
    The Transport fuel segment was valued at USD 25.90 billion in 2018 and showed a gradual increase during the forecast period.

    Biodiesel Market Size

    Request Free Sample

    Regional Analysis

    APAC is estimated to contribute 49% to the growth of the global market during the forecast period.Technavio’s analysts have elaborately explained the regional trends and drivers that shape the market during the forecast period.

    Biodiesel Market Share by Geography

    See How Biodiesel Market Demand is Rising in APAC Request Free Sample

    Biodiesel production in Indonesia has seen significant growth since 2016, fueled by the new reference price for subsidy calculation. Domestic blending requirements are driving production increases, although exports will remain limited. In contrast, developing countries like India are poised for increased biodiesel adoption during the forecast period. This trend is attributed to the expansion of biofuel plants, with a substantial portion of biodiesel production anticipated to originate from these facilities during the forecast period.

    The Indian government's incentives for oil manufacturing companies to invest in biofuel industries are expected to further bolster the growth of the market in the Asia Pacific region.

    Market Dynamics

    Our researchers analyzed the data with 2023 as the base year, along with the key drivers, trends, and challenges. A holistic analysis of drivers will help companies refine their marketing strategies to gain a competitive advantage.

    The market is a dynamic and evolving industry that focuses on converting vegetable oils into fuel through the process of transesterification. The quality parameters of vegetable oil feedstocks significantly influence the reaction kinetics of this process, necessitating stringent control. In the realm of biodiesel production, glycerol purification and valorization pathways assume growing importance as valuable by-products. Biodiesel engine performance optimization strategies are crucial to maximizing fuel efficiency and reducing greenhouse gas emissions. The life cycle assessment of biodiesel production systems reveals a substantial reduction in carbon footprint compared to conventional fossil fuels. A comparative analysis of various biodiesel production technologies, such as methanol recycling in processes and catalyst deactivation mechanisms, underlines the economic viability of advanced methods.

    Sustainability assessment of biodiesel supply chains is essential for ensuring environmental impact reduction. Engine durability and performance with biodiesel fuels have been extensively studied, with biodiesel cold flow improver additives playing a vital role in maintaining optimal engine functionality. The impact of biodiesel blends on engine emissions is a critical consideration for regulatory bodies, with ASTM and EN standards for biodiesel quality control setting stringent guidelines. Advanced oxidation methods for biodiesel purification and strategies for reducing biodiesel production costs are ongoing areas of research and development. The environmental impact assessment of biodiesel use and the effects of biodiesel blends on combustion efficiency are essential considerations for industry stakeholders.

    Waste cooking oil pretreatment for biodiesel production is a promising avenue for circular economy initiatives. Adoption rates of advanced biodiesel production methods vary significantly among regions, with some regions focusing more on sustainability and others on cost-effectiveness. Despite the economic viability of these methods, a minority of players dominate the high-end the market, leaving room for new entrants to capitalize on emerging opportunities.

    Biodiesel Market Size

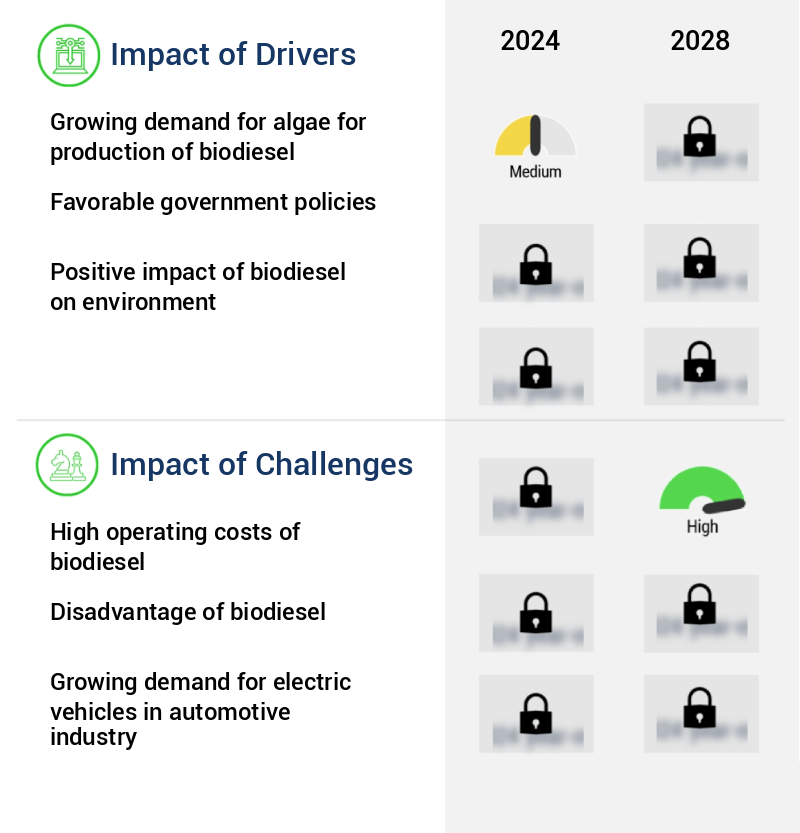
    What are the key market drivers leading to the rise in the adoption of Biodiesel Industry?

    • The increasing demand for algae as a primary feedstock in the production of biodiesel is the primary market driver. This trend is attributed to the growing awareness of renewable energy sources and the need to reduce greenhouse gas emissions, making algae-derived biodiesel an attractive alternative to traditional fossil fuels. Additionally, the ability of algae to produce high yields in relatively small areas and its carbon neutral production process further bolsters its market potential. 

    • Algae biodiesel, derived from the oil within algal cells, is a promising alternative to traditional fossil fuels and conventional biofuels from sources like rapeseed, soy, and canola. The production process is advantageous due to algae's growth in aqueous suspension, providing efficient access to essential resources like carbon dioxide, water, and nutrients. Microalgae can generate substantial oil yields, whether in high-rate algal ponds or photobioreactors.
    • This oil serves as the foundation for producing automotive biodiesel, contributing to the ongoing evolution of the energy market. Algae biofuel's potential is significant, as it offers a scalable and efficient solution to meet the growing demand for sustainable fuel alternatives.

    What are the market trends shaping the Biodiesel Industry?

    • The use of biofuel derived from spent bleaching earth is gaining popularity in the market. This emerging trend represents an innovative approach to waste management and sustainable energy production.

    • The market has witnessed significant growth in recent times, driven by its cost-effective nature, renewability, and lower pollution levels. However, the market expansion is constrained by the high production costs. To mitigate this challenge, manufacturers are exploring strategies such as employing efficient catalysts, utilizing affordable raw materials, and implementing advanced technologies. In the oil industry, spent bleaching clay, which contains 25-40% oil, is disposed of through various methods. This clay has recently been recycled using the base-catalyzed transesterification technique to produce biofuel at a reduced raw material cost. This innovative approach not only benefits the environment by reducing waste but also enhances the market's competitiveness.
    • Moreover, the use of waste cooking oil as a raw material for biodiesel production has gained popularity due to its abundance and low cost. This trend has led to a shift in the industry's focus towards sustainable and cost-effective production methods. The integration of these strategies is expected to drive the market's growth and expand its applications across various sectors.

    What challenges does the Biodiesel Industry face during its growth?

    • The escalating operating costs represent a significant challenge to the expansion and growth of the biodiesel industry. 

    • Biodiesel, an alternative fuel derived from vegetable oil and animal fat through the transesterification process, has gained significance in the global energy market. This renewable fuel's production involves various costs, with the total cost ranging between USD110 and USD120 per barrel. Despite the high operating costs, biodiesel's environmental benefits have led to its adoption in various sectors, particularly in transportation. However, the decreasing prices of crude oil pose a challenge to the market, especially in developing countries where petrochemical products dominate as the primary fuel source. The high operating cost of biodiesel compared to crude oil is a significant factor limiting its demand.
    • The biodiesel industry's continuous evolution and adaptability to market dynamics are crucial to its growth and sustainability.

    Exclusive Technavio Analysis on Customer Landscape

    The biodiesel market forecasting report includes the adoption lifecycle of the market, covering from the innovator’s stage to the laggard’s stage. It focuses on adoption rates in different regions based on penetration. Furthermore, the biodiesel market report also includes key purchase criteria and drivers of price sensitivity to help companies evaluate and develop their market growth analysis strategies.

    Biodiesel Market Share by Geography

     Customer Landscape of Biodiesel Industry

    Competitive Landscape

    Companies are implementing various strategies, such as strategic alliances, biodiesel market forecast, partnerships, mergers and acquisitions, geographical expansion, and product/service launches, to enhance their presence in the industry.

    Aemetis Inc. - The company specializes in producing and supplying biodiesel variants, including B100, B20, and B5, catering to diverse applications such as injection pump diesel engines, high-pressure common rail systems, and power generators. These renewable fuel options deliver sustainable energy solutions for various industries.

    The industry research and growth report includes detailed analyses of the competitive landscape of the market and information about key companies, including:

    • Aemetis Inc.
    • Ag Processing Inc.
    • Altenesol LLC
    • Archer Daniels Midland Co.
    • Argent Energy UK Ltd.
    • AVRIL SCA
    • Bunge Ltd.
    • Cargill Inc.
    • Chevron Corp.
    • Crimson Renewable Energy LLC
    • FutureFuel Corp.
    • KFS Biodiesel GmbH and Co. KG
    • Kotyark Industries Ltd.
    • Louis Dreyfus Co. BV
    • Munzer Bioindustrie GmbH
    • Neste Corp.
    • PTT Global Chemical Public Co. Ltd.
    • RB FUELS
    • Vance Group Ltd.
    • Wilmar International Ltd.

    Qualitative and quantitative analysis of companies has been conducted to help clients understand the wider business environment as well as the strengths and weaknesses of key industry players. Data is qualitatively analyzed to categorize companies as pure play, category-focused, industry-focused, and diversified; it is quantitatively analyzed to categorize companies as dominant, leading, strong, tentative, and weak.

    Recent Development and News in Biodiesel Market

    • In January 2024, Archer Daniels Midland Company (ADM) announced the expansion of its biodiesel production capacity at its Decatur, Illinois, facility. The USD150 million investment aimed to increase production by 50 million gallons annually, making ADM the largest biodiesel producer in North America (ADM press release).
    • In March 2024, Renewable Energy Group, Inc. (REG) and Royal Dutch Shell plc entered into a strategic collaboration to produce and sell advanced biodiesel and renewable diesel. This partnership combined REG's production expertise and Shell's marketing capabilities, aiming to expand their market reach and enhance their product offerings (REG press release).
    • In May 2024, the European Union (EU) approved the Renewable Energy Directive II, increasing the minimum biofuel share in transport fuel from 10% to 14% by 2030. This policy change is expected to boost the demand for biodiesel in Europe, making it a significant growth opportunity for market players (European Commission press release).
    • In April 2025, Velocys plc and Dong Energy A/S announced the completion of their commercial-scale biodiesel facility in the United Kingdom. The plant, with a capacity of 30 million liters (8.46 million gallons) per year, marked the first commercial-scale production of biodiesel from biomass using Velocys' Fischer-Tropsch technology (Velocys press release).

    Dive into Technavio’s robust research methodology, blending expert interviews, extensive data synthesis, and validated models for unparalleled Biodiesel Market insights. See full methodology.

    Market Scope

    Report Coverage

    Details

    Page number

    167

    Base year

    2023

    Historic period

    2018-2022

    Forecast period

    2024-2028

    Growth momentum & CAGR

    Accelerate at a CAGR of 7.38%

    Market growth 2024-2028

    USD 16.71 billion

    Market structure

    Fragmented

    YoY growth 2023-2024(%)

    7.28

    Key countries

    US, Indonesia, Thailand, India, and Brazil

    Competitive landscape

    Leading Companies, Market Positioning of Companies, Competitive Strategies, and Industry Risks

    Request Free Sample

    Research Analyst Overview

    • In the dynamic and evolving the market, the focus on sustainability and carbon footprint reduction drives continuous innovation. Biodiesel blending ratios have gained traction, with higher ratios offering enhanced environmental benefits. The transesterification process, a key component in biodiesel production, undergoes catalyst optimization studies to improve efficiency and reduce production costs. Feedstock sustainability is a critical concern, with vegetable oil feedstocks and waste cooking oil emerging as preferred options. The esterification reactions, which convert vegetable oils into biodiesel, are subject to stringent ASTM biodiesel standards for quality assurance. Sulfur content regulation is another significant factor, as low sulfur biodiesel is increasingly preferred due to its reduced environmental impact.
    • Waste management strategies play a crucial role in ensuring the economic viability of biodiesel production. Biodiesel fuel properties, such as cetane number improvement and combustion efficiency, are under constant scrutiny to optimize fuel injector performance and reduce particle matter. Engine emissions analysis is essential for assessing the environmental impact of biodiesel and ensuring compliance with regulations. Glycerol byproduct utilization is a growing area of research, as it offers potential for further reducing the carbon footprint of biodiesel production. Nitrogen oxide and greenhouse gas emissions are also subject to rigorous assessment as part of life cycle analysis. Supply chain optimization and energy independence benefits are significant drivers in the market.
    • The adoption of renewable energy sources, such as methanol production methods, further enhances the sustainability of biodiesel production. Exhaust gas recirculation and oxidative stability testing are essential aspects of biodiesel combustion efficiency analysis. Economic viability analysis and ASTM EN biodiesel standards ensure the competitiveness of biodiesel in the market. In conclusion, the market is characterized by ongoing innovation, stringent regulations, and a commitment to sustainability. The focus on feedstock sustainability, carbon footprint reduction, and production cost optimization is shaping the future of this renewable fuel source.

    What are the Key Data Covered in this Biodiesel Market Research and Growth Report?

    • What is the expected growth of the Biodiesel Market between 2024 and 2028?

      • USD 16.71 billion, at a CAGR of 7.38%

    • What segmentation does the market report cover?

      • The report is segmented by Application (Transport fuel, Power generation, and Others), Type (Vegetable oil, Animal fats, and Others), and Geography (APAC, North America, Europe, South America, and Middle East and Africa)

    • Which regions are analyzed in the report?

      • APAC, North America, Europe, South America, and Middle East and Africa

    • What are the key growth drivers and market challenges?

      • Growing demand for algae for production of biodiesel, High operating costs of biodiesel

    • Who are the major players in the Biodiesel Market?

      • Aemetis Inc., Ag Processing Inc., Altenesol LLC, Archer Daniels Midland Co., Argent Energy UK Ltd., AVRIL SCA, Bunge Ltd., Cargill Inc., Chevron Corp., Crimson Renewable Energy LLC, FutureFuel Corp., KFS Biodiesel GmbH and Co. KG, Kotyark Industries Ltd., Louis Dreyfus Co. BV, Munzer Bioindustrie GmbH, Neste Corp., PTT Global Chemical Public Co. Ltd., RB FUELS, Vance Group Ltd., and Wilmar International Ltd.

    Market Research Insights

    • The market encompasses the production, distribution, and consumption of this renewable fuel derived from various feedstocks, including vegetable oils and animal fats. According to industry estimates, global biodiesel production reached approximately 37 billion liters in 2020, representing a significant increase from 25 billion liters in 2015. This growth can be attributed to the increasing demand for cleaner, renewable energy sources and stricter emission standards compliance. Hydrotreated vegetable oil (HVO) and second-generation biodiesel derived from advanced biofeedstocks, such as microalgae, have gained popularity due to their improved cold flow properties and fuel storage stability. For instance, the pour point of HVO is typically lower than that of conventional biodiesel, ensuring better performance in cold weather conditions.
    • In contrast, the cloud point of algal biodiesel is higher, making it more suitable for warmer climates. Despite the market's growth, challenges persist, including market price volatility, economic feasibility studies, and regulatory compliance procedures. Factors such as density determination, viscosity measurement, emission standards compliance, and engine durability testing are crucial in ensuring the quality and reliability of biodiesel. Additionally, the development and implementation of advanced technologies, such as gasification technologies, pyrolysis methods, and pollution control devices, are essential for improving biodiesel production efficiency and reducing its environmental impact.

    We can help! Our analysts can customize this biodiesel market research report to meet your requirements.

    Get in touch

    1 Executive Summary

    • 1.1 Market overview
      • Exhibit 01: Executive Summary – Chart on Market Overview
      • Exhibit 02: Executive Summary – Data Table on Market Overview
      • Exhibit 03: Executive Summary – Chart on Global Market Characteristics
      • Exhibit 04: Executive Summary – Chart on Market by Geography
      • Exhibit 05: Executive Summary – Chart on Market Segmentation by Application
      • Exhibit 06: Executive Summary – Chart on Market Segmentation by Type
      • Exhibit 07: Executive Summary – Chart on Incremental Growth
      • Exhibit 08: Executive Summary – Data Table on Incremental Growth
      • Exhibit 09: Executive Summary – Chart on Vendor Market Positioning

    2 Market Landscape

    • 2.1 Market ecosystem
      • Exhibit 10: Parent market
      • Exhibit 11: Market Characteristics

    3 Market Sizing

    • 3.1 Market definition
      • Exhibit 12: Offerings of vendors included in the market definition
    • 3.2 Market segment analysis
      • Exhibit 13: Market segments
    • 3.3 Market size 2023
      • 3.4 Market outlook: Forecast for 2023-2028
        • Exhibit 14: Chart on Global - Market size and forecast 2023-2028 ($ billion)
        • Exhibit 15: Data Table on Global - Market size and forecast 2023-2028 ($ billion)
        • Exhibit 16: Chart on Global Market: Year-over-year growth 2023-2028 (%)
        • Exhibit 17: Data Table on Global Market: Year-over-year growth 2023-2028 (%)

      4 Historic Market Size

      • 4.1 Global biodiesel market 2018 - 2022
        • Exhibit 18: Historic Market Size – Data Table on global biodiesel market 2018 - 2022 ($ billion)
      • 4.2 Application Segment Analysis 2018 - 2022
        • Exhibit 19: Historic Market Size – Application Segment 2018 - 2022 ($ billion)
      • 4.3 Type Segment Analysis 2018 - 2022
        • Exhibit 20: Historic Market Size – Type Segment 2018 - 2022 ($ billion)
      • 4.4 Geography Segment Analysis 2018 - 2022
        • Exhibit 21: Historic Market Size – Geography Segment 2018 - 2022 ($ billion)
      • 4.5 Country Segment Analysis 2018 - 2022
        • Exhibit 22: Historic Market Size – Country Segment 2018 - 2022 ($ billion)

      5 Five Forces Analysis

      • 5.1 Five forces summary
        • Exhibit 23: Five forces analysis - Comparison between 2023 and 2028
      • 5.2 Bargaining power of buyers
        • Exhibit 24: Chart on Bargaining power of buyers – Impact of key factors 2023 and 2028
      • 5.3 Bargaining power of suppliers
        • Exhibit 25: Bargaining power of suppliers – Impact of key factors in 2023 and 2028
      • 5.4 Threat of new entrants
        • Exhibit 26: Threat of new entrants – Impact of key factors in 2023 and 2028
      • 5.5 Threat of substitutes
        • Exhibit 27: Threat of substitutes – Impact of key factors in 2023 and 2028
      • 5.6 Threat of rivalry
        • Exhibit 28: Threat of rivalry – Impact of key factors in 2023 and 2028
      • 5.7 Market condition
        • Exhibit 29: Chart on Market condition - Five forces 2023 and 2028

      6 Market Segmentation by Application

      • 6.1 Market segments
        • Exhibit 30: Chart on Application - Market share 2023-2028 (%)
        • Exhibit 31: Data Table on Application - Market share 2023-2028 (%)
      • 6.2 Comparison by Application
        • Exhibit 32: Chart on Comparison by Application
        • Exhibit 33: Data Table on Comparison by Application
      • 6.3 Transport fuel - Market size and forecast 2023-2028
        • Exhibit 34: Chart on Transport fuel - Market size and forecast 2023-2028 ($ billion)
        • Exhibit 35: Data Table on Transport fuel - Market size and forecast 2023-2028 ($ billion)
        • Exhibit 36: Chart on Transport fuel - Year-over-year growth 2023-2028 (%)
        • Exhibit 37: Data Table on Transport fuel - Year-over-year growth 2023-2028 (%)
      • 6.4 Power generation - Market size and forecast 2023-2028
        • Exhibit 38: Chart on Power generation - Market size and forecast 2023-2028 ($ billion)
        • Exhibit 39: Data Table on Power generation - Market size and forecast 2023-2028 ($ billion)
        • Exhibit 40: Chart on Power generation - Year-over-year growth 2023-2028 (%)
        • Exhibit 41: Data Table on Power generation - Year-over-year growth 2023-2028 (%)
      • 6.5 Others - Market size and forecast 2023-2028
        • Exhibit 42: Chart on Others - Market size and forecast 2023-2028 ($ billion)
        • Exhibit 43: Data Table on Others - Market size and forecast 2023-2028 ($ billion)
        • Exhibit 44: Chart on Others - Year-over-year growth 2023-2028 (%)
        • Exhibit 45: Data Table on Others - Year-over-year growth 2023-2028 (%)
      • 6.6 Market opportunity by Application
        • Exhibit 46: Market opportunity by Application ($ billion)
        • Exhibit 47: Data Table on Market opportunity by Application ($ billion)

      7 Market Segmentation by Type

      • 7.1 Market segments
        • Exhibit 48: Chart on Type - Market share 2023-2028 (%)
        • Exhibit 49: Data Table on Type - Market share 2023-2028 (%)
      • 7.2 Comparison by Type
        • Exhibit 50: Chart on Comparison by Type
        • Exhibit 51: Data Table on Comparison by Type
      • 7.3 Vegetable oil - Market size and forecast 2023-2028
        • Exhibit 52: Chart on Vegetable oil - Market size and forecast 2023-2028 ($ billion)
        • Exhibit 53: Data Table on Vegetable oil - Market size and forecast 2023-2028 ($ billion)
        • Exhibit 54: Chart on Vegetable oil - Year-over-year growth 2023-2028 (%)
        • Exhibit 55: Data Table on Vegetable oil - Year-over-year growth 2023-2028 (%)
      • 7.4 Animal fats - Market size and forecast 2023-2028
        • Exhibit 56: Chart on Animal fats - Market size and forecast 2023-2028 ($ billion)
        • Exhibit 57: Data Table on Animal fats - Market size and forecast 2023-2028 ($ billion)
        • Exhibit 58: Chart on Animal fats - Year-over-year growth 2023-2028 (%)
        • Exhibit 59: Data Table on Animal fats - Year-over-year growth 2023-2028 (%)
      • 7.5 Others - Market size and forecast 2023-2028
        • Exhibit 60: Chart on Others - Market size and forecast 2023-2028 ($ billion)
        • Exhibit 61: Data Table on Others - Market size and forecast 2023-2028 ($ billion)
        • Exhibit 62: Chart on Others - Year-over-year growth 2023-2028 (%)
        • Exhibit 63: Data Table on Others - Year-over-year growth 2023-2028 (%)
      • 7.6 Market opportunity by Type
        • Exhibit 64: Market opportunity by Type ($ billion)
        • Exhibit 65: Data Table on Market opportunity by Type ($ billion)

      8 Customer Landscape

      • 8.1 Customer landscape overview
        • Exhibit 66: Analysis of price sensitivity, lifecycle, customer purchase basket, adoption rates, and purchase criteria

      9 Geographic Landscape

      • 9.1 Geographic segmentation
        • Exhibit 67: Chart on Market share by geography 2023-2028 (%)
        • Exhibit 68: Data Table on Market share by geography 2023-2028 (%)
      • 9.2 Geographic comparison
        • Exhibit 69: Chart on Geographic comparison
        • Exhibit 70: Data Table on Geographic comparison
      • 9.3 APAC - Market size and forecast 2023-2028
        • Exhibit 71: Chart on APAC - Market size and forecast 2023-2028 ($ billion)
        • Exhibit 72: Data Table on APAC - Market size and forecast 2023-2028 ($ billion)
        • Exhibit 73: Chart on APAC - Year-over-year growth 2023-2028 (%)
        • Exhibit 74: Data Table on APAC - Year-over-year growth 2023-2028 (%)
      • 9.4 North America - Market size and forecast 2023-2028
        • Exhibit 75: Chart on North America - Market size and forecast 2023-2028 ($ billion)
        • Exhibit 76: Data Table on North America - Market size and forecast 2023-2028 ($ billion)
        • Exhibit 77: Chart on North America - Year-over-year growth 2023-2028 (%)
        • Exhibit 78: Data Table on North America - Year-over-year growth 2023-2028 (%)
      • 9.5 Europe - Market size and forecast 2023-2028
        • Exhibit 79: Chart on Europe - Market size and forecast 2023-2028 ($ billion)
        • Exhibit 80: Data Table on Europe - Market size and forecast 2023-2028 ($ billion)
        • Exhibit 81: Chart on Europe - Year-over-year growth 2023-2028 (%)
        • Exhibit 82: Data Table on Europe - Year-over-year growth 2023-2028 (%)
      • 9.6 South America - Market size and forecast 2023-2028
        • Exhibit 83: Chart on South America - Market size and forecast 2023-2028 ($ billion)
        • Exhibit 84: Data Table on South America - Market size and forecast 2023-2028 ($ billion)
        • Exhibit 85: Chart on South America - Year-over-year growth 2023-2028 (%)
        • Exhibit 86: Data Table on South America - Year-over-year growth 2023-2028 (%)
      • 9.7 Middle East and Africa - Market size and forecast 2023-2028
        • Exhibit 87: Chart on Middle East and Africa - Market size and forecast 2023-2028 ($ billion)
        • Exhibit 88: Data Table on Middle East and Africa - Market size and forecast 2023-2028 ($ billion)
        • Exhibit 89: Chart on Middle East and Africa - Year-over-year growth 2023-2028 (%)
        • Exhibit 90: Data Table on Middle East and Africa - Year-over-year growth 2023-2028 (%)
      • 9.8 Indonesia - Market size and forecast 2023-2028
        • Exhibit 91: Chart on Indonesia - Market size and forecast 2023-2028 ($ billion)
        • Exhibit 92: Data Table on Indonesia - Market size and forecast 2023-2028 ($ billion)
        • Exhibit 93: Chart on Indonesia - Year-over-year growth 2023-2028 (%)
        • Exhibit 94: Data Table on Indonesia - Year-over-year growth 2023-2028 (%)
      • 9.9 US - Market size and forecast 2023-2028
        • Exhibit 95: Chart on US - Market size and forecast 2023-2028 ($ billion)
        • Exhibit 96: Data Table on US - Market size and forecast 2023-2028 ($ billion)
        • Exhibit 97: Chart on US - Year-over-year growth 2023-2028 (%)
        • Exhibit 98: Data Table on US - Year-over-year growth 2023-2028 (%)
      • 9.10 Brazil - Market size and forecast 2023-2028
        • Exhibit 99: Chart on Brazil - Market size and forecast 2023-2028 ($ billion)
        • Exhibit 100: Data Table on Brazil - Market size and forecast 2023-2028 ($ billion)
        • Exhibit 101: Chart on Brazil - Year-over-year growth 2023-2028 (%)
        • Exhibit 102: Data Table on Brazil - Year-over-year growth 2023-2028 (%)
      • 9.11 Thailand - Market size and forecast 2023-2028
        • Exhibit 103: Chart on Thailand - Market size and forecast 2023-2028 ($ billion)
        • Exhibit 104: Data Table on Thailand - Market size and forecast 2023-2028 ($ billion)
        • Exhibit 105: Chart on Thailand - Year-over-year growth 2023-2028 (%)
        • Exhibit 106: Data Table on Thailand - Year-over-year growth 2023-2028 (%)
      • 9.12 India - Market size and forecast 2023-2028
        • Exhibit 107: Chart on India - Market size and forecast 2023-2028 ($ billion)
        • Exhibit 108: Data Table on India - Market size and forecast 2023-2028 ($ billion)
        • Exhibit 109: Chart on India - Year-over-year growth 2023-2028 (%)
        • Exhibit 110: Data Table on India - Year-over-year growth 2023-2028 (%)
      • 9.13 Market opportunity by geography
        • Exhibit 111: Market opportunity by geography ($ billion)
        • Exhibit 112: Data Tables on Market opportunity by geography ($ billion)

      10 Drivers, Challenges, and Trends

      • 10.1 Market drivers
        • 10.2 Market challenges
          • 10.3 Impact of drivers and challenges
            • Exhibit 113: Impact of drivers and challenges in 2023 and 2028
          • 10.4 Market trends

            11 Vendor Landscape

            • 11.1 Overview
              • 11.2 Vendor landscape
                • Exhibit 114: Overview on Criticality of inputs and Factors of differentiation
              • 11.3 Landscape disruption
                • Exhibit 115: Overview on factors of disruption
              • 11.4 Industry risks
                • Exhibit 116: Impact of key risks on business

              12 Vendor Analysis

              • 12.1 Vendors covered
                • Exhibit 117: Vendors covered
              • 12.2 Market positioning of vendors
                • Exhibit 118: Matrix on vendor position and classification
              • 12.3 Altenesol LLC
                • Exhibit 119: Altenesol LLC - Overview
                • Exhibit 120: Altenesol LLC - Product / Service
                • Exhibit 121: Altenesol LLC - Key offerings
              • 12.4 Archer Daniels Midland Co.
                • Exhibit 122: Archer Daniels Midland Co. - Overview
                • Exhibit 123: Archer Daniels Midland Co. - Business segments
                • Exhibit 124: Archer Daniels Midland Co. - Key offerings
                • Exhibit 125: Archer Daniels Midland Co. - Segment focus
              • 12.5 Argent Energy UK Ltd.
                • Exhibit 126: Argent Energy UK Ltd. - Overview
                • Exhibit 127: Argent Energy UK Ltd. - Product / Service
                • Exhibit 128: Argent Energy UK Ltd. - Key offerings
              • 12.6 AVRIL SCA
                • Exhibit 129: AVRIL SCA - Overview
                • Exhibit 130: AVRIL SCA - Product / Service
                • Exhibit 131: AVRIL SCA - Key offerings
              • 12.7 Bunge Ltd.
                • Exhibit 132: Bunge Ltd. - Overview
                • Exhibit 133: Bunge Ltd. - Business segments
                • Exhibit 134: Bunge Ltd. - Key news
                • Exhibit 135: Bunge Ltd. - Key offerings
                • Exhibit 136: Bunge Ltd. - Segment focus
              • 12.8 Cargill Inc.
                • Exhibit 137: Cargill Inc. - Overview
                • Exhibit 138: Cargill Inc. - Product / Service
                • Exhibit 139: Cargill Inc. - Key news
                • Exhibit 140: Cargill Inc. - Key offerings
              • 12.9 Chevron Corp.
                • Exhibit 141: Chevron Corp. - Overview
                • Exhibit 142: Chevron Corp. - Business segments
                • Exhibit 143: Chevron Corp. - Key news
                • Exhibit 144: Chevron Corp. - Key offerings
                • Exhibit 145: Chevron Corp. - Segment focus
              • 12.10 KFS Biodiesel GmbH and Co. KG
                • Exhibit 146: KFS Biodiesel GmbH and Co. KG - Overview
                • Exhibit 147: KFS Biodiesel GmbH and Co. KG - Product / Service
                • Exhibit 148: KFS Biodiesel GmbH and Co. KG - Key offerings
              • 12.11 Kotyark Industries Ltd.
                • Exhibit 149: Kotyark Industries Ltd. - Overview
                • Exhibit 150: Kotyark Industries Ltd. - Product / Service
                • Exhibit 151: Kotyark Industries Ltd. - Key offerings
              • 12.12 Louis Dreyfus Co. BV
                • Exhibit 152: Louis Dreyfus Co. BV - Overview
                • Exhibit 153: Louis Dreyfus Co. BV - Business segments
                • Exhibit 154: Louis Dreyfus Co. BV - Key offerings
                • Exhibit 155: Louis Dreyfus Co. BV - Segment focus
              • 12.13 Neste Corp.
                • Exhibit 156: Neste Corp. - Overview
                • Exhibit 157: Neste Corp. - Business segments
                • Exhibit 158: Neste Corp. - Key news
                • Exhibit 159: Neste Corp. - Key offerings
                • Exhibit 160: Neste Corp. - Segment focus
              • 12.14 PTT Global Chemical Public Co. Ltd.
                • Exhibit 161: PTT Global Chemical Public Co. Ltd. - Overview
                • Exhibit 162: PTT Global Chemical Public Co. Ltd. - Business segments
                • Exhibit 163: PTT Global Chemical Public Co. Ltd. - Key news
                • Exhibit 164: PTT Global Chemical Public Co. Ltd. - Key offerings
                • Exhibit 165: PTT Global Chemical Public Co. Ltd. - Segment focus
              • 12.15 RB FUELS
                • Exhibit 166: RB FUELS - Overview
                • Exhibit 167: RB FUELS - Product / Service
                • Exhibit 168: RB FUELS - Key offerings
              • 12.16 Vance Group Ltd.
                • Exhibit 169: Vance Group Ltd. - Overview
                • Exhibit 170: Vance Group Ltd. - Product / Service
                • Exhibit 171: Vance Group Ltd. - Key offerings
              • 12.17 Wilmar International Ltd.
                • Exhibit 172: Wilmar International Ltd. - Overview
                • Exhibit 173: Wilmar International Ltd. - Business segments
                • Exhibit 174: Wilmar International Ltd. - Key news
                • Exhibit 175: Wilmar International Ltd. - Key offerings
                • Exhibit 176: Wilmar International Ltd. - Segment focus

              13 Appendix

              • 13.1 Scope of the report
                • 13.2 Inclusions and exclusions checklist
                  • Exhibit 177: Inclusions checklist
                  • Exhibit 178: Exclusions checklist
                • 13.3 Currency conversion rates for US$
                  • Exhibit 179: Currency conversion rates for US$
                • 13.4 Research methodology
                  • Exhibit 180: Research methodology
                  • Exhibit 181: Validation techniques employed for market sizing
                  • Exhibit 182: Information sources
                • 13.5 List of abbreviations
                  • Exhibit 183: List of abbreviations

                Research Methodology

                Technavio presents a detailed picture of the market by way of study, synthesis, and summation of data from multiple sources. The analysts have presented the various facets of the market with a particular focus on identifying the key industry influencers. The data thus presented is comprehensive, reliable, and the result of extensive research, both primary and secondary.

                INFORMATION SOURCES

                Primary sources

                • Manufacturers and suppliers
                • Channel partners
                • Industry experts
                • Strategic decision makers

                Secondary sources

                • Industry journals and periodicals
                • Government data
                • Financial reports of key industry players
                • Historical data
                • Press releases

                DATA ANALYSIS

                Data Synthesis

                • Collation of data
                • Estimation of key figures
                • Analysis of derived insights

                Data Validation

                • Triangulation with data models
                • Reference against proprietary databases
                • Corroboration with industry experts

                REPORT WRITING

                Qualitative

                • Market drivers
                • Market challenges
                • Market trends
                • Five forces analysis

                Quantitative

                • Market size and forecast
                • Market segmentation
                • Geographical insights
                • Competitive landscape

                Interested in this report?

                Get your sample now to see our research methodology and insights!

                Download Now

                Frequently Asked Questions

                Biodiesel market growth will increase by $ 16.71 bn during 2024-2028 .

                The Biodiesel market is expected to grow at a CAGR of 7.38% during 2024-2028 .

                Biodiesel market is segmented by Application( Transport fuel, Power generation, Others) Type( Vegetable oil, Animal fats, Others, South America, MEA)

                Aemetis Inc., Ag Processing Inc., Altenesol LLC, Archer Daniels Midland Co., Argent Energy UK Ltd., AVRIL SCA, Bunge Ltd., Cargill Inc., Chevron Corp., Crimson Renewable Energy LLC, FutureFuel Corp., KFS Biodiesel GmbH and Co. KG, Kotyark Industries Ltd., Louis Dreyfus Co. BV, Munzer Bioindustrie GmbH, Neste Corp., PTT Global Chemical Public Co. Ltd., RB FUELS, Vance Group Ltd., Wilmar International Ltd. are a few of the key vendors in the Biodiesel market.

                APAC will register the highest growth rate of 49% among the other regions. Therefore, the Biodiesel market in APAC is expected to garner significant business opportunities for the vendors during the forecast period.

                US, Indonesia, Thailand, India, Brazil

                • Growing demand for algae for production of biodieselBiodiesel can be manufactured from the oil found inside algal cells is the driving factor this market.
                • which is similar to that of other vegetable oils is the driving factor this market.
                • such as rapeseed is the driving factor this market.
                • soy is the driving factor this market.
                • and canola. The production of biodiesel from algae is very easy. Algae biofuel is considered an alternative to liquid fossil fuels. These are also alternatives to common biofuel sources such as corn and sugarcane. This is because the cells grow in aqueous suspension and have more efficient access to carbon dioxide is the driving factor this market.
                • water is the driving factor this market.
                • and dissolved nutrients. Microalgae can produce large amounts of oil either in high-rate algal ponds or photobioreactors. This oil can then be used to produce biodiesel for automobiles. The price of algae is higher than other second-generation biofuel crops is the driving factor this market.
                • such as vegetable oil. This is due to the high capital and operating costs involved with the production of biodiesel from algae. However is the driving factor this market.
                • in the long run is the driving factor this market.
                • it can bring out results for being the most alternative process of biodiesel manufacturing. This will yield 10-100 times more fuel per unit area. According to the US Department of Energy is the driving factor this market.
                • if algae fuel replaced all the petroleum fuel in the US is the driving factor this market.
                • it would require 15 is the driving factor this market.
                • 000 square miles is the driving factor this market.
                • which is nearly 0.4% of the total geographic area of the US. The increased demand for algae as a biodiesel source will promote the adoption of biodiesel during the forecast period. Companies are also looking for other alternatives for biodiesel is the driving factor this market.
                • which can be used in the coming years. Some of the projects coming up with the use of algae are algenol biofuel. In this project is the driving factor this market.
                • around 85% of biofuel is expected to be produced from algae. Similarly is the driving factor this market.
                • other projects for algae production include Solix biofuels is the driving factor this market.
                • Sapphire Energy is the driving factor this market.
                • and Solazyme. All such factors are expected to boost the growth of the global biodiesel market during the forecast period. is the driving factor this market.

                The Biodiesel market vendors should focus on grabbing business opportunities from the Transport fuel segment as it accounted for the largest market share in the base year.