Biogas Upgrading Equipment Market Analysis Europe, North America, APAC, South America, Middle East and Africa - US, Germany, China, UK, Italy - Size and Forecast 2024-2028

Biogas Upgrading Equipment Market Analysis Europe, North America, APAC, South America, Middle East and Africa - US, Germany, China, UK, Italy - Size and Forecast 2024-2028

Published: Jul 2024 161 Pages SKU: IRTNTR70694

Market Overview at a Glance

$7.43 B
Market Opportunity
18.52%
CAGR
15.18
YoY growth 2023-2024(%)

Biogas Upgrading Equipment Market Size 2024-2028

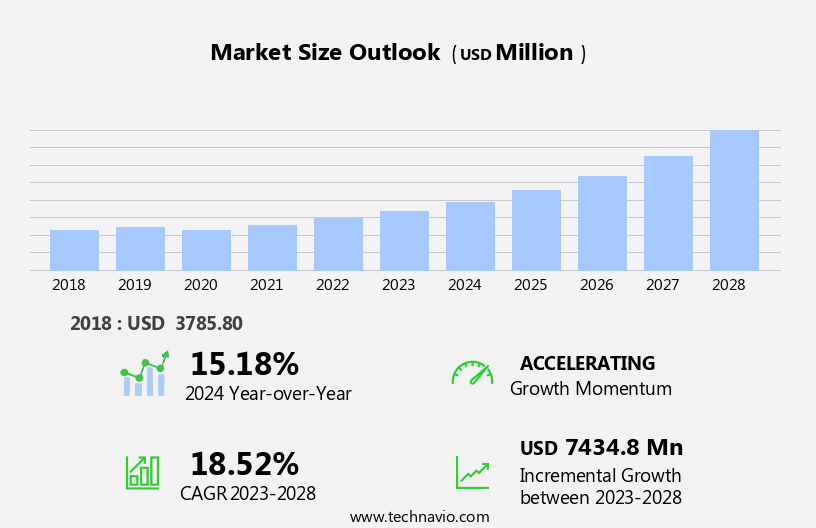
The biogas upgrading equipment market size is forecast to increase by USD 7.43 billion at a CAGR of 18.52% between 2023 and 2028.

  • The market is experiencing significant growth driven by the increasing demand for cleaner fuel alternatives. Biogas, derived from organic waste, is an attractive renewable energy source that reduces greenhouse gas emissions and offers energy security. Technological advancements in biogas upgrading equipment have improved efficiency and reduced production costs, making biogas a competitive alternative to traditional fossil fuels. However, the high cost of production remains a significant challenge for market growth. Producers must continually innovate to reduce production costs and increase efficiency to remain competitive.
  • Additionally, government incentives and regulations supporting renewable energy and biogas production will continue to drive market expansion. Companies seeking to capitalize on this market opportunity should focus on technological innovation, cost reduction strategies, and regulatory compliance to effectively navigate challenges and capitalize on growth potential.

What will be the Size of the Biogas Upgrading Equipment Market during the forecast period?

Biogas Upgrading Equipment Market Size

 Request Free Sample

  • The market represents a significant opportunity for businesses seeking to capitalize on the growing demand for renewable energy sources and reduce greenhouse gas emissions. Biogas, derived from organic substrates such as industrial waste, energy crops, household waste, manure, sewage sludge, and organic fractions, is an increasingly popular alternative to traditional fossil fuels like crude oil and natural gas. Biogas upgrading equipment is essential for converting raw biogas into high-quality biomethane or compressed natural gas (CNG) for use in power generation, transportation, and industrial applications. This process involves removing impurities like carbon dioxide and water through various filter products and techniques, such as water washing and pressure swing adsorption.
  • Key growth factors include the increasing focus on carbon reduction procedures in various industries, including power generation, maritime, and manufacturing, as well as the rising demand for cleaner fuel alternatives in the transportation sector. Additionally, the potential to convert industrial waste into a valuable energy source and the growing use of biogas as a feedstock for producing biodiesel and other bioenergy products contribute to the market's expansion.

How is this Biogas Upgrading Equipment Industry segmented?

The biogas upgrading equipment industry research report provides comprehensive data (region-wise segment analysis), with forecasts and estimates in "USD million" for the period 2024-2028, as well as historical data from 2018-2022 for the following segments.
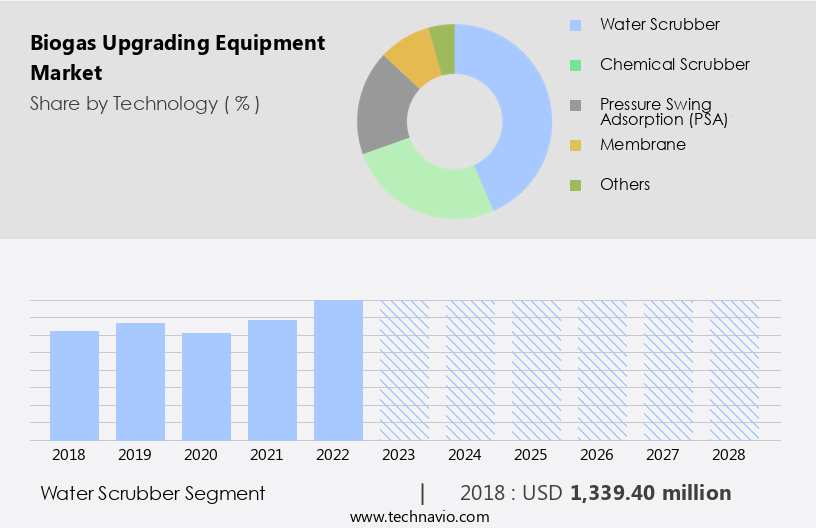
  • Technology
    • Water scrubber
    • Chemical scrubber
    • Pressure swing adsorption (PSA)
    • Membrane
    • Others
  • Geography
    • Europe
      • Germany
      • Italy
      • UK
    • North America
      • US
    • APAC
      • China
    • South America
      • Middle East and Africa

      By Technology Insights

      The water scrubber segment is estimated to witness significant growth during the forecast period.

      Biogas upgrading technology plays a significant role in transforming bioenergy into a more valuable and sustainable fuel source for various industries, including Compressed Natural Gas (CNG) and transportation. Water scrubbing is the most common upgrading method, which involves using water as a solvent to remove carbon dioxide (CO2) from biogas, resulting in high-quality biomethane. This process increases the methane content of the gas, making it around 98% pure, while also eliminating hydrogen sulfide. Water scrubbing is preferred due to its simplicity, commercial availability, and consistent performance at various flow rates. The process has a low carbon slip of less than 2%, leading to reduced operating costs.

      Biogas upgrading is essential for converting organic substrates, such as sewage sludge, industrial waste, agricultural wastes, and manure, into clean energy sources. By replacing conventional fuel sources like crude oil and natural gas, biogas upgrading contributes to carbon reduction procedures, methane enhancement, and the reduction of greenhouse gas emissions. The market is driven by the increasing demand for renewable energy sources, such as biomethane, in various industries. This includes the power generation industry, transportation sector, and agriculture sector. The use of biomethane as a natural gas replacement in CNG cars and as a vehicle fuel reduces dependence on fossil fuels and contributes to the reduction of methane emissions and ecosystem deterioration.

      Cryogenic refinement, membrane separation, and pressure swing adsorption are other upgrading techniques used to enhance the quality of biogas. These methods ensure the production of high-purity biomethane, which can be used as a fuel or feedstock for various applications, including electricity generation, industrial processes, and household use. In summary, biogas upgrading technology is a vital component of the transition towards a more sustainable energy future. The increasing demand for clean energy sources, coupled with the need to reduce greenhouse gas emissions, is driving the growth of the market. Water scrubbing is the most commonly used upgrading method due to its simplicity, consistency, and low operating costs.

      Other upgrading techniques, such as cryogenic refinement and membrane separation, ensure the production of high-purity biomethane for various applications.

      Biogas Upgrading Equipment Market Size

      Get a glance at the market report of share of various segments Request Free Sample

      The Water scrubber segment was valued at USD 1.34 billion in 2018 and showed a gradual increase during the forecast period.

      Regional Analysis

      Europe is estimated to contribute 39% to the growth of the global market during the forecast period.Technavio’s analysts have elaborately explained the regional trends and drivers that shape the market during the forecast period.

      Biogas Upgrading Equipment Market Share by Geography

      For more insights on the market size of various regions, Request Free Sample

      Bioenergy derived from renewable sources is poised to contribute significantly to the European Union's (EU) goal of accounting for 20% of the total final energy consumption. Biomethane, a form of bioenergy, is increasingly gaining popularity in Europe due to the ambitious targets set by various countries. For instance, Sweden aims to replace all fossil fuels in transportation with biomethane by 2030, while Denmark plans to produce 2,0 PJ of biomethane by the same year. The Netherlands set a target of 670 million m3 of biomethane consumption in 2020, and Germany intended to replace 6% of its national gas consumption and 10% by 2030.

      Germany's heavy dependence on oil and gas imports, given its low reserves, underscores the importance of biomethane as a natural gas replacement. Biogas upgrading technology, including chemical scrubbers and cryogenic refinement, plays a vital role in enhancing the purity of biomethane from raw biogas. Sewage sludge, industrial waste, agriculture wastes, and manure are common organic substrates used in the anaerobic digestion process to produce biogas. The water washing technique and pressure swing adsorption are other methods used in biogas upgradation. Biomethane is a clean energy source that reduces greenhouse gas emissions, including methane and carbon dioxide, making it an attractive alternative to conventional fuel sources.

      The transportation industry, including CNG cars, can benefit significantly from biomethane as a vehicle fuel. The power generation industry and electricity generation from biomethane are other applications. The market is expected to grow as the demand for biomethane as a renewable energy source increases.

      Market Dynamics

      Our researchers analyzed the data with 2023 as the base year, along with the key drivers, trends, and challenges. A holistic analysis of drivers will help companies refine their marketing strategies to gain a competitive advantage.

      What are the key market drivers leading to the rise in the adoption of Biogas Upgrading Equipment Industry?

      • Need for cleaner fuel is the key driver of the market. 

      • Biogas, derived from biodegradable substances and waste products, is a renewable fuel gaining significance in the global energy landscape due to increasing environmental concerns and the need for cleaner, alternative fuels. The quality of biogas is determined by its methane content, which affects its cleanliness and efficiency for various applications. However, the biogas available in its raw form often contains low methane concentrations, necessitating upgrading processes. The in greenhouse gas (GHG) emissions and the imperative to diversify energy sources have fueled the demand for efficient and cleaner alternative fuels, such as biogas, biodiesel, and ethanol. Research and development initiatives worldwide aim to enhance the methane content of biogas through advanced upgrading technologies, thereby improving its overall efficiency and applicability.
      • The market is poised for growth due to the increasing focus on renewable energy sources and the need for cleaner fuels. The market dynamics are driven by various factors, including stringent environmental regulations, growing awareness of the environmental impact of fossil fuels, and advancements in biogas upgrading technologies. The market is expected to witness significant growth in the coming years as more countries adopt renewable energy policies and invest in biogas infrastructure.

      What are the market trends shaping the Biogas Upgrading Equipment Industry?

      • Technological advancements is the upcoming market trend. 

      • The market is witnessing significant growth due to increasing government support and growing demand for upgraded biogas as a sustainable energy source. Technological advancements have been a key driver in this market, leading to the development of new methods such as cryogenic upgrading, in-situ methane enrichment, and the ecological lung process. These techniques aim to enhance the energy intensity of upgraded biogas to nearly 100%, while minimizing methane slip.
      • Recent innovations enable companies to generate gaus fuels through the digestion of dry feedstocks using hydrolyzers or specialized BIOFerm fermentation processes. Overall, the market is expected to continue expanding as the world seeks sustainable energy solutions.

      What challenges does the Biogas Upgrading Equipment Industry face during its growth?

      • High cost of production is a key challenge affecting the industry growth. 

      • Biogas upgrading is an essential process to convert raw biogas into high-quality upgraded biogas, which matches the quality of natural gas. Biogas naturally contains 30-40% carbon dioxide, while natural air contains only 1% carbon dioxide. To meet the standard, the carbon dioxide content in biogas must be reduced, and methane content increased. This process is energy-intensive and requires optimization to minimize costs and methane emissions. Methane, a major component of biogas, has a greenhouse gas effect 23 times greater than carbon dioxide.
      • Therefore, efficient upgrading is crucial to minimize methane emissions and contribute to reducing overall greenhouse gas emissions. The optimization of biogas upgrading involves enhancing methane production efficiency and reducing energy consumption. This approach ensures a cost-effective and environmentally sustainable biogas upgrading process.

      Exclusive Customer Landscape

      The biogas upgrading equipment market forecasting report includes the adoption lifecycle of the market, covering from the innovator’s stage to the laggard’s stage. It focuses on adoption rates in different regions based on penetration. Furthermore, the biogas upgrading equipment market report also includes key purchase criteria and drivers of price sensitivity to help companies evaluate and develop their market growth analysis strategies.

      Biogas Upgrading Equipment Market Share by Geography

       Customer Landscape

      Key Companies & Market Insights

      Companies are implementing various strategies, such as strategic alliances, biogas upgrading equipment market forecast, partnerships, mergers and acquisitions, geographical expansion, and product/service launches, to enhance their presence in the industry.

      2G Energy AG - The company specializes in biogas upgrading technology, providing advanced solutions through equipment like Agenitor and Avus. These systems enhance biogas to natural gas standards, increasing its market value and applicability in various industries. By removing impurities and raising methane content, the upgraded biogas becomes a sustainable alternative to fossil fuels, contributing significantly to the global shift towards renewable energy sources.

      The industry research and growth report includes detailed analyses of the competitive landscape of the market and information about key companies, including:

      • 2G Energy AG
      • AAT Abwasser und Abfalltechnik GmbH
      • Air Liquide SA
      • Atlas Copco AB
      • Bright Renewables B.V.
      • Carbotech Gas Systems GmbH
      • Condorchem Envitech SL
      • DMT International
      • DP CleanTech Co. Ltd.
      • DVO Inc.
      • Greenlane Renewables Inc.
      • HAASE Umwelttechnik GmbH
      • Jog Waste to Energy Pvt. Ltd.
      • MalmbergGruppen AB
      • Nacelle Logistics LLC
      • NeoZeo AB
      • Pentair Plc
      • Veolia Environnement SA
      • Xebec Adsorption Inc.

      Qualitative and quantitative analysis of companies has been conducted to help clients understand the wider business environment as well as the strengths and weaknesses of key industry players. Data is qualitatively analyzed to categorize companies as pure play, category-focused, industry-focused, and diversified; it is quantitatively analyzed to categorize companies as dominant, leading, strong, tentative, and weak.

      Research Analyst Overview

      Biogas upgrading technology refers to the processes used to convert raw biogas into a higher-value form, such as biomethane or renewable natural gas (RNG). This upgraded biogas can then be used as a clean energy source for various applications, including transportation fuel and electricity generation. Biogas is produced through the anaerobic digestion of organic substrates, such as sewage sludge, industrial waste, agricultural wastes, and food waste. During this process, methane is released as a byproduct. However, the methane content in raw biogas is typically below the threshold required for use as a vehicle fuel or for injection into the natural gas grid.

      Biogas upgrading technology is therefore essential to increase the methane content and remove impurities, such as carbon dioxide and other contaminants. The biogas upgrading market is driven by the growing demand for clean energy sources and the need to reduce greenhouse gas emissions. Biomethane and RNG are considered renewable energy sources that can help replace conventional fuel sources, such as crude oil and natural gas. The transportation industry is a significant consumer of biomethane and RNG, as it can be used as a fuel for compressed natural gas (CNG) vehicles. The biogas upgrading process typically involves several steps, including methane enhancement, carbon reduction procedure, and cryogenic refinement.

      Methane enhancement involves increasing the methane content in the biogas stream through techniques such as pressure swing adsorption or membrane separation. Carbon reduction procedure involves removing carbon dioxide from the biogas stream to increase the methane content further. Cryogenic refinement is a process that uses low temperatures to separate methane from other gases in the biogas stream. Biogas upgrading equipment is essential for the successful implementation of biogas upgrading projects. The equipment used depends on the specific requirements of the project and the desired product. For example, water washing technique is used to remove impurities from the biogas stream, while chemical scrubbers are used to remove carbon dioxide.

      The biogas upgrading market is still in its nascent stage, but it is expected to grow significantly in the coming years due to the increasing demand for clean energy sources and the need to reduce greenhouse gas emissions. The market is also driven by the availability of organic substrates, such as agricultural wastes and industrial wastewater, which can be used as feedstocks for biogas production. The use of biogas upgrading technology can help reduce methane emissions from landfills and agriculture wastes, which contribute significantly to greenhouse gas emissions. Biogas upgrading can also help reduce the reliance on fossil fuels and the associated environmental impacts.

      Additionally, the use of biomethane and RNG as vehicle fuels can help reduce the carbon footprint of the transportation sector. In , biogas upgrading technology plays a crucial role in the production of clean energy sources from organic substrates. The market for biogas upgrading equipment is expected to grow significantly in the coming years due to the increasing demand for renewable energy sources and the need to reduce greenhouse gas emissions. The use of biogas upgrading technology can help reduce methane emissions, reduce the reliance on fossil fuels, and contribute to the clean energy transition.

      Market Scope

      Report Coverage

      Details

      Page number

      161

      Base year

      2023

      Historic period

      2018-2022

      Forecast period

      2024-2028

      Growth momentum & CAGR

      Accelerate at a CAGR of 18.52%

      Market growth 2024-2028

      USD 7434.8 million

      Market structure

      Fragmented

      YoY growth 2023-2024(%)

      15.18

      Key countries

      US, Germany, China, UK, and Italy

      Competitive landscape

      Leading Companies, Market Positioning of Companies, Competitive Strategies, and Industry Risks

      Request Free Sample

      What are the Key Data Covered in this Biogas Upgrading Equipment Market Research and Growth Report?

      • CAGR of the Biogas Upgrading Equipment industry during the forecast period
      • Detailed information on factors that will drive the growth and forecasting between 2024 and 2028
      • Precise estimation of the size of the market and its contribution of the industry in focus to the parent market
      • Accurate predictions about upcoming growth and trends and changes in consumer behaviour
      • Growth of the market across Europe, North America, APAC, South America, and Middle East and Africa
      • Thorough analysis of the market’s competitive landscape and detailed information about companies
      • Comprehensive analysis of factors that will challenge the biogas upgrading equipment market growth of industry companies

      We can help! Our analysts can customize this biogas upgrading equipment market research report to meet your requirements.

      Get in touch


      1 Executive Summary

      • 1.1 Market overview
        • Executive Summary - Chart on Market Overview
        • Executive Summary - Data Table on Market Overview
        • Executive Summary - Chart on Global Market Characteristics
        • Executive Summary - Chart on Market by Geography
        • Executive Summary - Chart on Market Segmentation by Technology
        • Executive Summary - Chart on Incremental Growth
        • Executive Summary - Data Table on Incremental Growth
        • Executive Summary - Chart on Company Market Positioning

      2 Market Landscape

      • 2.1 Market ecosystem
        • Parent Market
        • Data Table on - Parent Market
      • 2.2 Market characteristics
        • Market characteristics analysis
      • 2.3 Value chain analysis
        • Value Chain Analysis

      3 Market Sizing

      • 3.1 Market definition
        • Offerings of companies included in the market definition
      • 3.2 Market segment analysis
        • Market segments
      • 3.3 Market size 2023
        • 3.4 Market outlook: Forecast for 2023-2028
          • Chart on Global - Market size and forecast 2023-2028 ($ million)
          • Data Table on Global - Market size and forecast 2023-2028 ($ million)
          • Chart on Global Market: Year-over-year growth 2023-2028 (%)
          • Data Table on Global Market: Year-over-year growth 2023-2028 (%)

        4 Historic Market Size

        • 4.1 Global Biogas Upgrading Equipment Market 2018 - 2022
          • Historic Market Size - Data Table on Global Biogas Upgrading Equipment Market 2018 - 2022 ($ million)
        • 4.2 Technology segment analysis 2018 - 2022
          • Historic Market Size - Technology Segment 2018 - 2022 ($ million)
        • 4.3 Geography segment analysis 2018 - 2022
          • Historic Market Size - Geography Segment 2018 - 2022 ($ million)
        • 4.4 Country segment analysis 2018 - 2022
          • Historic Market Size - Country Segment 2018 - 2022 ($ million)

        5 Five Forces Analysis

        • 5.1 Five forces summary
          • Five forces analysis - Comparison between 2023 and 2028
        • 5.2 Bargaining power of buyers
          • Bargaining power of buyers - Impact of key factors 2023 and 2028
        • 5.3 Bargaining power of suppliers
          • Bargaining power of suppliers - Impact of key factors in 2023 and 2028
        • 5.4 Threat of new entrants
          • Threat of new entrants - Impact of key factors in 2023 and 2028
        • 5.5 Threat of substitutes
          • Threat of substitutes - Impact of key factors in 2023 and 2028
        • 5.6 Threat of rivalry
          • Threat of rivalry - Impact of key factors in 2023 and 2028
        • 5.7 Market condition
          • Chart on Market condition - Five forces 2023 and 2028

        6 Market Segmentation by Technology

        • 6.1 Market segments
          • Chart on Technology - Market share 2023-2028 (%)
          • Data Table on Technology - Market share 2023-2028 (%)
        • 6.2 Comparison by Technology
          • Chart on Comparison by Technology
          • Data Table on Comparison by Technology
        • 6.3 Water scrubber - Market size and forecast 2023-2028
          • Chart on Water scrubber - Market size and forecast 2023-2028 ($ million)
          • Data Table on Water scrubber - Market size and forecast 2023-2028 ($ million)
          • Chart on Water scrubber - Year-over-year growth 2023-2028 (%)
          • Data Table on Water scrubber - Year-over-year growth 2023-2028 (%)
        • 6.4 Chemical scrubber - Market size and forecast 2023-2028
          • Chart on Chemical scrubber - Market size and forecast 2023-2028 ($ million)
          • Data Table on Chemical scrubber - Market size and forecast 2023-2028 ($ million)
          • Chart on Chemical scrubber - Year-over-year growth 2023-2028 (%)
          • Data Table on Chemical scrubber - Year-over-year growth 2023-2028 (%)
        • 6.5 Pressure swing adsorption (PSA) - Market size and forecast 2023-2028
          • Chart on Pressure swing adsorption (PSA) - Market size and forecast 2023-2028 ($ million)
          • Data Table on Pressure swing adsorption (PSA) - Market size and forecast 2023-2028 ($ million)
          • Chart on Pressure swing adsorption (PSA) - Year-over-year growth 2023-2028 (%)
          • Data Table on Pressure swing adsorption (PSA) - Year-over-year growth 2023-2028 (%)
        • 6.6 Membrane - Market size and forecast 2023-2028
          • Chart on Membrane - Market size and forecast 2023-2028 ($ million)
          • Data Table on Membrane - Market size and forecast 2023-2028 ($ million)
          • Chart on Membrane - Year-over-year growth 2023-2028 (%)
          • Data Table on Membrane - Year-over-year growth 2023-2028 (%)
        • 6.7 Others - Market size and forecast 2023-2028
          • Chart on Others - Market size and forecast 2023-2028 ($ million)
          • Data Table on Others - Market size and forecast 2023-2028 ($ million)
          • Chart on Others - Year-over-year growth 2023-2028 (%)
          • Data Table on Others - Year-over-year growth 2023-2028 (%)
        • 6.8 Market opportunity by Technology
          • Market opportunity by Technology ($ million)
          • Data Table on Market opportunity by Technology ($ million)

        7 Customer Landscape

        • 7.1 Customer landscape overview
          • Analysis of price sensitivity, lifecycle, customer purchase basket, adoption rates, and purchase criteria

        8 Geographic Landscape

        • 8.1 Geographic segmentation
          • Chart on Market share by geography 2023-2028 (%)
          • Data Table on Market share by geography 2023-2028 (%)
        • 8.2 Geographic comparison
          • Chart on Geographic comparison
          • Data Table on Geographic comparison
        • 8.3 Europe - Market size and forecast 2023-2028
          • Chart on Europe - Market size and forecast 2023-2028 ($ million)
          • Data Table on Europe - Market size and forecast 2023-2028 ($ million)
          • Chart on Europe - Year-over-year growth 2023-2028 (%)
          • Data Table on Europe - Year-over-year growth 2023-2028 (%)
        • 8.4 North America - Market size and forecast 2023-2028
          • Chart on North America - Market size and forecast 2023-2028 ($ million)
          • Data Table on North America - Market size and forecast 2023-2028 ($ million)
          • Chart on North America - Year-over-year growth 2023-2028 (%)
          • Data Table on North America - Year-over-year growth 2023-2028 (%)
        • 8.5 APAC - Market size and forecast 2023-2028
          • Chart on APAC - Market size and forecast 2023-2028 ($ million)
          • Data Table on APAC - Market size and forecast 2023-2028 ($ million)
          • Chart on APAC - Year-over-year growth 2023-2028 (%)
          • Data Table on APAC - Year-over-year growth 2023-2028 (%)
        • 8.6 South America - Market size and forecast 2023-2028
          • Chart on South America - Market size and forecast 2023-2028 ($ million)
          • Data Table on South America - Market size and forecast 2023-2028 ($ million)
          • Chart on South America - Year-over-year growth 2023-2028 (%)
          • Data Table on South America - Year-over-year growth 2023-2028 (%)
        • 8.7 Middle East and Africa - Market size and forecast 2023-2028
          • Chart on Middle East and Africa - Market size and forecast 2023-2028 ($ million)
          • Data Table on Middle East and Africa - Market size and forecast 2023-2028 ($ million)
          • Chart on Middle East and Africa - Year-over-year growth 2023-2028 (%)
          • Data Table on Middle East and Africa - Year-over-year growth 2023-2028 (%)
        • 8.8 US - Market size and forecast 2023-2028
          • Chart on US - Market size and forecast 2023-2028 ($ million)
          • Data Table on US - Market size and forecast 2023-2028 ($ million)
          • Chart on US - Year-over-year growth 2023-2028 (%)
          • Data Table on US - Year-over-year growth 2023-2028 (%)
        • 8.9 Germany - Market size and forecast 2023-2028
          • Chart on Germany - Market size and forecast 2023-2028 ($ million)
          • Data Table on Germany - Market size and forecast 2023-2028 ($ million)
          • Chart on Germany - Year-over-year growth 2023-2028 (%)
          • Data Table on Germany - Year-over-year growth 2023-2028 (%)
        • 8.10 China - Market size and forecast 2023-2028
          • Chart on China - Market size and forecast 2023-2028 ($ million)
          • Data Table on China - Market size and forecast 2023-2028 ($ million)
          • Chart on China - Year-over-year growth 2023-2028 (%)
          • Data Table on China - Year-over-year growth 2023-2028 (%)
        • 8.11 UK - Market size and forecast 2023-2028
          • Chart on UK - Market size and forecast 2023-2028 ($ million)
          • Data Table on UK - Market size and forecast 2023-2028 ($ million)
          • Chart on UK - Year-over-year growth 2023-2028 (%)
          • Data Table on UK - Year-over-year growth 2023-2028 (%)
        • 8.12 Italy - Market size and forecast 2023-2028
          • Chart on Italy - Market size and forecast 2023-2028 ($ million)
          • Data Table on Italy - Market size and forecast 2023-2028 ($ million)
          • Chart on Italy - Year-over-year growth 2023-2028 (%)
          • Data Table on Italy - Year-over-year growth 2023-2028 (%)
        • 8.13 Market opportunity by geography
          • Market opportunity by geography ($ million)
          • Data Tables on Market opportunity by geography ($ million)

        9 Drivers, Challenges, and Opportunity/Restraints

        • 9.1 Market drivers
          • 9.2 Market challenges
            • 9.3 Impact of drivers and challenges
              • Impact of drivers and challenges in 2023 and 2028
            • 9.4 Market opportunities/restraints

              10 Competitive Landscape

              • 10.1 Overview
                • 10.2 Competitive Landscape
                  • Overview on criticality of inputs and factors of differentiation
                • 10.3 Landscape disruption
                  • Overview on factors of disruption
                • 10.4 Industry risks
                  • Impact of key risks on business

                11 Competitive Analysis

                • 11.1 Companies profiled
                  • Companies covered
                • 11.2 Market positioning of companies
                  • Matrix on companies position and classification
                • 2G Energy AG
                  • 2G Energy AG - Overview
                  • 2G Energy AG - Product / Service
                  • 2G Energy AG - Key offerings
                • 11.4 AAT Abwasser und Abfalltechnik GmbH
                  • AAT Abwasser und Abfalltechnik GmbH - Overview
                  • AAT Abwasser und Abfalltechnik GmbH - Product / Service
                  • AAT Abwasser und Abfalltechnik GmbH - Key offerings
                • 11.5 Air Liquide SA
                  • Air Liquide SA - Overview
                  • Air Liquide SA - Business segments
                  • Air Liquide SA - Key news
                  • Air Liquide SA - Key offerings
                  • Air Liquide SA - Segment focus
                • 11.6 Atlas Copco AB
                  • Atlas Copco AB - Overview
                  • Atlas Copco AB - Business segments
                  • Atlas Copco AB - Key news
                  • Atlas Copco AB - Key offerings
                  • Atlas Copco AB - Segment focus
                • 11.7 Carbotech Gas Systems GmbH
                  • Carbotech Gas Systems GmbH - Overview
                  • Carbotech Gas Systems GmbH - Product / Service
                  • Carbotech Gas Systems GmbH - Key offerings
                • 11.8 DMT International
                  • DMT International - Overview
                  • DMT International - Product / Service
                  • DMT International - Key offerings
                • 11.9 DVO Inc.
                  • DVO Inc. - Overview
                  • DVO Inc. - Product / Service
                  • DVO Inc. - Key offerings
                • 11.10 Greenlane Renewables Inc.
                  • Greenlane Renewables Inc. - Overview
                  • Greenlane Renewables Inc. - Product / Service
                  • Greenlane Renewables Inc. - Key offerings
                • 11.11 HAASE Umwelttechnik GmbH
                  • HAASE Umwelttechnik GmbH - Overview
                  • HAASE Umwelttechnik GmbH - Product / Service
                  • HAASE Umwelttechnik GmbH - Key offerings
                • 11.12 Jog Waste to Energy Pvt. Ltd.
                  • Jog Waste to Energy Pvt. Ltd. - Overview
                  • Jog Waste to Energy Pvt. Ltd. - Product / Service
                  • Jog Waste to Energy Pvt. Ltd. - Key offerings
                • 11.13 MalmbergGruppen AB
                  • MalmbergGruppen AB - Overview
                  • MalmbergGruppen AB - Product / Service
                  • MalmbergGruppen AB - Key offerings
                • 11.14 Nacelle Logistics LLC
                  • Nacelle Logistics LLC - Overview
                  • Nacelle Logistics LLC - Product / Service
                  • Nacelle Logistics LLC - Key offerings
                • 11.15 NeoZeo AB
                  • NeoZeo AB - Overview
                  • NeoZeo AB - Product / Service
                  • NeoZeo AB - Key offerings
                • 11.16 Pentair Plc
                  • Pentair Plc - Overview
                  • Pentair Plc - Business segments
                  • Pentair Plc - Key news
                  • Pentair Plc - Key offerings
                  • Pentair Plc - Segment focus
                • 11.17 Xebec Adsorption Inc.
                  • Xebec Adsorption Inc. - Overview
                  • Xebec Adsorption Inc. - Product / Service
                  • Xebec Adsorption Inc. - Key offerings

                12 Appendix

                • 12.1 Scope of the report
                  • 12.2 Inclusions and exclusions checklist
                    • Inclusions checklist
                    • Exclusions checklist
                  • 12.3 Currency conversion rates for US$
                    • Currency conversion rates for US$
                  • 12.4 Research methodology
                    • Research methodology
                  • 12.5 Data procurement
                    • Information sources
                  • 12.6 Data validation
                    • Data validation
                  • 12.7 Validation techniques employed for market sizing
                    • Validation techniques employed for market sizing
                  • 12.8 Data synthesis
                    • Data synthesis
                  • 12.9 360 degree market analysis
                    • 360 degree market analysis
                  • 12.10 List of abbreviations
                    • List of abbreviations

                  Research Methodology

                  Technavio presents a detailed picture of the market by way of study, synthesis, and summation of data from multiple sources. The analysts have presented the various facets of the market with a particular focus on identifying the key industry influencers. The data thus presented is comprehensive, reliable, and the result of extensive research, both primary and secondary.

                  INFORMATION SOURCES

                  Primary sources

                  • Manufacturers and suppliers
                  • Channel partners
                  • Industry experts
                  • Strategic decision makers

                  Secondary sources

                  • Industry journals and periodicals
                  • Government data
                  • Financial reports of key industry players
                  • Historical data
                  • Press releases

                  DATA ANALYSIS

                  Data Synthesis

                  • Collation of data
                  • Estimation of key figures
                  • Analysis of derived insights

                  Data Validation

                  • Triangulation with data models
                  • Reference against proprietary databases
                  • Corroboration with industry experts

                  REPORT WRITING

                  Qualitative

                  • Market drivers
                  • Market challenges
                  • Market trends
                  • Five forces analysis

                  Quantitative

                  • Market size and forecast
                  • Market segmentation
                  • Geographical insights
                  • Competitive landscape

                  Interested in this report?

                  Get your sample now to see our research methodology and insights!

                  Download Now

                  Frequently Asked Questions

                  Biogas Upgrading Equipment market growth will increase by $ 7434.8 mn during 2024-2028 .

                  The Biogas Upgrading Equipment market is expected to grow at a CAGR of 18.52% during 2024-2028 .

                  Biogas Upgrading Equipment market is segmented by Technology( Water scrubber, Chemical scrubber, Pressure swing adsorption (PSA), Membrane, Others)

                  2G Energy AG, AAT Abwasser und Abfalltechnik GmbH, Air Liquide SA, Atlas Copco AB, Bright Renewables B.V., Carbotech Gas Systems GmbH, Condorchem Envitech SL, DMT International, DP CleanTech Co. Ltd., DVO Inc., Greenlane Renewables Inc., HAASE Umwelttechnik GmbH, Jog Waste to Energy Pvt. Ltd., MalmbergGruppen AB, Nacelle Logistics LLC, NeoZeo AB, Pentair Plc, Veolia Environnement SA, Xebec Adsorption Inc. are a few of the key vendors in the Biogas Upgrading Equipment market.

                  Europe will register the highest growth rate of 39% among the other regions. Therefore, the Biogas Upgrading Equipment market in Europe is expected to garner significant business opportunities for the vendors during the forecast period.

                  US, Germany, China, UK, Italy

                  • Need for cleaner fuelBiogas is the driving factor this market.
                  • unlike oil and natural gas is the driving factor this market.
                  • is a renewable fuel. It is extracted from biodegradable substances and waste products and then recycled and upgraded to serve as fuel for reuse in various applications. The quality of this biofuel is dependent on the concentration of methane present in it. The methane concentration makes the biogas cleaner and more effective in various applications. The biogas available is low in methane content and must be upgraded for practical purposes. The rise in GHG emission levels and the need to diversify the energy mix drive the demand for efficient and cleaner alternative fuels is the driving factor this market.
                  • such as biogas is the driving factor this market.
                  • biodiesel is the driving factor this market.
                  • and ethanol is the driving factor this market.
                  • with research and development efforts worldwide. Biogas is used as an alternative to natural gas. Unlike natural gas is the driving factor this market.
                  • which is volatile to price changes globally is the driving factor this market.
                  • biogas helps in avoiding the consumption of natural gas when used as an alternative fuel and thereby strengthens the economy. When biogas is used to supply heat and electricity is the driving factor this market.
                  • it burns the methane content that would have been released into the atmosphere and is is the driving factor this market.
                  • thus is the driving factor this market.
                  • safer than conventional fuels. Biogas has a high content of carbon dioxide in comparison to natural gas. However is the driving factor this market.
                  • the process of upgrading biogas into pure methane removes virtually all carbon dioxide and also hydrogen sulfide is the driving factor this market.
                  • which is harmful in nature. Besides is the driving factor this market.
                  • upgraded biogas burns twice as efficient when compared with its regular state. This enables the upgraded biogas to reach the quality of natural gas. Thus is the driving factor this market.
                  • the need for upgraded biogas is growing fast is the driving factor this market.
                  • and to cater to it is the driving factor this market.
                  • the production of more upgraded biogas is required using appropriate equipment. Hence the demand for upgrading equipment is increasing is the driving factor this market.
                  • which is expected to drive the growth of the global biogas upgrading equipment market during the forecast period. is the driving factor this market.

                  The Biogas Upgrading Equipment market vendors should focus on grabbing business opportunities from the Water scrubber segment as it accounted for the largest market share in the base year.