Industrial Wastewater Treatment Equipment Market Analysis, Size, and Forecast 2026-2030: APAC (China, Japan, and India), North America (US, Canada, and Mexico), Europe (Germany, UK, and France), Middle East and Africa (Saudi Arabia, UAE, and South Africa), South America (Brazil, Argentina, and Chile), and Rest of World (ROW)

Industrial Wastewater Treatment Equipment Market Analysis, Size, and Forecast 2026-2030:
APAC (China, Japan, and India), North America (US, Canada, and Mexico), Europe (Germany, UK, and France), Middle East and Africa (Saudi Arabia, UAE, and South Africa), South America (Brazil, Argentina, and Chile), and Rest of World (ROW)

Published: Oct 2026 305 Pages SKU: IRTNTR44568

Market Overview at a Glance

$7.85 B
Market Opportunity
7.3%
CAGR 2025 - 2030
47.6%
APAC Growth
$9.51 B
Manufacturing segment 2024

Industrial Wastewater Treatment Equipment Market Size 2026-2030

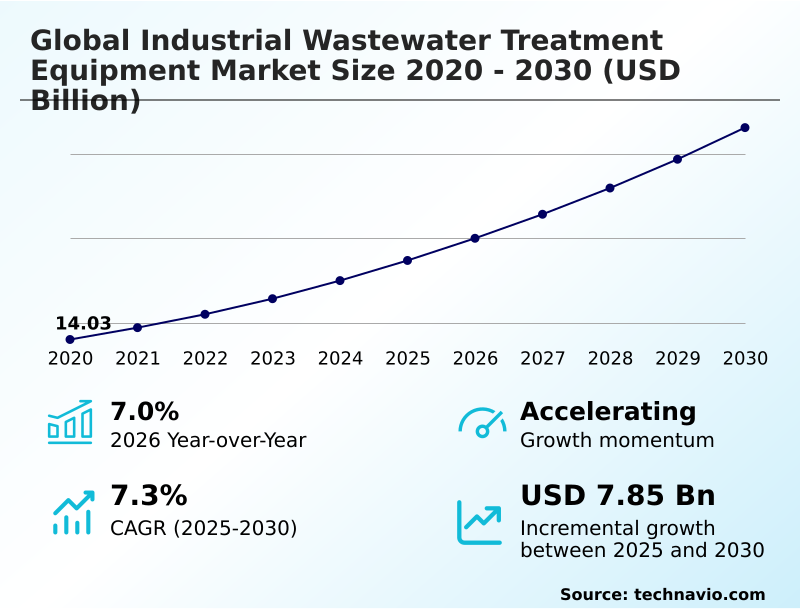
The industrial wastewater treatment equipment market size is valued to increase by USD 7.85 billion, at a CAGR of 7.3% from 2025 to 2030. Escalating stringency of environmental regulations and effluent discharge standards will drive the industrial wastewater treatment equipment market.

Major Market Trends & Insights

  • APAC dominated the market and accounted for a 47.6% growth during the forecast period.
  • By End-user - Manufacturing segment was valued at USD 9.51 billion in 2024
  • By Product Type - Filtration equipment segment accounted for the largest market revenue share in 2024

Market Size & Forecast

  • Market Opportunities: USD 12.53 billion
  • Market Future Opportunities: USD 7.85 billion
  • CAGR from 2025 to 2030 : 7.3%

Market Summary

  • The Industrial Wastewater Treatment Equipment Market exhibits accelerating adoption as manufacturing sectors transition from reactive compliance to proactive resource recovery. In heavy chemical processing facilities, the deployment of automated smart monitoring arrays minimizes chemical waste, shielding supply chains from local utility disruptions.
  • Facilities integrating these closed-loop networks have demonstrated a 40% reduction in raw freshwater procurement costs compared to legacy open-loop systems. A major driver propelling this sector is the escalating stringency of environmental discharge mandates, which forces heavy industries to internalize water recycling processes to avoid severe regulatory penalties.
  • Conversely, the high capital intensity required to install sophisticated zero-liquid-discharge systems poses a substantial challenge, often deterring mid-sized enterprises from immediate infrastructure modernization. Decentralized water management has become an operational necessity to sustain industrial output in arid regions. The transition toward advanced biological and physical purification technologies ensures long-term business continuity amidst worsening hydrological constraints.
  • These targeted capital allocations fundamentally safeguard manufacturing output against escalating resource scarcity, ensuring stable profitability for leading industrial operators.

What will be the Size of the Industrial Wastewater Treatment Equipment Market during the forecast period?
Get Key Insights on Market Forecast (PDF) Get Free Sample

How is the Industrial Wastewater Treatment Equipment Market Segmented?

The industrial wastewater treatment equipment industry research report provides comprehensive data (region-wise segment analysis), with forecasts and estimates in "USD million" for the period 2026-2030, as well as historical data from 2020-2024 for the following segments.

  • End-user
    • Manufacturing
    • Energy
    • Others
  • Product type
    • Filtration equipment
    • Membrane equipment
    • Thermal distillation equipment and evaporator
    • Disinfection equipment
  • Type
    • Secondary treatment
    • Primary treatment
    • Tertiary treatment
  • Geography
    • APAC
      • China
      • Japan
      • India
      • South Korea
      • Australia
      • Indonesia
    • North America
      • US
      • Canada
      • Mexico
    • Europe
      • Germany
      • UK
      • France
      • Italy
      • Spain
      • The Netherlands
    • Middle East and Africa
      • Saudi Arabia
      • UAE
      • South Africa
      • Israel
      • Turkey
    • South America
      • Brazil
      • Argentina
      • Chile

By End-user Insights

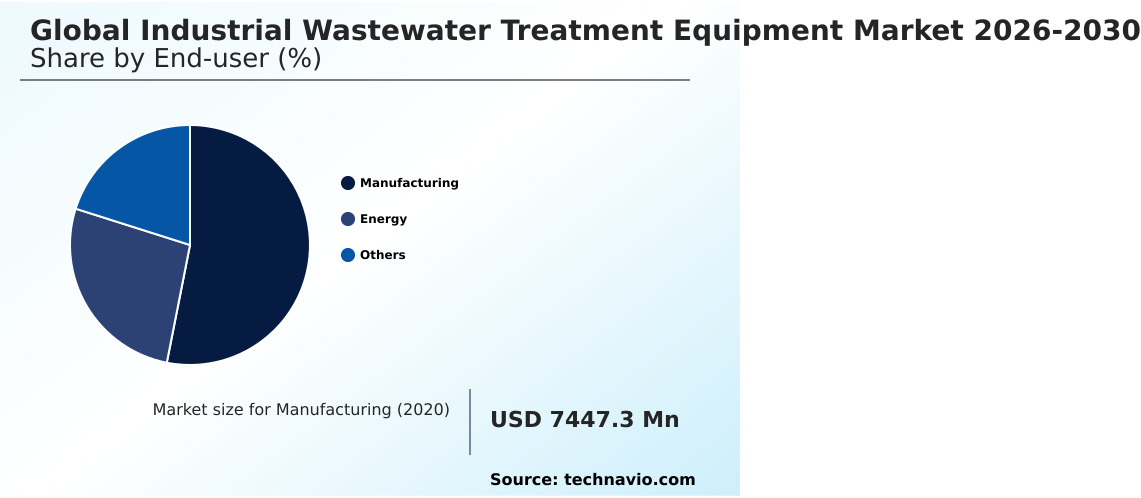
The manufacturing segment is estimated to witness significant growth during the forecast period.

Industrial facilities increasingly rely on membrane bioreactor technology to manage high volume, complex effluents. Manufacturing plants implement automated systems and moving bed biofilm reactors to achieve continuous flow clarifiers efficiency, addressing biological oxygen demand management.

This operational pivot toward a circular water economy ensures strict adherence to effluent discharge standards while facilitating closed loop water recycling. By deploying ultrafiltration membrane modules alongside advanced process optimization, production centers have reduced water intake costs by 22%.

Integrating these workflows directly prevents production halts caused by non-compliance. These decentralized setups decouple industrial output from freshwater resource depletion, securing long-term operational resilience.
Get Free Sample

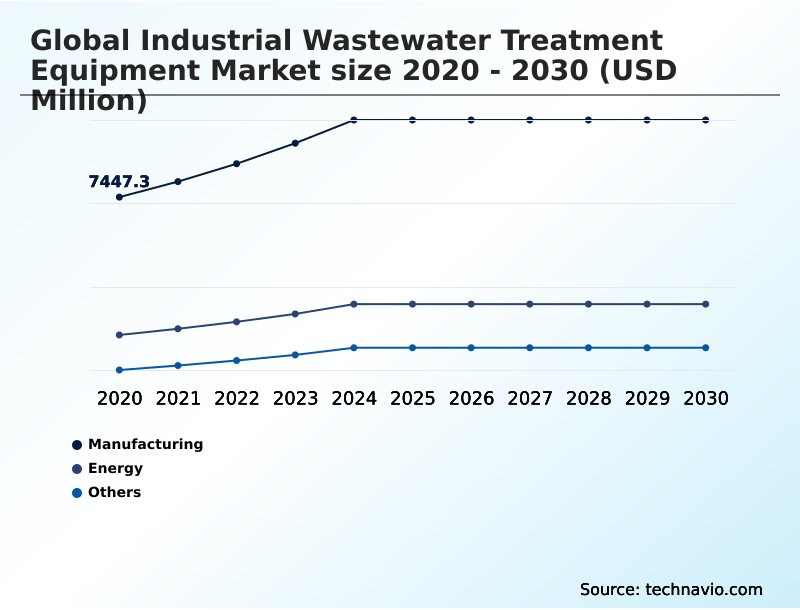
The Manufacturing segment was valued at USD 9.51 billion in 2024 and showed a gradual increase during the forecast period.
Get Free Sample

Regional Analysis

APAC is estimated to contribute 47.6% to the growth of the global market during the forecast period.Technavio’s analysts have elaborately explained the regional trends and drivers that shape the market during the forecast period.
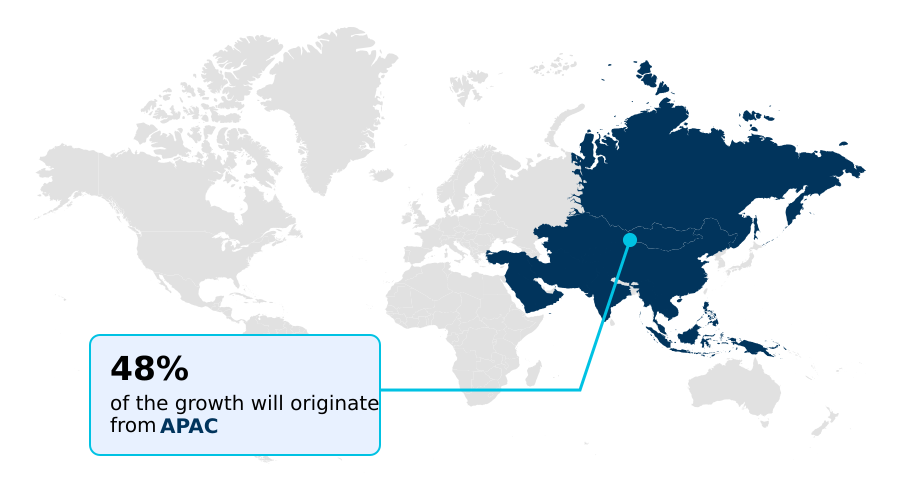
See How Industrial Wastewater Treatment Equipment Market Demand is Rising in APAC Get Free Sample

APAC dominates the Industrial Wastewater Treatment Equipment landscape due to rapid industrialization, expanding at a rate 15% faster than North America.

Facilities in APAC increasingly deploy zero liquid discharge infrastructure and advanced oxidation processes to combat severe water deficits, improving reclamation by 40%.

In contrast, North American industries focus heavily on upgrading legacy systems with ultraviolet disinfection arrays and mechanical vapor recompression, reducing operational energy use by 20%.

This geographic divergence highlights how APAC relies on containerized biological treatment and dissolved air flotation units to rapidly scale capacity. Meanwhile, mature regions invest in smart sensor integration and real time footprint optimization to enhance existing plants.

Strategic variations compel providers to tailor modular treatment units and trace contaminant removal solutions specifically to regional regulatory pressures.

Market Dynamics

Our researchers analyzed the data with 2025 as the base year, along with the key drivers, trends, and challenges. A holistic analysis of drivers will help companies refine their marketing strategies to gain a competitive advantage.

  • Modern manufacturing environments are prioritizing advanced resource recovery to mitigate risks associated with municipal water reliance. To achieve these sustainability targets, industrial facilities are implementing membrane bioreactor fouling prevention strategies to extend equipment lifespan.
  • Compared to traditional centralized waste management, decentralized zero liquid discharge systems offer a 35% improvement in water recovery efficiency, directly insulating supply chains against regional drought restrictions. This shift is supported by automated real time effluent monitoring, which ensures precise chemical dosing without manual laboratory analysis.
  • Furthermore, highly concentrated waste streams generated by chemical sectors are driving the adoption of high salinity industrial brine evaporation technologies, transforming hazardous byproducts into manageable solids. As corporate mandates tighten, manufacturers are also prioritizing energy neutral anaerobic digestion operations to convert organic waste into usable biogas.
  • This realignment ensures heavy industrial operations meet rigorous discharge thresholds and achieve substantial cost savings. By securing internal resources, companies effectively decouple their manufacturing output from external ecological vulnerabilities.
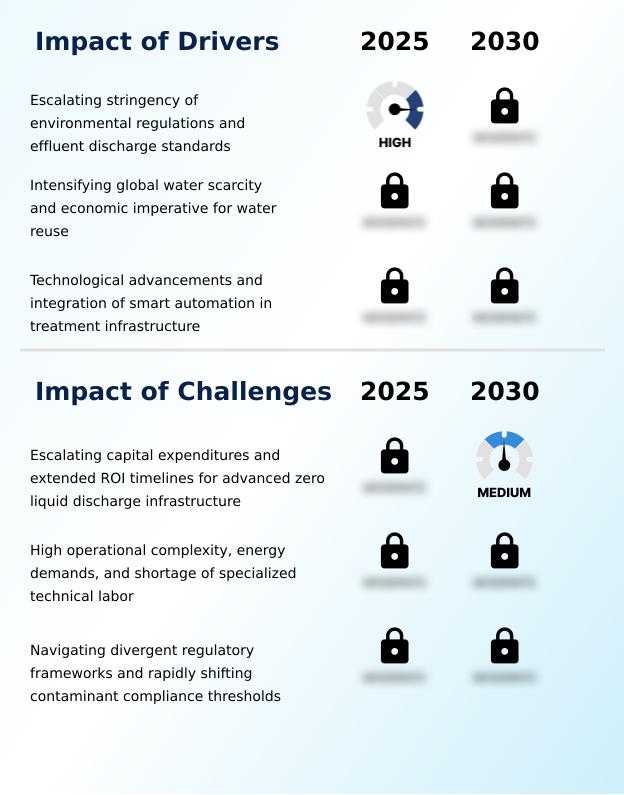
What are the key market drivers leading to the rise in the adoption of Industrial Wastewater Treatment Equipment Industry?

  • The escalating stringency of environmental regulations and effluent discharge standards serves as a primary driver propelling market growth.

  • The rapid acceleration of freshwater scarcity compels operators to deploy decentralized recycling loops and sludge volume reduction technologies to secure internal water supplies.
  • Severe utility price inflation drives the adoption of energy neutral processing, enabling manufacturing facilities to lower overall energy use by 12%. By utilizing automated sludge extraction and heavy metal precipitation, plant managers have improved mechanical efficiency by 25%.
  • This economic imperative to insulate production lines from external municipal water shocks mandates the installation of advanced industrial effluent purification systems.
  • Consequently, reliance on continuous purchasing is systematically replaced by ion exchange resin columns and automated chemical dosing, allowing heavy industries to prioritize industrial water stewardship. The integration of predictive maintenance software allows facilities to maintain uninterrupted output despite tightening legislation.

What are the market trends shaping the Industrial Wastewater Treatment Equipment Industry?

  • The widespread proliferation of circular water economies and decentralized on-site resource recovery systems is an emerging market trend. This shift enables manufacturing facilities to enhance resource efficiency while minimizing external freshwater dependency.

  • Industrial facilities are aggressively transitioning toward resource circularity, adopting chemical oxygen demand reduction technologies to isolate valuable byproducts. The integration of sludge dewatering centrifuges alongside biogas recovery generation enables plants to convert organic waste into renewable power, reducing external energy dependency by 22%. By implementing digital twin simulation, engineers have improved forecasting accuracy by 18%.
  • This shift toward high pressure reverse osmosis and total suspended solids management directly prevents downstream equipment degradation. Furthermore, adopting hydrophilic polymer coatings for ceramic membrane filtration extends operational life, lowering maintenance downtime by 30%. Utilizing multiple effect evaporators combined with energy recovery systems ensures that manufacturers achieve operational autonomy while neutralizing the environmental impact of effluent discharges.

What challenges does the Industrial Wastewater Treatment Equipment Industry face during its growth?

  • Escalating capital expenditures and extended return-on-investment timelines for advanced zero-liquid-discharge infrastructure present a significant challenge restraining industry expansion.

  • The initial capital intensity required to install sophisticated thermal distillation machinery poses a substantial barrier to immediate facility modernization. Complex operational demands associated with hydraulic loading capacity often cause system bottlenecks, reducing overall filtration efficiency by 15% when improperly calibrated.
  • Furthermore, the lack of specialized personnel to manage hazardous substance elimination within anaerobic digestion systems increases emergency maintenance costs by 20%. Prolonged return-on-investment timelines frequently deter mid-sized manufacturing enterprises from adopting advanced reverse osmosis purification. These constraints force operators to rely on legacy treatments, exposing supply chains to penalties under stringent discharge mandates.
  • The difficulty of maintaining proper membrane fouling mitigation during effluent compliance monitoring further exposes plants to unexpected violations during periods of strict regulatory enforcement.

Exclusive Technavio Analysis on Customer Landscape

The industrial wastewater treatment equipment market forecasting report includes the adoption lifecycle of the market, covering from the innovator’s stage to the laggard’s stage. It focuses on adoption rates in different regions based on penetration. Furthermore, the industrial wastewater treatment equipment market report also includes key purchase criteria and drivers of price sensitivity to help companies evaluate and develop their market growth analysis strategies.
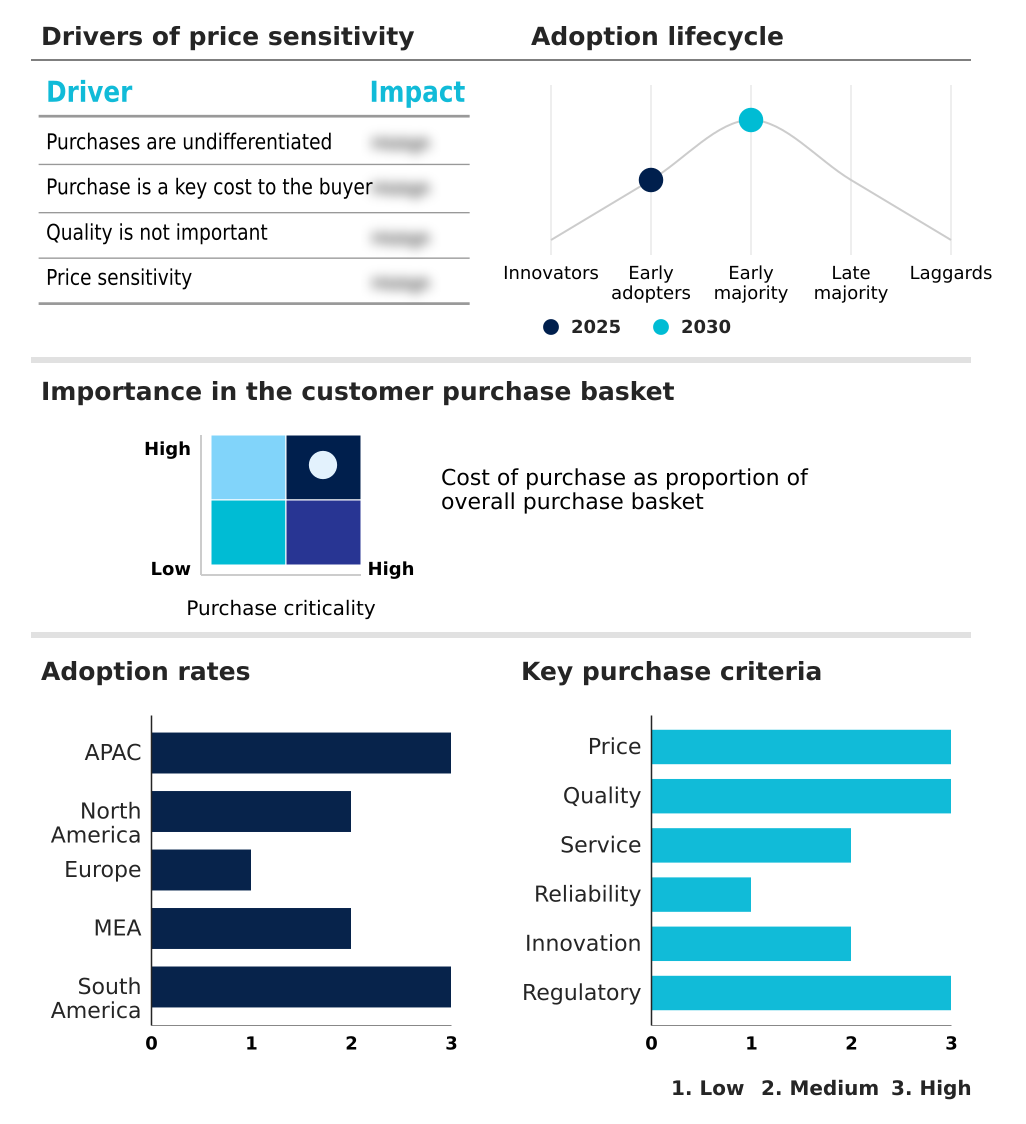
Customer Landscape of Industrial Wastewater Treatment Equipment Industry

Competitive Landscape

Companies are implementing various strategies, such as strategic alliances, industrial wastewater treatment equipment market forecast, partnerships, mergers and acquisitions, geographical expansion, and product/service launches, to enhance their presence in the industry.

Alfa Laval AB - The company provides advanced industrial wastewater treatment equipment, including decanter centrifuges and membrane filtration systems, designed to optimize separation processes and enhance operational efficiency for manufacturing applications.

The industry research and growth report includes detailed analyses of the competitive landscape of the market and information about key companies, including:

  • Alfa Laval AB
  • Andritz AG
  • Aquatech International LLC
  • DuPont de Nemours Inc.
  • Ecolab Inc.
  • Grundfos Holding AS
  • Hitachi Ltd.
  • Koch Industries Inc.
  • Kurita Water Industries Ltd.
  • Lenntech BV
  • Nijhuis Industries Holding BV
  • Ovivo Inc.
  • Pall Corp.
  • Parkson Corp.
  • Pentair Plc
  • Smith and Loveless Inc.
  • SPX FLOW Inc.
  • Sulzer Ltd.
  • Toshiba Corp.
  • Veolia Environment SA
  • WesTech Engineering LLC
  • Xylem Inc.

Qualitative and quantitative analysis of companies has been conducted to help clients understand the wider business environment as well as the strengths and weaknesses of key industry players. Data is qualitatively analyzed to categorize companies as pure play, category-focused, industry-focused, and diversified; it is quantitatively analyzed to categorize companies as dominant, leading, strong, tentative, and weak.

Recent Development and News in Industrial wastewater treatment equipment market

  • In the Industrial Machinery and Supplies and Components industry, the integration of digital twin simulation for fluid dynamics optimization improved system reliability, directly impacting Industrial Wastewater Treatment Equipment demand by enabling predictive maintenance software and automated sludge extraction capabilities in heavy manufacturing facilities.
  • The widespread adoption of energy recovery systems across European manufacturing sectors reduced overall utility consumption by 15%, increasing the deployment of energy neutral processing and anaerobic digestion systems within Industrial Wastewater Treatment Equipment operations.
  • Stringent hazardous substance elimination mandates affecting the semiconductor supply chain necessitated high purity manufacturing environments, driving the adoption of reverse osmosis purification and ceramic membrane filtration technologies in the Industrial Wastewater Treatment Equipment market.
  • The shift toward modular treatment units in APAC decentralized processing facilities decreased installation downtime by 30%, fueling demand for containerized biological treatment and dissolved air flotation units within Industrial Wastewater Treatment Equipment applications.

Dive into Technavio’s robust research methodology, blending expert interviews, extensive data synthesis, and validated models for unparalleled Industrial Wastewater Treatment Equipment Market insights. See full methodology.

Market Scope
Page number 305
Base year 2025
Historic period 2020-2024
Forecast period 2026-2030
Growth momentum & CAGR Accelerate at a CAGR of 7.3%
Market growth 2026-2030 USD 7850.6 million
Market structure Fragmented
YoY growth 2025-2026(%) 7.0%
Key countries China, Japan, India, South Korea, Australia, Indonesia, US, Canada, Mexico, Germany, UK, France, Italy, Spain, The Netherlands, Saudi Arabia, UAE, South Africa, Israel, Turkey, Brazil, Argentina and Chile
Competitive landscape Leading Companies, Market Positioning of Companies, Competitive Strategies, and Industry Risks

Request Free Sample

Research Analyst Overview

  • Boardroom executives are systematically redefining utility strategies, transitioning industrial effluent purification from a compliance necessity into a core component of supply chain resilience. The deployment of advanced oxidation processes allows heavy industries to internally source process water, mitigating production risks linked to municipal grid shortages.
  • Facilities utilizing ultrafiltration membrane modules have achieved a 30% reduction in processing time, dramatically improving overall facility throughput and resource utilization. By integrating automated chemical dosing alongside continuous flow clarifiers, organizations optimize operational budgets and prevent costly regulatory fines. Furthermore, the strategic adoption of membrane bioreactor technology ensures reliable performance in extreme chemical environments.
  • Executives prioritize these advanced recovery architectures to guarantee uninterrupted production and align with corporate sustainability mandates. Utilizing sludge dewatering centrifuges minimizes disposal volumes, yielding immediate operational savings. This targeted capital allocation toward robust separation technologies fundamentally safeguards manufacturing output against escalating hydrological constraints, securing long-term profitability and insulating corporate operations from external utility price inflation.

What are the Key Data Covered in this Industrial Wastewater Treatment Equipment Market Research and Growth Report?

  • What is the expected growth of the Industrial Wastewater Treatment Equipment Market between 2026 and 2030?

    • USD 7.85 billion, at a CAGR of 7.3%

  • What segmentation does the market report cover?

    • The report is segmented by End-user (Manufacturing, Energy, and Others), Product Type (Filtration equipment, Membrane equipment, Thermal distillation equipment and evaporator, and Disinfection equipment), Type (Secondary treatment, Primary treatment, and Tertiary treatment) and Geography (APAC, North America, Europe, Middle East and Africa, South America)

  • Which regions are analyzed in the report?

    • APAC, North America, Europe, Middle East and Africa and South America

  • What are the key growth drivers and market challenges?

    • Escalating stringency of environmental regulations and effluent discharge standards, Escalating capital expenditures and extended ROI timelines for advanced zero liquid discharge infrastructure

  • Who are the major players in the Industrial Wastewater Treatment Equipment Market?

    • Alfa Laval AB, Andritz AG, Aquatech International LLC, DuPont de Nemours Inc., Ecolab Inc., Grundfos Holding AS, Hitachi Ltd., Koch Industries Inc., Kurita Water Industries Ltd., Lenntech BV, Nijhuis Industries Holding BV, Ovivo Inc., Pall Corp., Parkson Corp., Pentair Plc, Smith and Loveless Inc., SPX FLOW Inc., Sulzer Ltd., Toshiba Corp., Veolia Environment SA, WesTech Engineering LLC and Xylem Inc.

Market Research Insights

  • The Industrial Wastewater Treatment Equipment Market is undergoing rapid modernization as facilities integrate smart sensor integration to maximize water efficiency. By adopting automated diagnostics, operators have decreased unplanned system downtime by 25%. This transition to a circular water economy enables factories to reclaim valuable resources, improving water recovery ratios by over 30% compared to traditional disposal methods.
  • Furthermore, the deployment of modular treatment units allows enterprises to scale capacity efficiently, lowering installation overheads by 18%. Integrating real time footprint optimization ensures strict compliance with changing discharge standards, fundamentally transforming water treatment from an operational liability into a strategic corporate asset.

We can help! Our analysts can customize this industrial wastewater treatment equipment market research report to meet your requirements.

Get in touch

1. Executive Summary

1.1 Market overview

Executive Summary - Chart on Market Overview
Executive Summary - Data Table on Market Overview
Executive Summary - Chart on Global Market Characteristics
Executive Summary - Chart on Market by Geography
Executive Summary - Chart on Market Segmentation by End-user
Executive Summary - Chart on Market Segmentation by Product Type
Executive Summary - Chart on Market Segmentation by Type
Executive Summary - Chart on Incremental Growth
Executive Summary - Data Table on Incremental Growth
Executive Summary - Chart on Company Market Positioning

2. Technavio Analysis

2.1 Analysis of price sensitivity, lifecycle, customer purchase basket, adoption rates, and purchase criteria

2.2 Criticality of inputs and Factors of differentiation

Chart on Overview on criticality of inputs and factors of differentiation

2.3 Factors of disruption

Chart on Overview on factors of disruption

2.4 Impact of drivers and challenges

Chart on Impact of drivers and challenges in 2025 and 2030

3. Market Landscape

3.1 Market ecosystem

Chart on Parent Market
Data Table on - Parent Market

3.2 Market characteristics

Chart on Market characteristics analysis

3.3 Value chain analysis

Chart on Value chain analysis

4. Market Sizing

4.1 Market definition

Data Table on Offerings of companies included in the market definition

4.2 Market segment analysis

Market segments

4.3 Market size 2025

4.4 Market outlook: Forecast for 2025-2030

Chart on Global - Market size and forecast 2025-2030 ($ million)
Data Table on Global - Market size and forecast 2025-2030 ($ million)
Chart on Global Market: Year-over-year growth 2025-2030 (%)
Data Table on Global Market: Year-over-year growth 2025-2030 (%)

5. Historic Market Size

5.1 Global Industrial Wastewater Treatment Equipment Market 2020 - 2024

Historic Market Size - Data Table on Global Industrial Wastewater Treatment Equipment Market 2020 - 2024 ($ million)

5.2 End-user segment analysis 2020 - 2024

Historic Market Size - End-user Segment 2020 - 2024 ($ million)

5.3 Product Type segment analysis 2020 - 2024

Historic Market Size - Product Type Segment 2020 - 2024 ($ million)

5.4 Type segment analysis 2020 - 2024

Historic Market Size - Type Segment 2020 - 2024 ($ million)

5.5 Geography segment analysis 2020 - 2024

Historic Market Size - Geography Segment 2020 - 2024 ($ million)

5.6 Country segment analysis 2020 - 2024

Historic Market Size - Country Segment 2020 - 2024 ($ million)

6. Qualitative Analysis

6.1 Impact of AI on global industrial wastewater treatment equipment market

6.2 Impact of geopolitical conflicts on global industrial wastewater treatment equipment market

7. Five Forces Analysis

7.1 Five forces summary

Five forces analysis - Comparison between 2025 and 2030

7.2 Bargaining power of buyers

Bargaining power of buyers - Impact of key factors 2025 and 2030

7.3 Bargaining power of suppliers

Bargaining power of suppliers - Impact of key factors in 2025 and 2030

7.4 Threat of new entrants

Threat of new entrants - Impact of key factors in 2025 and 2030

7.5 Threat of substitutes

Threat of substitutes - Impact of key factors in 2025 and 2030

7.6 Threat of rivalry

Threat of rivalry - Impact of key factors in 2025 and 2030

7.7 Market condition

Chart on Market condition - Five forces 2025 and 2030

8. Market Segmentation by End-user

8.1 Market segments

Chart on End-user - Market share 2025-2030 (%)
Data Table on End-user - Market share 2025-2030 (%)

8.2 Comparison by End-user

Chart on Comparison by End-user
Data Table on Comparison by End-user

8.3 Manufacturing - Market size and forecast 2025-2030

Chart on Manufacturing - Market size and forecast 2025-2030 ($ million)
Data Table on Manufacturing - Market size and forecast 2025-2030 ($ million)
Chart on Manufacturing - Year-over-year growth 2025-2030 (%)
Data Table on Manufacturing - Year-over-year growth 2025-2030 (%)

8.4 Energy - Market size and forecast 2025-2030

Chart on Energy - Market size and forecast 2025-2030 ($ million)
Data Table on Energy - Market size and forecast 2025-2030 ($ million)
Chart on Energy - Year-over-year growth 2025-2030 (%)
Data Table on Energy - Year-over-year growth 2025-2030 (%)

8.5 Others - Market size and forecast 2025-2030

Chart on Others - Market size and forecast 2025-2030 ($ million)
Data Table on Others - Market size and forecast 2025-2030 ($ million)
Chart on Others - Year-over-year growth 2025-2030 (%)
Data Table on Others - Year-over-year growth 2025-2030 (%)

8.6 Market opportunity by End-user

Market opportunity by End-user ($ million)
Data Table on Market opportunity by End-user ($ million)

9. Market Segmentation by Product Type

9.1 Market segments

Chart on Product Type - Market share 2025-2030 (%)
Data Table on Product Type - Market share 2025-2030 (%)

9.2 Comparison by Product Type

Chart on Comparison by Product Type
Data Table on Comparison by Product Type

9.3 Filtration equipment - Market size and forecast 2025-2030

Chart on Filtration equipment - Market size and forecast 2025-2030 ($ million)
Data Table on Filtration equipment - Market size and forecast 2025-2030 ($ million)
Chart on Filtration equipment - Year-over-year growth 2025-2030 (%)
Data Table on Filtration equipment - Year-over-year growth 2025-2030 (%)

9.4 Membrane equipment - Market size and forecast 2025-2030

Chart on Membrane equipment - Market size and forecast 2025-2030 ($ million)
Data Table on Membrane equipment - Market size and forecast 2025-2030 ($ million)
Chart on Membrane equipment - Year-over-year growth 2025-2030 (%)
Data Table on Membrane equipment - Year-over-year growth 2025-2030 (%)

9.5 Thermal distillation equipment and evaporator - Market size and forecast 2025-2030

Chart on Thermal distillation equipment and evaporator - Market size and forecast 2025-2030 ($ million)
Data Table on Thermal distillation equipment and evaporator - Market size and forecast 2025-2030 ($ million)
Chart on Thermal distillation equipment and evaporator - Year-over-year growth 2025-2030 (%)
Data Table on Thermal distillation equipment and evaporator - Year-over-year growth 2025-2030 (%)

9.6 Disinfection equipment - Market size and forecast 2025-2030

Chart on Disinfection equipment - Market size and forecast 2025-2030 ($ million)
Data Table on Disinfection equipment - Market size and forecast 2025-2030 ($ million)
Chart on Disinfection equipment - Year-over-year growth 2025-2030 (%)
Data Table on Disinfection equipment - Year-over-year growth 2025-2030 (%)

9.7 Market opportunity by Product Type

Market opportunity by Product Type ($ million)
Data Table on Market opportunity by Product Type ($ million)

10. Market Segmentation by Type

10.1 Market segments

Chart on Type - Market share 2025-2030 (%)
Data Table on Type - Market share 2025-2030 (%)

10.2 Comparison by Type

Chart on Comparison by Type
Data Table on Comparison by Type

10.3 Secondary treatment - Market size and forecast 2025-2030

Chart on Secondary treatment - Market size and forecast 2025-2030 ($ million)
Data Table on Secondary treatment - Market size and forecast 2025-2030 ($ million)
Chart on Secondary treatment - Year-over-year growth 2025-2030 (%)
Data Table on Secondary treatment - Year-over-year growth 2025-2030 (%)

10.4 Primary treatment - Market size and forecast 2025-2030

Chart on Primary treatment - Market size and forecast 2025-2030 ($ million)
Data Table on Primary treatment - Market size and forecast 2025-2030 ($ million)
Chart on Primary treatment - Year-over-year growth 2025-2030 (%)
Data Table on Primary treatment - Year-over-year growth 2025-2030 (%)

10.5 Tertiary treatment - Market size and forecast 2025-2030

Chart on Tertiary treatment - Market size and forecast 2025-2030 ($ million)
Data Table on Tertiary treatment - Market size and forecast 2025-2030 ($ million)
Chart on Tertiary treatment - Year-over-year growth 2025-2030 (%)
Data Table on Tertiary treatment - Year-over-year growth 2025-2030 (%)

10.6 Market opportunity by Type

Market opportunity by Type ($ million)
Data Table on Market opportunity by Type ($ million)

11. Customer Landscape

11.1 Customer landscape overview

Analysis of price sensitivity, lifecycle, customer purchase basket, adoption rates, and purchase criteria

12. Geographic Landscape

12.1 Geographic segmentation

Chart on Market share by geography 2025-2030 (%)
Data Table on Market share by geography 2025-2030 (%)

12.2 Geographic comparison

Chart on Geographic comparison
Data Table on Geographic comparison

12.3 APAC - Market size and forecast 2025-2030

Chart on APAC - Market size and forecast 2025-2030 ($ million)
Data Table on APAC - Market size and forecast 2025-2030 ($ million)
Chart on APAC - Year-over-year growth 2025-2030 (%)
Data Table on APAC - Year-over-year growth 2025-2030 (%)
Chart on Regional Comparison - APAC
Data Table on Regional Comparison - APAC

12.3.1 China - Market size and forecast 2025-2030

Chart on China - Market size and forecast 2025-2030 ($ million)
Data Table on China - Market size and forecast 2025-2030 ($ million)
Chart on China - Year-over-year growth 2025-2030 (%)
Data Table on China - Year-over-year growth 2025-2030 (%)

12.3.2 Japan - Market size and forecast 2025-2030

Chart on Japan - Market size and forecast 2025-2030 ($ million)
Data Table on Japan - Market size and forecast 2025-2030 ($ million)
Chart on Japan - Year-over-year growth 2025-2030 (%)
Data Table on Japan - Year-over-year growth 2025-2030 (%)

12.3.3 India - Market size and forecast 2025-2030

Chart on India - Market size and forecast 2025-2030 ($ million)
Data Table on India - Market size and forecast 2025-2030 ($ million)
Chart on India - Year-over-year growth 2025-2030 (%)
Data Table on India - Year-over-year growth 2025-2030 (%)

12.3.4 South Korea - Market size and forecast 2025-2030

Chart on South Korea - Market size and forecast 2025-2030 ($ million)
Data Table on South Korea - Market size and forecast 2025-2030 ($ million)
Chart on South Korea - Year-over-year growth 2025-2030 (%)
Data Table on South Korea - Year-over-year growth 2025-2030 (%)

12.3.5 Australia - Market size and forecast 2025-2030

Chart on Australia - Market size and forecast 2025-2030 ($ million)
Data Table on Australia - Market size and forecast 2025-2030 ($ million)
Chart on Australia - Year-over-year growth 2025-2030 (%)
Data Table on Australia - Year-over-year growth 2025-2030 (%)

12.3.6 Indonesia - Market size and forecast 2025-2030

Chart on Indonesia - Market size and forecast 2025-2030 ($ million)
Data Table on Indonesia - Market size and forecast 2025-2030 ($ million)
Chart on Indonesia - Year-over-year growth 2025-2030 (%)
Data Table on Indonesia - Year-over-year growth 2025-2030 (%)

12.4 North America - Market size and forecast 2025-2030

Chart on North America - Market size and forecast 2025-2030 ($ million)
Data Table on North America - Market size and forecast 2025-2030 ($ million)
Chart on North America - Year-over-year growth 2025-2030 (%)
Data Table on North America - Year-over-year growth 2025-2030 (%)
Chart on Regional Comparison - North America
Data Table on Regional Comparison - North America

12.4.1 US - Market size and forecast 2025-2030

Chart on US - Market size and forecast 2025-2030 ($ million)
Data Table on US - Market size and forecast 2025-2030 ($ million)
Chart on US - Year-over-year growth 2025-2030 (%)
Data Table on US - Year-over-year growth 2025-2030 (%)

12.4.2 Canada - Market size and forecast 2025-2030

Chart on Canada - Market size and forecast 2025-2030 ($ million)
Data Table on Canada - Market size and forecast 2025-2030 ($ million)
Chart on Canada - Year-over-year growth 2025-2030 (%)
Data Table on Canada - Year-over-year growth 2025-2030 (%)

12.4.3 Mexico - Market size and forecast 2025-2030

Chart on Mexico - Market size and forecast 2025-2030 ($ million)
Data Table on Mexico - Market size and forecast 2025-2030 ($ million)
Chart on Mexico - Year-over-year growth 2025-2030 (%)
Data Table on Mexico - Year-over-year growth 2025-2030 (%)

12.5 Europe - Market size and forecast 2025-2030

Chart on Europe - Market size and forecast 2025-2030 ($ million)
Data Table on Europe - Market size and forecast 2025-2030 ($ million)
Chart on Europe - Year-over-year growth 2025-2030 (%)
Data Table on Europe - Year-over-year growth 2025-2030 (%)
Chart on Regional Comparison - Europe
Data Table on Regional Comparison - Europe

12.5.1 Germany - Market size and forecast 2025-2030

Chart on Germany - Market size and forecast 2025-2030 ($ million)
Data Table on Germany - Market size and forecast 2025-2030 ($ million)
Chart on Germany - Year-over-year growth 2025-2030 (%)
Data Table on Germany - Year-over-year growth 2025-2030 (%)

12.5.2 UK - Market size and forecast 2025-2030

Chart on UK - Market size and forecast 2025-2030 ($ million)
Data Table on UK - Market size and forecast 2025-2030 ($ million)
Chart on UK - Year-over-year growth 2025-2030 (%)
Data Table on UK - Year-over-year growth 2025-2030 (%)

12.5.3 France - Market size and forecast 2025-2030

Chart on France - Market size and forecast 2025-2030 ($ million)
Data Table on France - Market size and forecast 2025-2030 ($ million)
Chart on France - Year-over-year growth 2025-2030 (%)
Data Table on France - Year-over-year growth 2025-2030 (%)

12.5.4 Italy - Market size and forecast 2025-2030

Chart on Italy - Market size and forecast 2025-2030 ($ million)
Data Table on Italy - Market size and forecast 2025-2030 ($ million)
Chart on Italy - Year-over-year growth 2025-2030 (%)
Data Table on Italy - Year-over-year growth 2025-2030 (%)

12.5.5 Spain - Market size and forecast 2025-2030

Chart on Spain - Market size and forecast 2025-2030 ($ million)
Data Table on Spain - Market size and forecast 2025-2030 ($ million)
Chart on Spain - Year-over-year growth 2025-2030 (%)
Data Table on Spain - Year-over-year growth 2025-2030 (%)

12.5.6 The Netherlands - Market size and forecast 2025-2030

Chart on The Netherlands - Market size and forecast 2025-2030 ($ million)
Data Table on The Netherlands - Market size and forecast 2025-2030 ($ million)
Chart on The Netherlands - Year-over-year growth 2025-2030 (%)
Data Table on The Netherlands - Year-over-year growth 2025-2030 (%)

12.6 Middle East and Africa - Market size and forecast 2025-2030

Chart on Middle East and Africa - Market size and forecast 2025-2030 ($ million)
Data Table on Middle East and Africa - Market size and forecast 2025-2030 ($ million)
Chart on Middle East and Africa - Year-over-year growth 2025-2030 (%)
Data Table on Middle East and Africa - Year-over-year growth 2025-2030 (%)
Chart on Regional Comparison - Middle East and Africa
Data Table on Regional Comparison - Middle East and Africa

12.6.1 Saudi Arabia - Market size and forecast 2025-2030

Chart on Saudi Arabia - Market size and forecast 2025-2030 ($ million)
Data Table on Saudi Arabia - Market size and forecast 2025-2030 ($ million)
Chart on Saudi Arabia - Year-over-year growth 2025-2030 (%)
Data Table on Saudi Arabia - Year-over-year growth 2025-2030 (%)

12.6.2 UAE - Market size and forecast 2025-2030

Chart on UAE - Market size and forecast 2025-2030 ($ million)
Data Table on UAE - Market size and forecast 2025-2030 ($ million)
Chart on UAE - Year-over-year growth 2025-2030 (%)
Data Table on UAE - Year-over-year growth 2025-2030 (%)

12.6.3 South Africa - Market size and forecast 2025-2030

Chart on South Africa - Market size and forecast 2025-2030 ($ million)
Data Table on South Africa - Market size and forecast 2025-2030 ($ million)
Chart on South Africa - Year-over-year growth 2025-2030 (%)
Data Table on South Africa - Year-over-year growth 2025-2030 (%)

12.6.4 Israel - Market size and forecast 2025-2030

Chart on Israel - Market size and forecast 2025-2030 ($ million)
Data Table on Israel - Market size and forecast 2025-2030 ($ million)
Chart on Israel - Year-over-year growth 2025-2030 (%)
Data Table on Israel - Year-over-year growth 2025-2030 (%)

12.6.5 Turkey - Market size and forecast 2025-2030

Chart on Turkey - Market size and forecast 2025-2030 ($ million)
Data Table on Turkey - Market size and forecast 2025-2030 ($ million)
Chart on Turkey - Year-over-year growth 2025-2030 (%)
Data Table on Turkey - Year-over-year growth 2025-2030 (%)

12.7 South America - Market size and forecast 2025-2030

Chart on South America - Market size and forecast 2025-2030 ($ million)
Data Table on South America - Market size and forecast 2025-2030 ($ million)
Chart on South America - Year-over-year growth 2025-2030 (%)
Data Table on South America - Year-over-year growth 2025-2030 (%)
Chart on Regional Comparison - South America
Data Table on Regional Comparison - South America

12.7.1 Brazil - Market size and forecast 2025-2030

Chart on Brazil - Market size and forecast 2025-2030 ($ million)
Data Table on Brazil - Market size and forecast 2025-2030 ($ million)
Chart on Brazil - Year-over-year growth 2025-2030 (%)
Data Table on Brazil - Year-over-year growth 2025-2030 (%)

12.7.2 Argentina - Market size and forecast 2025-2030

Chart on Argentina - Market size and forecast 2025-2030 ($ million)
Data Table on Argentina - Market size and forecast 2025-2030 ($ million)
Chart on Argentina - Year-over-year growth 2025-2030 (%)
Data Table on Argentina - Year-over-year growth 2025-2030 (%)

12.7.3 Chile - Market size and forecast 2025-2030

Chart on Chile - Market size and forecast 2025-2030 ($ million)
Data Table on Chile - Market size and forecast 2025-2030 ($ million)
Chart on Chile - Year-over-year growth 2025-2030 (%)
Data Table on Chile - Year-over-year growth 2025-2030 (%)

12.8 Market opportunity by geography

Market opportunity by geography ($ million)
Data Tables on Market opportunity by geography ($ million)

13. Drivers, Challenges, and Opportunity

13.1 Market drivers

Escalating stringency of environmental regulations and effluent discharge standards
Intensifying global water scarcity and economic imperative for water reuse
Technological advancements and integration of smart automation in treatment infrastructure

13.2 Market challenges

Escalating capital expenditures and extended ROI timelines for advanced zero liquid discharge infrastructure
High operational complexity, energy demands, and shortage of specialized technical labor
Navigating divergent regulatory frameworks and rapidly shifting contaminant compliance thresholds

13.3 Impact of drivers and challenges

Impact of drivers and challenges in 2025 and 2030

13.4 Market opportunities

Widespread proliferation of circular water economies and on-site decentralized resource recovery systems
Digitalization, AI integration, and real-time water footprint optimization
Accelerated deployment of advanced energy-neutral treatment technologies and anaerobic digestion infrastructure

14. Competitive Landscape

14.1 Overview

14.2

Overview on criticality of inputs and factors of differentiation

14.3 Landscape disruption

Overview on factors of disruption

14.4 Industry risks

Impact of key risks on business

15. Competitive Analysis

15.1 Companies profiled

Companies covered

15.2 Company ranking index

15.3 Market positioning of companies

Matrix on companies position and classification

15.4 Alfa Laval AB

Alfa Laval AB - Overview
Alfa Laval AB - Business segments
Alfa Laval AB - Key news
Alfa Laval AB - Key offerings
Alfa Laval AB - Segment focus
SWOT

15.5 Andritz AG

Andritz AG - Overview
Andritz AG - Business segments
Andritz AG - Key news
Andritz AG - Key offerings
Andritz AG - Segment focus
SWOT

15.6 DuPont de Nemours Inc.

DuPont de Nemours Inc. - Overview
DuPont de Nemours Inc. - Business segments
DuPont de Nemours Inc. - Key news
DuPont de Nemours Inc. - Key offerings
DuPont de Nemours Inc. - Segment focus
SWOT

15.7 Ecolab Inc.

Ecolab Inc. - Overview
Ecolab Inc. - Business segments
Ecolab Inc. - Key news
Ecolab Inc. - Key offerings
Ecolab Inc. - Segment focus
SWOT

15.8 Hitachi Ltd.

Hitachi Ltd. - Overview
Hitachi Ltd. - Business segments
Hitachi Ltd. - Key offerings
Hitachi Ltd. - Segment focus
SWOT

15.9 Kurita Water Industries Ltd.

Kurita Water Industries Ltd. - Overview
Kurita Water Industries Ltd. - Business segments
Kurita Water Industries Ltd. - Key offerings
Kurita Water Industries Ltd. - Segment focus
SWOT

15.10 Nijhuis Industries Holding BV

Nijhuis Industries Holding BV - Overview
Nijhuis Industries Holding BV - Product / Service
Nijhuis Industries Holding BV - Key offerings
SWOT

15.11 Ovivo Inc.

Ovivo Inc. - Overview
Ovivo Inc. - Product / Service
Ovivo Inc. - Key offerings
SWOT

15.12 Pall Corp.

Pall Corp. - Overview
Pall Corp. - Product / Service
Pall Corp. - Key offerings
SWOT

15.13 Parkson Corp.

Parkson Corp. - Overview
Parkson Corp. - Product / Service
Parkson Corp. - Key offerings
SWOT

15.14 Pentair Plc

Pentair Plc - Overview
Pentair Plc - Business segments
Pentair Plc - Key news
Pentair Plc - Key offerings
Pentair Plc - Segment focus
SWOT

15.15 Sulzer Ltd.

Sulzer Ltd. - Overview
Sulzer Ltd. - Business segments
Sulzer Ltd. - Key offerings
Sulzer Ltd. - Segment focus
SWOT

15.16 Toshiba Corp.

Toshiba Corp. - Overview
Toshiba Corp. - Product / Service
Toshiba Corp. - Key offerings
SWOT

15.17 Veolia Environment SA

Veolia Environment SA - Overview
Veolia Environment SA - Business segments
Veolia Environment SA - Key news
Veolia Environment SA - Key offerings
Veolia Environment SA - Segment focus
SWOT

15.18 Xylem Inc.

Xylem Inc. - Overview
Xylem Inc. - Business segments
Xylem Inc. - Key news
Xylem Inc. - Key offerings
Xylem Inc. - Segment focus
SWOT

16. Appendix

16.1 Scope of the report

Market definition
Objectives
Notes and caveats

16.2 Inclusions and exclusions checklist

Inclusions checklist
Exclusions checklist

16.3 Currency conversion rates for US$

16.4 Research methodology

16.5 Data procurement

Information sources

16.6 Data validation

16.7 Validation techniques employed for market sizing

16.8 Data synthesis

16.9 360 degree market analysis

16.10 List of abbreviations

Research Methodology

Technavio presents a detailed picture of the market by way of study, synthesis, and summation of data from multiple sources. The analysts have presented the various facets of the market with a particular focus on identifying the key industry influencers. The data thus presented is comprehensive, reliable, and the result of extensive research, both primary and secondary.

INFORMATION SOURCES

Primary sources

  • Manufacturers and suppliers
  • Channel partners
  • Industry experts
  • Strategic decision makers

Secondary sources

  • Industry journals and periodicals
  • Government data
  • Financial reports of key industry players
  • Historical data
  • Press releases

DATA ANALYSIS

Data Synthesis

  • Collation of data
  • Estimation of key figures
  • Analysis of derived insights

Data Validation

  • Triangulation with data models
  • Reference against proprietary databases
  • Corroboration with industry experts

REPORT WRITING

Qualitative

  • Market drivers
  • Market challenges
  • Market trends
  • Five forces analysis

Quantitative

  • Market size and forecast
  • Market segmentation
  • Geographical insights
  • Competitive landscape

Interested in this report?

Get your sample now to see our research methodology and insights!

Download Now

Frequently Asked Questions

Industrial Wastewater Treatment Equipment market growth will increase by USD 7850.6 million during 2026-2030.

The Industrial Wastewater Treatment Equipment market is expected to grow at a CAGR of 7.3% during 2026-2030.

Industrial Wastewater Treatment Equipment market is segmented by End-user (Manufacturing, Energy, Others) Product type (Filtration equipment, Membrane equipment, Thermal distillation equipment and evaporator, Disinfection equipment) Type (Secondary treatment, Primary treatment, Tertiary treatment)

Alfa Laval AB, Andritz AG, Aquatech International LLC, DuPont de Nemours Inc., Ecolab Inc., Grundfos Holding AS, Hitachi Ltd., Koch Industries Inc., Kurita Water Industries Ltd., Lenntech BV, Nijhuis Industries Holding BV, Ovivo Inc., Pall Corp., Parkson Corp., Pentair Plc, Smith and Loveless Inc., SPX FLOW Inc., Sulzer Ltd., Toshiba Corp., Veolia Environment SA, WesTech Engineering LLC, Xylem Inc. are a few of the key vendors in the Industrial Wastewater Treatment Equipment market.

APAC will register the highest growth rate of 47.6% among the other regions. Therefore, the Industrial Wastewater Treatment Equipment market in APAC is expected to garner significant business opportunities for the vendors during the forecast period.

China, Japan, India, South Korea, Australia, Indonesia, US, Canada, Mexico, Germany, UK, France, Italy, Spain, The Netherlands, Saudi Arabia, UAE, South Africa, Israel, Turkey, Brazil, Argentina, Chile

  • Escalating stringency of environmental regulations and effluent discharge standards is the driving factor this market.

The Industrial Wastewater Treatment Equipment market vendors should focus on grabbing business opportunities from the End-user segment as it accounted for the largest market share in the base year.
RIA - Research AI Assistant
Ask RIA
