
Compressed Natural Gas (CNG) Market Size 2025-2029
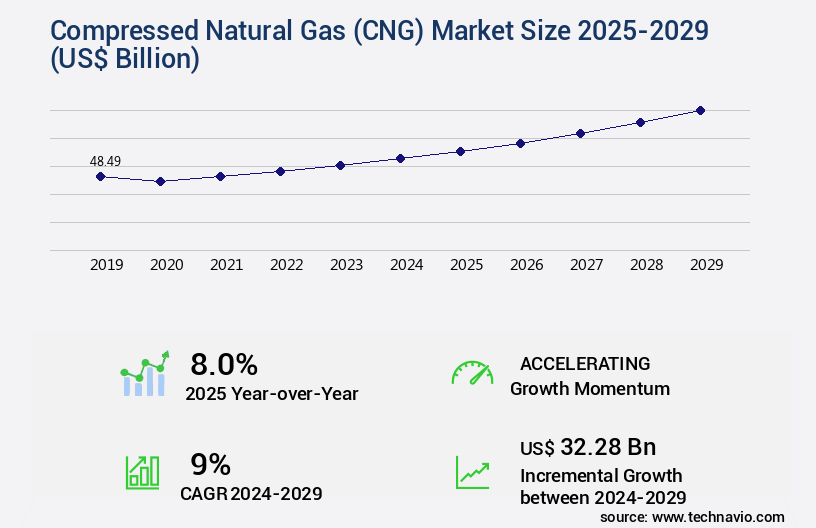
The compressed natural gas (cng) market size is valued to increase by USD 32.28 billion, at a CAGR of 9% from 2024 to 2029. Increase in number of CNG-powered vehicles will drive the compressed natural gas (cng) market.
Market Insights
- APAC dominated the market and accounted for a 52% growth during the 2025-2029.
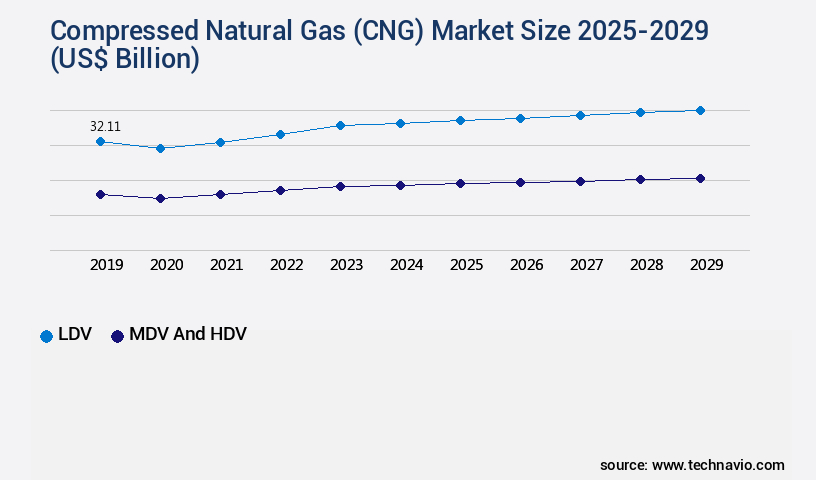
- By Application - LDV segment was valued at USD 32.11 billion in 2023
- By Source - Non associated gas segment accounted for the largest market revenue share in 2023
Market Size & Forecast
- Market Opportunities: USD 90.25 billion
- Market Future Opportunities 2024: USD 32280.00 billion
- CAGR from 2024 to 2029 : 9%
Market Summary
- Compressed Natural Gas (CNG) is an alternative fuel derived from the natural gas industry, characterized by its high energy content and environmental benefits. The global CNG market is driven by several factors, including the increasing number of CNG-powered vehicles and the expansion of CNG refueling infrastructure. The supply of natural gas, a primary feedstock for CNG, is another significant factor influencing market growth. Fluctuation in global oil and gas prices plays a crucial role in the adoption of CNG as a transportation fuel. As oil prices rise, the cost competitiveness of CNG increases, making it an attractive alternative for commercial and industrial fleets.
- For instance, a logistics company may opt for CNG to power its delivery trucks to optimize its fuel costs and reduce operational expenses. Despite the numerous advantages, the CNG market faces challenges, such as limited refueling infrastructure in certain regions and the high upfront cost of CNG vehicles and infrastructure. To mitigate these challenges, governments and private entities are investing in the development of CNG infrastructure and incentives for CNG vehicle adoption. In summary, the CNG market is witnessing steady growth due to the increasing number of CNG-powered vehicles, expanding refueling infrastructure, and favorable economic conditions.
- Companies across various industries, including transportation and logistics, are exploring the use of CNG to improve their operational efficiency and reduce their carbon footprint.
What will be the size of the Compressed Natural Gas (CNG) Market during the forecast period?
Get Key Insights on Market Forecast (PDF) Request Free Sample
- Compressed Natural Gas (CNG) is an increasingly popular sustainable fuel option for transportation, with its market exhibiting continuous evolution. Renewable gas integration is a significant trend in the CNG sector, as companies seek to reduce their carbon footprint and comply with stringent environmental regulations. For instance, pipeline network expansion enables the integration of biomethane, a renewable gas derived from agricultural waste, into the CNG supply chain. Fuel consumption patterns indicate that CNG offers cost-effectiveness advantages over traditional diesel and gasoline. According to data from the US Department of Energy, the average price of CNG is approximately 50% lower than that of gasoline and 30% lower than diesel.
- This cost savings can significantly impact budgeting and product strategy decisions for businesses operating large fleets. Moreover, advancements in fuel dispensing technologies, such as high-pressure CNG compressors and fast-fill stations, enhance operational efficiency improvements. Gas quality monitoring systems ensure consistent fuel quality, while economic feasibility studies and emission reduction targets guide infrastructure development. Safety management systems and regulatory compliance frameworks are essential components of the CNG market, as they ensure network reliability assessment and engine performance metrics meet industry standards. Additionally, hydrogen blending in CNG can improve fuel infrastructure development and energy security implications, making it a promising area for future research.
- In conclusion, the CNG market's dynamic nature offers numerous opportunities for businesses to adapt and innovate, from vehicle refueling infrastructure and engine performance to fuel infrastructure development and environmental impact assessment.
Unpacking the Compressed Natural Gas (CNG) Market Landscape
The compressed natural gas (CNG) market is evolving as stakeholders focus on infrastructure expansion, vehicle performance, and environmental sustainability. CNG pipeline network expansion plans and CNG infrastructure development strategies are essential for supporting increased adoption, while optimizing CNG refueling station layout and implementing safety features CNG fueling stations ensure operational efficiency and user safety. Maintenance schedules CNG vehicles, CNG vehicle engine performance metrics, and CNG vehicle fuel efficiency improvements contribute to maximizing vehicle reliability and reducing operational costs. Comparing CNG and gasoline vehicle costs and conducting cost analysis CNG versus gasoline provides actionable insights for fleet operators and policy planners.
The environmental benefits using CNG, including impact of CNG on air quality, reducing methane emissions CNG systems, and impact of CNG on greenhouse gas emissions, position CNG as a cleaner alternative to conventional fuels. Integration of renewable CNG sources and advancements in CNG storage technology further enhance sustainability and supply resilience. Regulatory compliance for CNG pipelines and safety protocols CNG transportation ensure adherence to safety and legal standards. Life cycle assessment CNG vehicles provides a holistic view of environmental impacts, supporting strategic decision-making and long-term planning for both public and private stakeholders while balancing economic feasibility CNG infrastructure with performance and safety priorities.
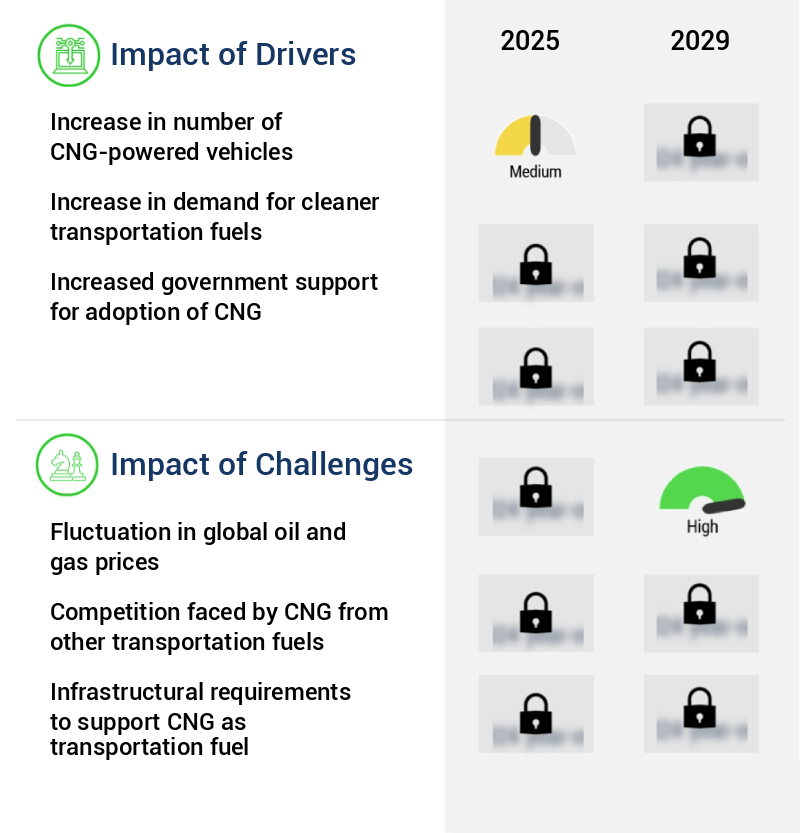
Key Market Drivers Fueling Growth
The significant growth in the adoption of CNG-powered vehicles serves as the primary market catalyst.
- Compressed Natural Gas (CNG) is an evolving market with significant applications across various sectors, most notably in the transportation industry. CNG for automobiles has emerged as an eco-friendly technology, contributing to improved air quality and sustainability, making it an ideal choice for urban environments. Favorable government regulations and CNG infrastructure development have boosted consumer acceptance and cost competitiveness of CNG vehicles. In India, the market is projected to experience substantial growth, with a anticipated increase of 233.33% in CNG vehicles by 2024-2025 compared to 2018, encompassing 10 million fleets consisting of buses, three-wheelers, and passenger vehicles.
- In the United States, cities like Phoenix have adopted CNG technology since 2012, replacing diesel solid waste trucks with CNG counterparts. This transition has led to substantial business outcomes, such as energy use reduction and enhanced sustainability.
Prevailing Industry Trends & Opportunities
The upcoming market trend involves an increase in the supply of natural gas.
- The market is experiencing significant evolution, driven by the growth of unconventional natural gas resources such as tight gas, coalbed methane, and shale gas. This trend is contributing to the rapid expansion of the oil and gas industry, particularly in the unconventional oil and gas resources sector. According to the International Energy Agency (IEA), global natural gas consumption is projected to increase by approximately 10% from 2022 to 2025, reaching 4,370 billion cubic meters (bcm). The successful extraction of shale oil and gas in the US since 2008 has significantly increased the global oil and gas supply, further fueling this growth.
- CNG is gaining popularity across various sectors due to its environmental benefits, including reduced greenhouse gas emissions compared to traditional gasoline and diesel fuels. Additionally, CNG can help businesses reduce fuel costs and improve operational efficiency. For instance, fleet operators have reported fuel cost savings of up to 30% by transitioning to CNG. Furthermore, CNG refueling infrastructure can be installed at a lower cost compared to traditional petroleum infrastructure, making it an attractive alternative fuel option for businesses.
Significant Market Challenges
The volatile nature of global oil and gas prices poses a significant challenge to the industry's growth trajectory.
- The market has experienced significant evolution in recent years, expanding beyond its traditional use in transportation sectors to various industries, including power generation and manufacturing. According to the U.S. Energy Information Administration, CNG consumption in the industrial sector grew by 11% between 2019 and 2020. In the power sector, CNG-fired electricity generation increased by 25% in the same period. These trends are driven by several factors, including the need for cleaner energy sources, price volatility in traditional fuels, and government incentives for renewable and alternative energy use. For instance, in the power sector, CNG-fired power plants offer several advantages, such as lower greenhouse gas emissions, improved fuel efficiency, and cost savings.
- In the industrial sector, CNG is increasingly being used as a fuel for heating and process applications, leading to operational cost reductions of up to 15%. Despite these benefits, the market faces challenges, including the infrastructure required for CNG storage and distribution, which can be expensive to build and maintain. Additionally, the availability and accessibility of CNG sources vary greatly, which can impact the market's growth potential.
In-Depth Market Segmentation: Compressed Natural Gas (CNG) Market
The compressed natural gas (cng) industry research report provides comprehensive data (region-wise segment analysis), with forecasts and estimates in "USD billion" for the period 2025-2029, as well as historical data from 2019-2023 for the following segments.
- Application
- LDV
- MDV and HDV
- Source
- Non associated gas
- Unconventional gas
- Associated gas
- Distribution Channel
- Refueling Stations
- Virtual Pipelines
- Tank Type
- Type 1
- Type 2
- Type 3
- Type 4
- Vehicle Types
- Light-Duty
- Heavy-Duty
- Buses
- Geography
- North America
- US
- Mexico
- Europe
- France
- Italy
- Norway
- Middle East and Africa
- Egypt
- Iran
- Qatar
- UAE
- APAC
- China
- India
- Japan
- South Korea
- South America
- Brazil
- Rest of World (ROW)
- North America
By Application Insights
The ldv segment is estimated to witness significant growth during the forecast period.
The market continues to evolve, offering potential solutions to fuel cost comparisons and emissions compliance standards. With the increasing focus on fuel efficiency gains, CNG's energy density, though lower than gasoline, provides significant advantages for heavy-duty vehicles and fleet operations. Distribution network optimization and virtual pipeline technology enable broader access to CNG, while engine conversion kits cater to various vehicle types. Gas quality specifications ensure consistent performance, and methane leakage detection and reduction technologies minimize environmental impact. CNG price volatility remains a challenge, but advancements in natural gas purification, renewable CNG sources, and pipeline safety regulations contribute to a more stable market.
The US Energy Information Administration (EIA) reports that light-duty vehicles accounted for over 25% of global oil use in 2023, emphasizing the need for alternative fuel vehicles and improved fuel efficiency. CNG infrastructure investment includes gas compressor stations, fueling stations, pressure regulator systems, and vehicle refueling time reduction technologies. Mobile refueling units and onboard CNG storage expand accessibility, while vehicle range extension and fuel dispensing systems cater to diverse user needs. CNG vehicle maintenance and tank capacity inspections ensure long-term reliability and safety.
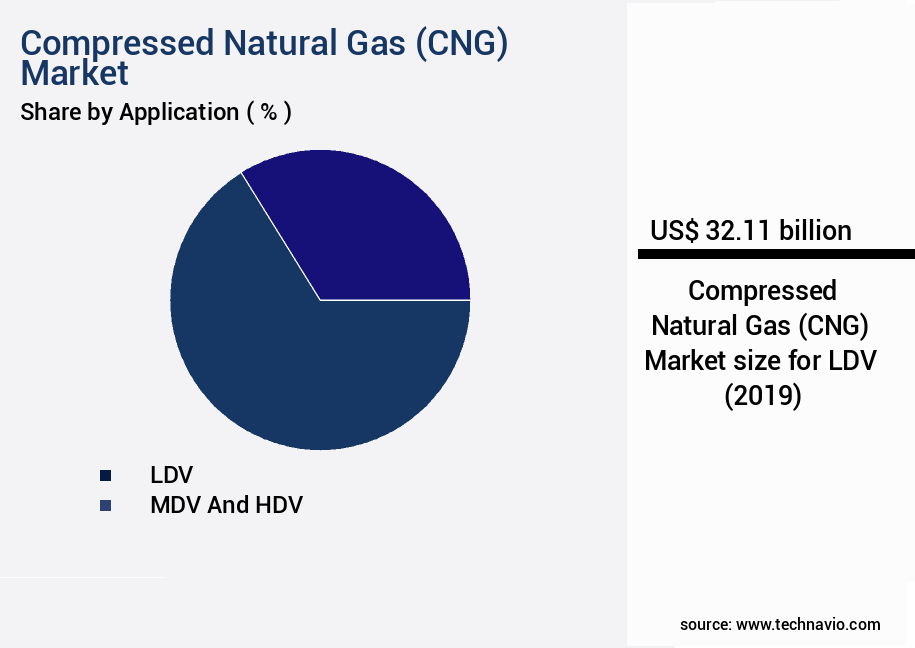
The LDV segment was valued at USD 32.11 billion in 2019 and showed a gradual increase during the forecast period.
Regional Analysis
APAC is estimated to contribute 52% to the growth of the global market during the forecast period.Technavio's analysts have elaborately explained the regional trends and drivers that shape the market during the forecast period.

See How Compressed Natural Gas (CNG) Market Demand is Rising in APAC Request Free Sample
The market in the Asia Pacific (APAC) region is experiencing significant growth, driven by the increasing demand in countries such as Japan, Pakistan, China, South Korea, India, and Taiwan. Pakistan, in particular, is a leading user of CNG worldwide. In China, the demand for CNG is escalating, with the country expected to witness substantial growth during the forecast period. This surge in demand is prompting infrastructure developments, with Zhuzhou, China, having established 15 new CNG fueling stations by early 2025 as part of the Zhuzhou City Gas Development Plan.
The adoption of CNG in the transportation sector is also gaining momentum due to its operational efficiency gains and cost reductions compared to traditional fuel sources. The underlying dynamics include environmental concerns, government initiatives, and the availability of vast natural gas resources in the region.
Customer Landscape of Compressed Natural Gas (CNG) Industry
Competitive Intelligence by Technavio Analysis: Leading Players in the Compressed Natural Gas (CNG) Market
Companies are implementing various strategies, such as strategic alliances, compressed natural gas (cng) market forecast, partnerships, mergers and acquisitions, geographical expansion, and product/service launches, to enhance their presence in the industry.
Bharat Petroleum Corp. Ltd. - This company specializes in the production and distribution of compressed natural gas, including bio-CNG, for heavy goods transportation. They operate biomethane refueling stations, contributing renewable fuel options to the industry. Their commitment to sustainability sets them apart in the transportation sector.
The industry research and growth report includes detailed analyses of the competitive landscape of the market and information about key companies, including:
- Bharat Petroleum Corp. Ltd.
- BP Plc
- Chevron Corp.
- China National Petroleum Corp.
- Clean Energy Fuels Corp.
- CNG Fuels Ltd.
- E.ON SE
- ENGIE SA
- Eni SpA
- Gazprom Nedra LLC
- Gujarat Gas Ltd.
- Indraprastha Gas Ltd.
- Maharashtra Natural Gas Ltd.
- ONTRAS Gastransport GmbH
- OrangeGas BV.
- Shell plc
- Snam SPA
- TotalEnergies SE
- Trillium Transportation Fuels LLC
- VERBIO Vereinigte BioEnergie AG
Qualitative and quantitative analysis of companies has been conducted to help clients understand the wider business environment as well as the strengths and weaknesses of key industry players. Data is qualitatively analyzed to categorize companies as pure play, category-focused, industry-focused, and diversified; it is quantitatively analyzed to categorize companies as dominant, leading, strong, tentative, and weak.
Recent Development and News in Compressed Natural Gas (CNG) Market
- In August 2024, Shell and Volkswagen Group announced a strategic collaboration to accelerate the expansion of CNG refueling infrastructure in Europe. The partnership aimed to install over 450 new CNG stations by 2027, with the first 100 stations expected to be operational by 2025 (Shell press release).
- In November 2024, Air Products and Chemicals, Inc. Announced the acquisition of Airgas, Inc., creating the largest U.S. Supplier of industrial gases and a significant player in the CNG market. The transaction valued at approximately USD13.4 billion was completed in January 2025 (Air Products press release).
- In March 2025, Clean Energy Fuels Corp. Announced the opening of the world's largest CNG station in the United States, located in California. The station, capable of producing 330,000 gallons of renewable CNG daily, is a significant step towards reducing greenhouse gas emissions in the transportation sector (Clean Energy Fuels press release).
- In May 2025, the European Union passed the Alternative Fuels Infrastructure Directive, mandating the installation of at least 1,000 CNG refueling stations in the EU by 2025 and 4,000 stations by 2030 (European Commission press release). This regulatory push is expected to significantly boost the CNG market growth in Europe.
Dive into Technavio's robust research methodology, blending expert interviews, extensive data synthesis, and validated models for unparalleled Compressed Natural Gas (CNG) Market insights. See full methodology.
|
Market Scope |
|
|
Report Coverage |
Details |
|
Page number |
205 |
|
Base year |
2024 |
|
Historic period |
2019-2023 |
|
Forecast period |
2025-2029 |
|
Growth momentum & CAGR |
Accelerate at a CAGR of 9% |
|
Market growth 2025-2029 |
USD 32.28 billion |
|
Market structure |
Fragmented |
|
YoY growth 2024-2025(%) |
8.0 |
|
Key countries |
China, India, Japan, Saudi Arabia, Qatar, US, Iran, Brazil, Egypt, South Korea, UAE, Rest of World (ROW), France, Mexico, Italy, and Norway |
|
Competitive landscape |
Leading Companies, Market Positioning of Companies, Competitive Strategies, and Industry Risks |
Why Choose Technavio for Compressed Natural Gas (CNG) Market Insights?
"Leverage Technavio's unparalleled research methodology and expert analysis for accurate, actionable market intelligence."
Natural gas distribution systems are evolving rapidly, driven by the need for efficient fuel delivery, methane emissions control, and integration with renewable energy sources. CNG refueling infrastructure plays a pivotal role in supporting widespread adoption, with repeated investment in station networks ensuring reliable access for both long-haul CNG transport and local fleet operations. Advanced CNG storage solutions, including high-pressure CNG tank technology and optimized gas compression technology, are enhancing vehicle fuel efficiency while maintaining adherence to strict safety standards.
Fuel system optimization, engine modifications for CNG compatibility, and fuel dispensing technology improvements contribute to lower vehicle operational costs and reduced lifecycle expenses. Regulatory frameworks for CNG adoption, coupled with emissions monitoring programs, reinforce emission reduction strategies and mitigate the environmental impact of CNG use. Moreover, integration with fuel cells and biogas production methods is expanding the role of natural gas in hybrid and renewable energy systems, complementing electric vehicle charging infrastructure. Comparative fuel cost analyses and infrastructure investment planning guide strategic deployment, ensuring that both economic feasibility and environmental considerations are addressed as the CNG ecosystem continues to expand.
What are the Key Data Covered in this Compressed Natural Gas (CNG) Market Research and Growth Report?
-
What is the expected growth of the Compressed Natural Gas (CNG) Market between 2025 and 2029?
-
USD 32.28 billion, at a CAGR of 9%
-
-
What segmentation does the market report cover?
-
The report is segmented by Application (LDV and MDV and HDV), Source (Non associated gas, Unconventional gas, and Associated gas), Geography (APAC, Middle East and Africa, South America, Europe, and North America), Distribution Channel (Refueling Stations and Virtual Pipelines), Tank Type (Type 1, Type 2, Type 3, and Type 4), and Vehicle Types (Light-Duty, Heavy-Duty, and Buses)
-
-
Which regions are analyzed in the report?
-
APAC, Middle East and Africa, South America, Europe, and North America
-
-
What are the key growth drivers and market challenges?
-
Increase in number of CNG-powered vehicles, Fluctuation in global oil and gas prices
-
-
Who are the major players in the Compressed Natural Gas (CNG) Market?
-
Bharat Petroleum Corp. Ltd., BP Plc, Chevron Corp., China National Petroleum Corp., Clean Energy Fuels Corp., CNG Fuels Ltd., E.ON SE, ENGIE SA, Eni SpA, Gazprom Nedra LLC, Gujarat Gas Ltd., Indraprastha Gas Ltd., Maharashtra Natural Gas Ltd., ONTRAS Gastransport GmbH, OrangeGas BV., Shell plc, Snam SPA, TotalEnergies SE, Trillium Transportation Fuels LLC, and VERBIO Vereinigte BioEnergie AG
-
We can help! Our analysts can customize this compressed natural gas (cng) market research report to meet your requirements.
 RIA -
RIA - 
