Biopharmaceutical Analytical Testing Services Market Analysis, Size, and Forecast 2026-2030: North America (US, Canada, and Mexico), Europe (Germany, UK, and France), APAC (China, Japan, and India), South America (Brazil and Argentina), Middle East and Africa (Saudi Arabia, UAE, and South Africa), and Rest of World (ROW)

Biopharmaceutical Analytical Testing Services Market Analysis, Size, and Forecast 2026-2030:
North America (US, Canada, and Mexico), Europe (Germany, UK, and France), APAC (China, Japan, and India), South America (Brazil and Argentina), Middle East and Africa (Saudi Arabia, UAE, and South Africa), and Rest of World (ROW)

Published: May 2026 316 Pages SKU: IRTNTR40457

Market Overview at a Glance

$6.35 B
Market Opportunity
15.5%
CAGR 2025 - 2030
33.3%
North America Growth
$2.03 B
Bioanalytical segment 2024

Biopharmaceutical Analytical Testing Services Market Size 2026-2030

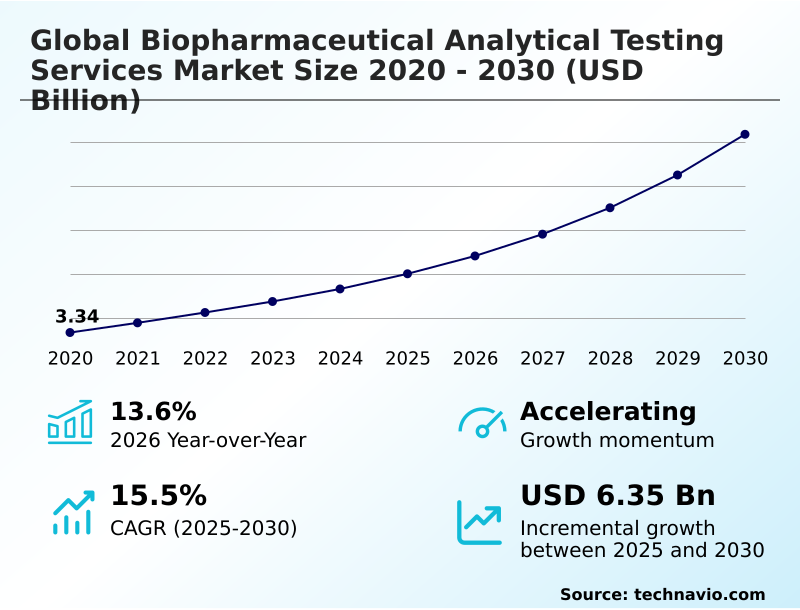
The Biopharmaceutical Analytical Testing Services Market size was valued at USD 6.01 billion in 2025, growing at a CAGR of 15.5% during the forecast period 2026-2030.

Major Market Trends & Insights

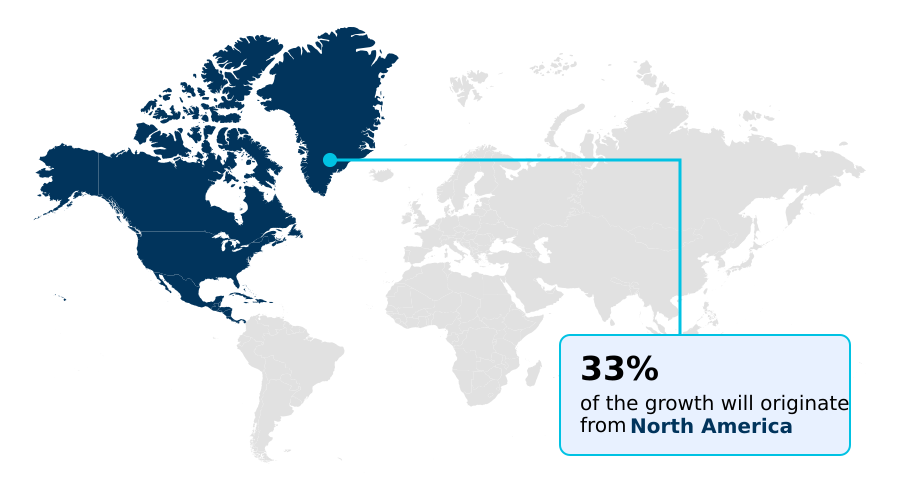
  • North America dominated the market and accounted for a 33.3% growth during the forecast period.
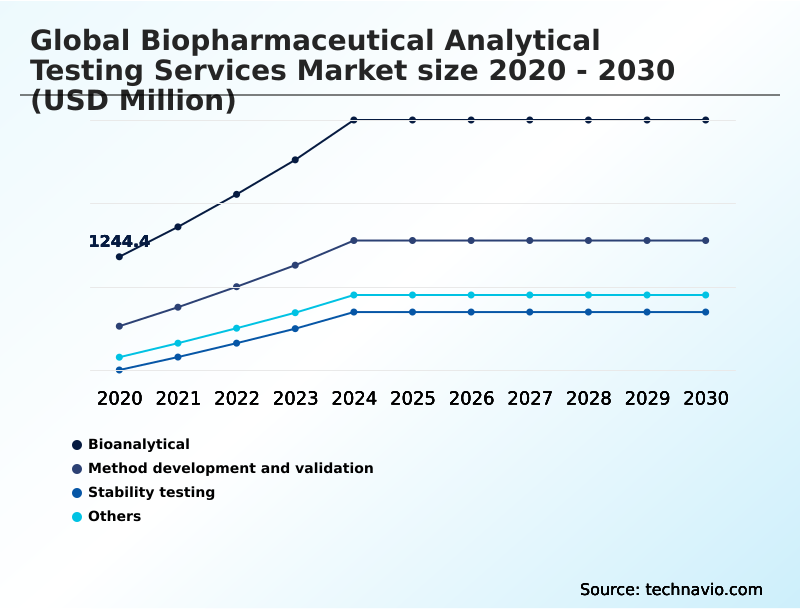
  • By Service - Bioanalytical segment was valued at USD 2.03 billion in 2024
  • By End-user - Pharma and biotech companies segment accounted for the largest market revenue share in 2024

Market Size & Forecast

  • Historic Market Opportunities 2020-2024: USD 9.01 billion
  • Market Future Opportunities 2025-2030: USD 6.35 billion
  • CAGR from 2025 to 2030 : 15.5%

Market Summary

  • The biopharmaceutical analytical testing services market is expanding, with service providers now handling over 60% of all analytical testing for small to mid-sized biotech firms. This growth is propelled by the increasing complexity of biologic drugs, which require sophisticated characterization that many developers cannot support in-house, leading to a 15% year-over-year increase in outsourced stability testing programs.
  • For instance, a typical operational scenario involves a startup outsourcing its entire method development and validation process to a specialized contract research organization (CRO). This strategic move mitigates the need for substantial capital investment in GMP-compliant laboratories and highly skilled personnel, which is a major market driver.
  • However, the industry faces a significant challenge from an acute shortage of scientists with expertise in both advanced instrumentation and regulatory compliance, a factor that can create project bottlenecks and constrain the growth potential of service providers despite high demand.

What will be the Size of the Biopharmaceutical Analytical Testing Services Market during the forecast period?

Get Key Insights on Market Forecast (PDF) Request Free Sample

How is the Biopharmaceutical Analytical Testing Services Market Segmented?

The biopharmaceutical analytical testing services industry research report provides comprehensive data (region-wise segment analysis), with forecasts and analysis for the period 2026-2030, as well as historical data from 2020-2024 for the following segments.

  • Service
    • Bioanalytical
    • Method development and validation
    • Stability testing
    • Others
  • End-user
    • Pharma and biotech companies
    • CROs
  • Type
    • Physiochemical analysis
    • Biological assays
    • Microbial testing
    • Environmental monitoring
  • Geography
    • North America
      • US
      • Canada
      • Mexico
    • Europe
      • Germany
      • UK
      • France
    • APAC
      • China
      • Japan
      • India
    • South America
      • Brazil
      • Argentina
    • Middle East and Africa
      • Saudi Arabia
      • UAE
      • South Africa
    • Rest of World (ROW)

How is the Biopharmaceutical Analytical Testing Services Market Segmented by Service?

The bioanalytical segment is estimated to witness significant growth during the forecast period.

The market is segmented by service type, with bioanalytical solutions representing over 38% of revenue. This segment provides quantitative measurement of drugs using techniques like ligand-binding assays (LBA) for pharmacokinetics (PK) analysis, which improves trial success by over 15%.

Method development and validation focuses on creating robust procedures, including stability-indicating methods and applying analytical quality by design (aQbD) principles. Another critical segment is stability testing. Other services include essential lot release testing and raw material qualification.

This segmentation dictates operational focus; providers must offer everything from good laboratory practice (GLP) compliant bioanalysis and anti-drug antibody (ada) testing to GMP-certified sterility testing to meet diverse client needs across the development pipeline.

Request Free Sample

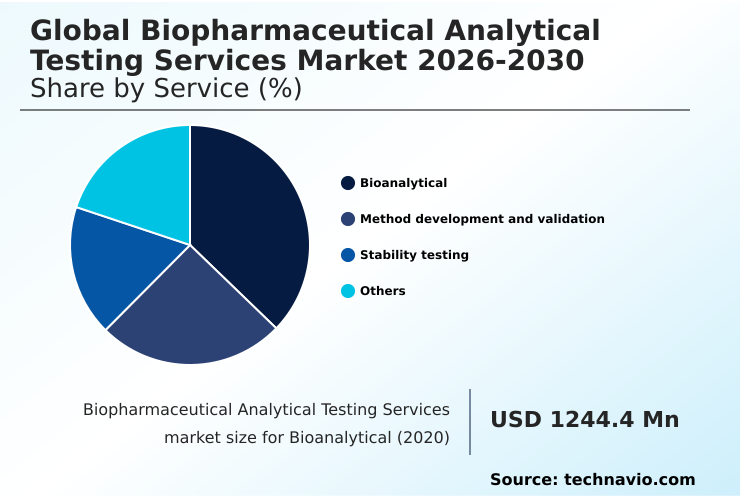
The Bioanalytical segment was valued at USD 2.03 billion in 2024 and showed a gradual increase during the forecast period.

Request Free Sample

How demand for the Biopharmaceutical Analytical Testing Services market is rising in the leading region?

North America is estimated to contribute 33.3% to the growth of the global market during the forecast period.Technavio’s analysts have elaborately explained the regional trends and drivers that shape the market during the forecast period.

See How Biopharmaceutical Analytical Testing Services Market demand is rising in North America Request Free Sample

The geographic landscape of the biopharmaceutical analytical testing services market is led by North America, which is projected to capture 33.3% of the market's incremental growth.

This dominance is sustained by the United States, which accounts for over 84% of the regional market and is home to the world's highest concentration of biopharmaceutical R&D activities.

In contrast, the APAC region is the fastest-growing market, with a CAGR of 16.0%, slightly outpacing North America's 15.8% CAGR.

This rapid expansion in APAC is driven by significant government investment in countries like China and South Korea, which are becoming major hubs for biosimilarity assessment and contract manufacturing.

The differing dynamics affect supply chains; North American providers focus on early-stage, complex physicochemical characterization, whereas APAC labs often scale for high-volume lot release testing and comparability studies, offering up to a 20% cost advantage for certain standardized assays.

What are the key Drivers, Trends, and Challenges in the Biopharmaceutical Analytical Testing Services Market?

Our researchers analyzed the data with 2025 as the base year, along with the key drivers, trends, and challenges. A holistic analysis of drivers will help companies refine their marketing strategies to gain a competitive advantage.

  • Navigating the complexities of biopharmaceutical development requires specialized analytical support, particularly for next-generation therapeutics. Companies are increasingly seeking comprehensive gmp analytical services for cell therapy, which demand unique potency and characterization assays that differ significantly from traditional biologics.
  • The use of mass spectrometry for monoclonal antibody characterization is now a cornerstone of development, providing deep insights into critical quality attributes that older techniques cannot resolve. This detailed analysis is vital for regulatory submissions and for establishing robust manufacturing processes.
  • Many emerging companies find that outsourcing hplc method development and validation is a more efficient strategy, reducing internal capital expenditure by over 30% compared to building in-house capabilities. This approach also provides access to expertise in navigating the intricate ich guidelines for stability testing of biologics, ensuring that long-term data packages are compliant and reliable.
  • As clinical programs advance, the reliance on specialized bioanalytical lab services for clinical trials becomes critical for generating the pharmacokinetic and immunogenicity data needed for regulatory approval, with top-tier labs demonstrating a 99% data acceptance rate by agencies.
  • This strategic outsourcing model allows drug developers to focus on their core competencies while de-risking the complex analytical and regulatory pathway to market.

What are the key market drivers leading to the rise in the adoption of Biopharmaceutical Analytical Testing Services Industry?

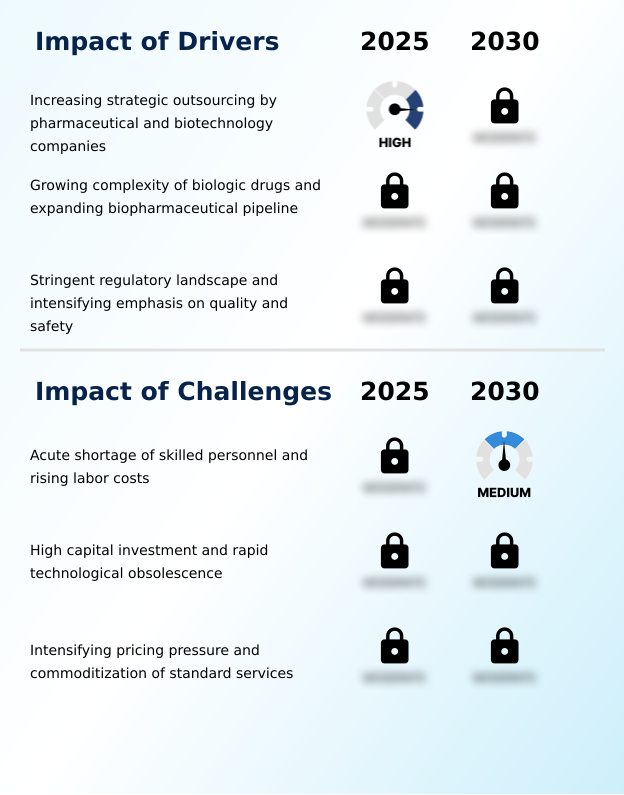
  • The increasing adoption of strategic outsourcing by pharmaceutical and biotechnology companies is a primary driver propelling market growth.

  • The growing complexity of the biopharmaceutical pipeline is a primary market driver, with modern biologics requiring an arsenal of sophisticated techniques like high-performance liquid chromatography (hplc) and capillary electrophoresis for characterization.
  • The rise of advanced therapies has created demand for entirely new analytical paradigms, such as those for adeno-associated virus (aav) analytics and mRNA vaccine analytics.
  • Strategic outsourcing is another key driver, as it converts significant capital expenses into manageable operational costs, allowing a startup to save over 40% on initial lab setup.
  • This model also provides immediate access to specialized expertise in areas like cell-based potency assays and host cell protein (hcp) analysis.
  • The stringent regulatory landscape, demanding adherence to good manufacturing practices (gmp) and ICH Q6B guidelines, further compels developers to partner with compliant service providers.

What are the market trends shaping the Biopharmaceutical Analytical Testing Services Industry?

  • A significant market trend is the intensifying focus on analytical services designed for advanced therapy medicinal products (ATMPs). This shift reflects the growing complexity of biopharmaceutical pipelines.

  • A defining trend is the integration of advanced analytical technologies, with the multi-attribute method (MAM) improving efficiency by replacing up to five traditional QC tests with a single mass spectrometry (ms) run. This shift enables more comprehensive physicochemical characterization and post-translational modification (ptm) analysis on a routine basis.
  • The adoption of process analytical technology (pat) is also growing, allowing for real-time monitoring and control, which reduces batch failure rates by 10%. This trend is driven by regulatory encouragement for deeper process understanding and the need to manage the complexity of novel biologics.
  • Consequently, service providers are investing heavily in high-resolution instrumentation and data analytics platforms to offer more sophisticated services, including advanced CAR-T cell characterization and oligonucleotide analysis, moving beyond simple testing to become data interpretation partners.

What challenges does the Biopharmaceutical Analytical Testing Services Industry face during its growth?

  • An acute shortage of skilled personnel, compounded by rising labor costs, presents a key challenge affecting industry growth.

  • A formidable challenge is the shortage of skilled scientists, inflating labor costs by up to 20% in competitive biotech hubs and creating bottlenecks for complex tasks like method transfer validation. This scarcity impacts a provider's ability to perform a thorough immunogenicity risk assessment.
  • The high capital investment in technology is another hurdle; rapid obsolescence means a cutting-edge instrument's value can diminish by over 50% in five years. This cycle pressures firms to constantly reinvest. Additionally, pricing pressure commoditizes routine services like bioburden testing and endotoxin testing (LAL).
  • This forces providers to balance efficiency investments for standard assays against the high cost of innovation required for specialized services like extractables and leachables (e&l) testing and comparability studies, squeezing overall profit margins.

Exclusive Technavio Analysis on Customer Landscape

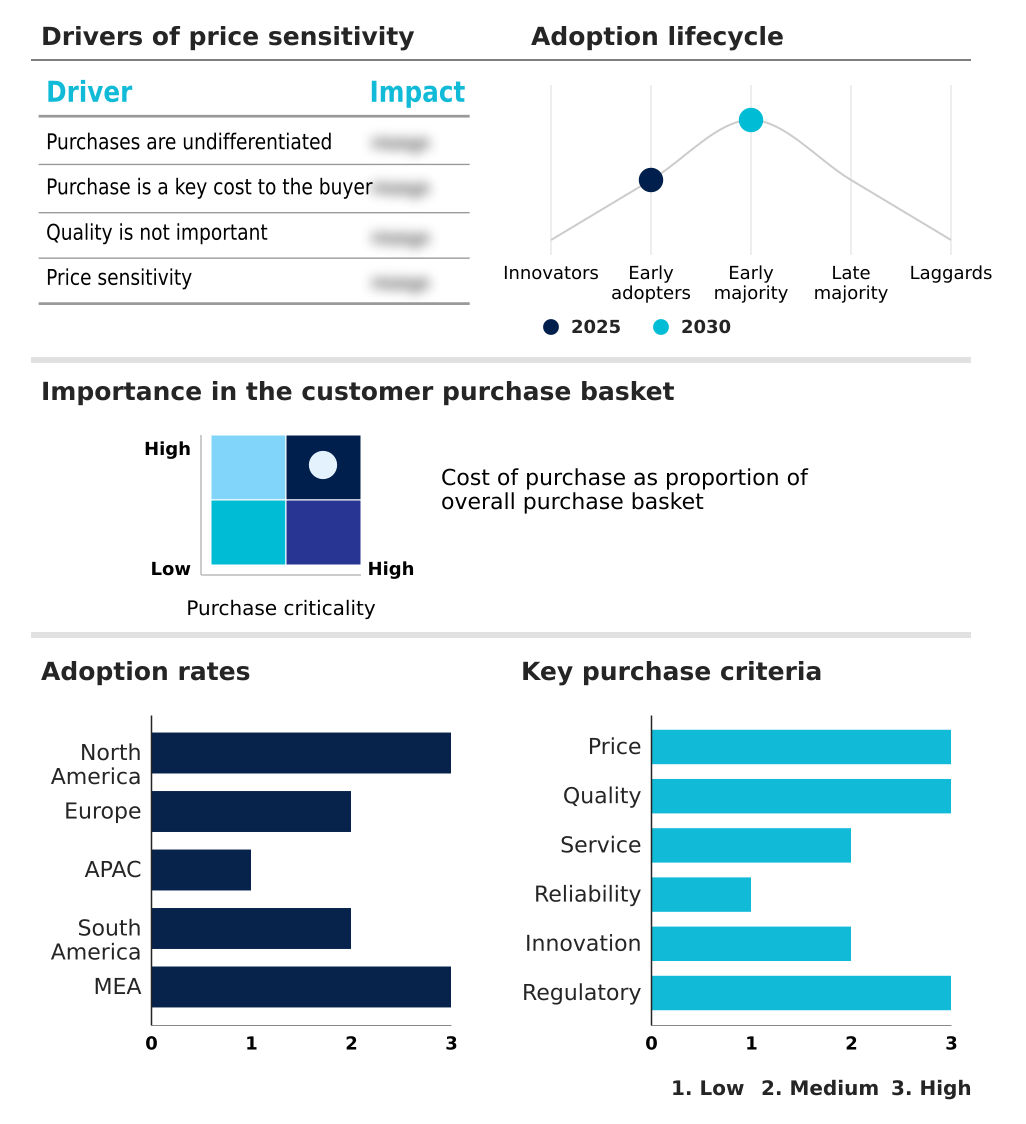
The biopharmaceutical analytical testing services market forecasting report includes the adoption lifecycle of the market, covering from the innovator’s stage to the laggard’s stage. It focuses on adoption rates in different regions based on penetration. Furthermore, the biopharmaceutical analytical testing services market report also includes key purchase criteria and drivers of price sensitivity to help companies evaluate and develop their market growth analysis strategies.

Customer Landscape of Biopharmaceutical Analytical Testing Services Industry

Competitive Landscape

Companies are implementing various strategies, such as strategic alliances, biopharmaceutical analytical testing services market forecast, partnerships, mergers and acquisitions, geographical expansion, and product/service launches, to enhance their presence in the industry.

Almac Group Ltd. - Specializing in biopharmaceutical analytics, services include comprehensive method development and validation for drug substances and products, supporting all phases of the development lifecycle.

The industry research and growth report includes detailed analyses of the competitive landscape of the market and information about key companies, including:

  • Almac Group Ltd.
  • Catalent Inc.
  • Charles River Laboratories
  • Element Materials Tech.
  • Eurofins Scientific SE
  • ICON plc
  • Intertek Group Plc
  • IQVIA Holdings Inc.
  • Laboratory Corp.
  • Lonza Group Ltd.
  • Merck KGaA
  • Parexel International Corp.
  • Sartorius AG
  • SGS SA
  • Syneos Health
  • Thermo Fisher Scientific Inc.
  • WuXi AppTec Co. Ltd.

Qualitative and quantitative analysis of companies has been conducted to help clients understand the wider business environment as well as the strengths and weaknesses of key industry players. Data is qualitatively analyzed to categorize companies as pure play, category-focused, industry-focused, and diversified; it is quantitatively analyzed to categorize companies as dominant, leading, strong, tentative, and weak.

Market Intelligence Radar: High-Impact Developments & Growth Signals

  • In the Life Sciences Tools and Services industry, the push for greater data integrity compliance, driven by stricter enforcement of 21 CFR Part 11, has increased the demand for validated analytical software and systems in the global biopharmaceutical analytical testing services market 2026-2030, impacting CMC regulatory submission strategies.
  • The broader industry's adoption of real-time release testing (RTRT) methodologies is creating new opportunities for service providers that can offer advanced process analytical technology (PAT) and integrated data analytics, directly influencing approaches to in-process control (IPC) testing.
  • A notable shift toward domestic biomanufacturing in key markets has intensified the need for local and responsive lot release testing and raw material qualification, altering supply chain dynamics for contract labs.
  • The increasing investment in advanced therapeutic modalities like mRNA vaccine analytics and oligonucleotide analysis at the parent market level is mandating specialized analytical capabilities, such as adeno-associated virus (AAV) analytics, for biopharmaceutical testing partners.

Dive into Technavio’s robust research methodology, blending expert interviews, extensive data synthesis, and validated models for unparalleled Biopharmaceutical Analytical Testing Services Market insights. See full methodology.

Market Scope
Page number 316
Base year 2025
Historic period 2020-2024
Forecast period 2026-2030
Growth momentum & CAGR Accelerate at a CAGR of 15.5%
Market growth 2026-2030 USD 6347.3 million
Market structure Fragmented
YoY growth 2025-2026(%) 13.6%
Key countries US, Canada, Mexico, Germany, UK, France, Italy, Spain, The Netherlands, China, Japan, India, South Korea, Australia, Indonesia, Brazil, Argentina, Chile, Saudi Arabia, UAE, South Africa, Israel and Turkey
Competitive landscape Leading Companies, Market Positioning of Companies, Competitive Strategies, and Industry Risks

Request Free Sample

Research Analyst Overview

  • The biopharmaceutical analytical testing services ecosystem is a complex network where instrument manufacturers supply high-resolution mass spectrometers and chromatography systems, representing up to 40% of a laboratory's initial capital expenditure. Service providers, from global CROs to niche labs, leverage this technology to offer a range of services from early-stage physicochemical characterization to late-stage lot release testing.
  • Their operations are strictly governed by regulatory bodies that mandate adherence to GMP and GLP standards, with audit failure rates below 2%. End-users, primarily pharma and biotech companies, outsource these services to accelerate development and mitigate risk. This interaction highlights a value chain where access to specialized technology and regulatory expertise is paramount.
  • Supporting entities, including logistics providers specializing in cold-chain sample transport and software companies offering 21 CFR part 11 compliant data management systems, are integral to maintaining the integrity and efficiency of the entire process.

What are the Key Data Covered in this Biopharmaceutical Analytical Testing Services Market Research and Growth Report?

  • What is the expected growth of the Biopharmaceutical Analytical Testing Services Market between 2026 and 2030?

    • The Biopharmaceutical Analytical Testing Services Market is expected to grow by USD 6.35 billion during 2026-2030, registering a CAGR of 15.5%. Year-over-year growth in 2026 is estimated at 13.6%%. This acceleration is shaped by increasing strategic outsourcing by pharmaceutical and biotechnology companies, which is intensifying demand across multiple end-use verticals covered in the report.

  • What segmentation does the market report cover?

    • The report is segmented by Service (Bioanalytical, Method development and validation, Stability testing, and Others), End-user (Pharma and biotech companies, and CROs), Type (Physiochemical analysis, Biological assays, Microbial testing, and Environmental monitoring) and Geography (North America, Europe, APAC, South America, Middle East and Africa). Among these, the Bioanalytical segment is estimated to witness significant growth during the forecast period, driven by rising adoption across key application areas. Each segment includes detailed qualitative and quantitative analysis, along with historical data from 2020-2024 and forecasts through 2030 with year-over-year growth rates.

  • Which regions are analyzed in the report?

    • The report covers North America, Europe, APAC, South America and Middle East and Africa. North America is estimated to contribute 33.3% to market growth during the forecast period. Country-level analysis includes US, Canada, Mexico, Germany, UK, France, Italy, Spain, The Netherlands, China, Japan, India, South Korea, Australia, Indonesia, Brazil, Argentina, Chile, Saudi Arabia, UAE, South Africa, Israel and Turkey, with dedicated market size tables and year-over-year growth for each.

  • What are the key growth drivers and market challenges?

    • The primary driver is increasing strategic outsourcing by pharmaceutical and biotechnology companies, which is accelerating investment and industry demand. The main challenge is acute shortage of skilled personnel and rising labor costs, creating operational barriers for key market participants. The report quantifies the impact of each driver and challenge across 2026 and 2030 with comparative analysis.

  • Who are the major players in the Biopharmaceutical Analytical Testing Services Market?

    • Key vendors include Almac Group Ltd., Catalent Inc., Charles River Laboratories, Element Materials Tech., Eurofins Scientific SE, ICON plc, Intertek Group Plc, IQVIA Holdings Inc., Laboratory Corp., Lonza Group Ltd., Merck KGaA, Parexel International Corp., Sartorius AG, SGS SA, Syneos Health, Thermo Fisher Scientific Inc. and WuXi AppTec Co. Ltd.. The report provides qualitative and quantitative analysis categorizing companies as dominant, leading, strong, tentative, and weak based on their market positioning. Company profiles include business segment analysis, SWOT assessment, key offerings, and recent strategic developments.

Market Research Insights

  • The competitive landscape for biopharmaceutical analytical testing services is moderately fragmented, with the top ten providers accounting for less than 45% of the market share. This structure fosters a dynamic environment where leading contract research organizations continuously expand their capabilities.
  • Recent strategic moves include acquisitions to enhance expertise in high-growth areas such as cell and gene therapy analytics, with some transactions valued at over 1.5 times the target's annual revenue. These investments are a direct response to the industry's demand for integrated service offerings that combine manufacturing support with comprehensive analytical packages.
  • This trend towards strategic partnerships is reshaping client relationships. However, providers face intensifying pricing pressure for commoditized services, forcing them to focus on operational efficiency and differentiation through specialized, high-value testing for novel modalities.

We can help! Our analysts can customize this biopharmaceutical analytical testing services market research report to meet your requirements.

Get in touch

1. Executive Summary

1.1 Market overview

Executive Summary - Chart on Market Overview
Executive Summary - Data Table on Market Overview
Executive Summary - Chart on Global Market Characteristics
Executive Summary - Chart on Market by Geography
Executive Summary - Chart on Market Segmentation by Service
Executive Summary - Chart on Market Segmentation by End-user
Executive Summary - Chart on Market Segmentation by Type
Executive Summary - Chart on Incremental Growth
Executive Summary - Data Table on Incremental Growth
Executive Summary - Chart on Company Market Positioning

2. Technavio Analysis

2.1 Analysis of price sensitivity, lifecycle, customer purchase basket, adoption rates, and purchase criteria

2.2 Criticality of inputs and Factors of differentiation

Chart on Overview on criticality of inputs and factors of differentiation

2.3 Factors of disruption

Chart on Overview on factors of disruption

2.4 Impact of drivers and challenges

Chart on Impact of drivers and challenges in 2025 and 2030

3. Market Landscape

3.1 Market ecosystem

Chart on Parent Market
Data Table on - Parent Market

3.2 Market characteristics

Chart on Market characteristics analysis

3.3 Value chain analysis

Chart on Value chain analysis

4. Market Sizing

4.1 Market definition

Data Table on Offerings of companies included in the market definition

4.2 Market segment analysis

Market segments

4.3 Market size 2025

4.4 Market outlook: Forecast for 2025-2030

Chart on Global - Market size and forecast 2025-2030 ($ million)
Data Table on Global - Market size and forecast 2025-2030 ($ million)
Chart on Global Market: Year-over-year growth 2025-2030 (%)
Data Table on Global Market: Year-over-year growth 2025-2030 (%)

5. Historic Market Size

5.1 Global Biopharmaceutical Analytical Testing Services Market 2020 - 2024

Historic Market Size - Data Table on Global Biopharmaceutical Analytical Testing Services Market 2020 - 2024 ($ million)

5.2 Service segment analysis 2020 - 2024

Historic Market Size - Service Segment 2020 - 2024 ($ million)

5.3 End-user segment analysis 2020 - 2024

Historic Market Size - End-user Segment 2020 - 2024 ($ million)

5.4 Type segment analysis 2020 - 2024

Historic Market Size - Type Segment 2020 - 2024 ($ million)

5.5 Geography segment analysis 2020 - 2024

Historic Market Size - Geography Segment 2020 - 2024 ($ million)

5.6 Country segment analysis 2020 - 2024

Historic Market Size - Country Segment 2020 - 2024 ($ million)

6. Qualitative Analysis

6.1 The AI impact on global biopharmaceutical analytical testing services market

7. Five Forces Analysis

7.1 Five forces summary

Five forces analysis - Comparison between 2025 and 2030

7.2 Bargaining power of buyers

Bargaining power of buyers - Impact of key factors 2025 and 2030

7.3 Bargaining power of suppliers

Bargaining power of suppliers - Impact of key factors in 2025 and 2030

7.4 Threat of new entrants

Threat of new entrants - Impact of key factors in 2025 and 2030

7.5 Threat of substitutes

Threat of substitutes - Impact of key factors in 2025 and 2030

7.6 Threat of rivalry

Threat of rivalry - Impact of key factors in 2025 and 2030

7.7 Market condition

Chart on Market condition - Five forces 2025 and 2030

8. Market Segmentation by Service

8.1 Market segments

Chart on Service - Market share 2025-2030 (%)
Data Table on Service - Market share 2025-2030 (%)

8.2 Comparison by Service

Chart on Comparison by Service
Data Table on Comparison by Service

8.3 Bioanalytical - Market size and forecast 2025-2030

Chart on Bioanalytical - Market size and forecast 2025-2030 ($ million)
Data Table on Bioanalytical - Market size and forecast 2025-2030 ($ million)
Chart on Bioanalytical - Year-over-year growth 2025-2030 (%)
Data Table on Bioanalytical - Year-over-year growth 2025-2030 (%)

8.4 Method development and validation - Market size and forecast 2025-2030

Chart on Method development and validation - Market size and forecast 2025-2030 ($ million)
Data Table on Method development and validation - Market size and forecast 2025-2030 ($ million)
Chart on Method development and validation - Year-over-year growth 2025-2030 (%)
Data Table on Method development and validation - Year-over-year growth 2025-2030 (%)

8.5 Stability testing - Market size and forecast 2025-2030

Chart on Stability testing - Market size and forecast 2025-2030 ($ million)
Data Table on Stability testing - Market size and forecast 2025-2030 ($ million)
Chart on Stability testing - Year-over-year growth 2025-2030 (%)
Data Table on Stability testing - Year-over-year growth 2025-2030 (%)

8.6 Others - Market size and forecast 2025-2030

Chart on Others - Market size and forecast 2025-2030 ($ million)
Data Table on Others - Market size and forecast 2025-2030 ($ million)
Chart on Others - Year-over-year growth 2025-2030 (%)
Data Table on Others - Year-over-year growth 2025-2030 (%)

8.7 Market opportunity by Service

Market opportunity by Service ($ million)
Data Table on Market opportunity by Service ($ million)

9. Market Segmentation by End-user

9.1 Market segments

Chart on End-user - Market share 2025-2030 (%)
Data Table on End-user - Market share 2025-2030 (%)

9.2 Comparison by End-user

Chart on Comparison by End-user
Data Table on Comparison by End-user

9.3 Pharma and biotech companies - Market size and forecast 2025-2030

Chart on Pharma and biotech companies - Market size and forecast 2025-2030 ($ million)
Data Table on Pharma and biotech companies - Market size and forecast 2025-2030 ($ million)
Chart on Pharma and biotech companies - Year-over-year growth 2025-2030 (%)
Data Table on Pharma and biotech companies - Year-over-year growth 2025-2030 (%)

9.4 CROs - Market size and forecast 2025-2030

Chart on CROs - Market size and forecast 2025-2030 ($ million)
Data Table on CROs - Market size and forecast 2025-2030 ($ million)
Chart on CROs - Year-over-year growth 2025-2030 (%)
Data Table on CROs - Year-over-year growth 2025-2030 (%)

9.5 Market opportunity by End-user

Market opportunity by End-user ($ million)
Data Table on Market opportunity by End-user ($ million)

10. Market Segmentation by Type

10.1 Market segments

Chart on Type - Market share 2025-2030 (%)
Data Table on Type - Market share 2025-2030 (%)

10.2 Comparison by Type

Chart on Comparison by Type
Data Table on Comparison by Type

10.3 Physiochemical analysis - Market size and forecast 2025-2030

Chart on Physiochemical analysis - Market size and forecast 2025-2030 ($ million)
Data Table on Physiochemical analysis - Market size and forecast 2025-2030 ($ million)
Chart on Physiochemical analysis - Year-over-year growth 2025-2030 (%)
Data Table on Physiochemical analysis - Year-over-year growth 2025-2030 (%)

10.4 Biological assays - Market size and forecast 2025-2030

Chart on Biological assays - Market size and forecast 2025-2030 ($ million)
Data Table on Biological assays - Market size and forecast 2025-2030 ($ million)
Chart on Biological assays - Year-over-year growth 2025-2030 (%)
Data Table on Biological assays - Year-over-year growth 2025-2030 (%)

10.5 Microbial testing - Market size and forecast 2025-2030

Chart on Microbial testing - Market size and forecast 2025-2030 ($ million)
Data Table on Microbial testing - Market size and forecast 2025-2030 ($ million)
Chart on Microbial testing - Year-over-year growth 2025-2030 (%)
Data Table on Microbial testing - Year-over-year growth 2025-2030 (%)

10.6 Environmental monitoring - Market size and forecast 2025-2030

Chart on Environmental monitoring - Market size and forecast 2025-2030 ($ million)
Data Table on Environmental monitoring - Market size and forecast 2025-2030 ($ million)
Chart on Environmental monitoring - Year-over-year growth 2025-2030 (%)
Data Table on Environmental monitoring - Year-over-year growth 2025-2030 (%)

10.7 Market opportunity by Type

Market opportunity by Type ($ million)
Data Table on Market opportunity by Type ($ million)

11. Customer Landscape

11.1 Customer landscape overview

Analysis of price sensitivity, lifecycle, customer purchase basket, adoption rates, and purchase criteria

12. Geographic Landscape

12.1 Geographic segmentation

Chart on Market share by geography 2025-2030 (%)
Data Table on Market share by geography 2025-2030 (%)

12.2 Geographic comparison

Chart on Geographic comparison
Data Table on Geographic comparison

12.3 North America - Market size and forecast 2025-2030

Chart on North America - Market size and forecast 2025-2030 ($ million)
Data Table on North America - Market size and forecast 2025-2030 ($ million)
Chart on North America - Year-over-year growth 2025-2030 (%)
Data Table on North America - Year-over-year growth 2025-2030 (%)
Chart on Regional Comparison - North America
Data Table on Regional Comparison - North America

12.3.1 US - Market size and forecast 2025-2030

Chart on US - Market size and forecast 2025-2030 ($ million)
Data Table on US - Market size and forecast 2025-2030 ($ million)
Chart on US - Year-over-year growth 2025-2030 (%)
Data Table on US - Year-over-year growth 2025-2030 (%)

12.3.2 Canada - Market size and forecast 2025-2030

Chart on Canada - Market size and forecast 2025-2030 ($ million)
Data Table on Canada - Market size and forecast 2025-2030 ($ million)
Chart on Canada - Year-over-year growth 2025-2030 (%)
Data Table on Canada - Year-over-year growth 2025-2030 (%)

12.3.3 Mexico - Market size and forecast 2025-2030

Chart on Mexico - Market size and forecast 2025-2030 ($ million)
Data Table on Mexico - Market size and forecast 2025-2030 ($ million)
Chart on Mexico - Year-over-year growth 2025-2030 (%)
Data Table on Mexico - Year-over-year growth 2025-2030 (%)

12.4 Europe - Market size and forecast 2025-2030

Chart on Europe - Market size and forecast 2025-2030 ($ million)
Data Table on Europe - Market size and forecast 2025-2030 ($ million)
Chart on Europe - Year-over-year growth 2025-2030 (%)
Data Table on Europe - Year-over-year growth 2025-2030 (%)
Chart on Regional Comparison - Europe
Data Table on Regional Comparison - Europe

12.4.1 Germany - Market size and forecast 2025-2030

Chart on Germany - Market size and forecast 2025-2030 ($ million)
Data Table on Germany - Market size and forecast 2025-2030 ($ million)
Chart on Germany - Year-over-year growth 2025-2030 (%)
Data Table on Germany - Year-over-year growth 2025-2030 (%)

12.4.2 UK - Market size and forecast 2025-2030

Chart on UK - Market size and forecast 2025-2030 ($ million)
Data Table on UK - Market size and forecast 2025-2030 ($ million)
Chart on UK - Year-over-year growth 2025-2030 (%)
Data Table on UK - Year-over-year growth 2025-2030 (%)

12.4.3 France - Market size and forecast 2025-2030

Chart on France - Market size and forecast 2025-2030 ($ million)
Data Table on France - Market size and forecast 2025-2030 ($ million)
Chart on France - Year-over-year growth 2025-2030 (%)
Data Table on France - Year-over-year growth 2025-2030 (%)

12.4.4 Italy - Market size and forecast 2025-2030

Chart on Italy - Market size and forecast 2025-2030 ($ million)
Data Table on Italy - Market size and forecast 2025-2030 ($ million)
Chart on Italy - Year-over-year growth 2025-2030 (%)
Data Table on Italy - Year-over-year growth 2025-2030 (%)

12.4.5 Spain - Market size and forecast 2025-2030

Chart on Spain - Market size and forecast 2025-2030 ($ million)
Data Table on Spain - Market size and forecast 2025-2030 ($ million)
Chart on Spain - Year-over-year growth 2025-2030 (%)
Data Table on Spain - Year-over-year growth 2025-2030 (%)

12.4.6 The Netherlands - Market size and forecast 2025-2030

Chart on The Netherlands - Market size and forecast 2025-2030 ($ million)
Data Table on The Netherlands - Market size and forecast 2025-2030 ($ million)
Chart on The Netherlands - Year-over-year growth 2025-2030 (%)
Data Table on The Netherlands - Year-over-year growth 2025-2030 (%)

12.5 APAC - Market size and forecast 2025-2030

Chart on APAC - Market size and forecast 2025-2030 ($ million)
Data Table on APAC - Market size and forecast 2025-2030 ($ million)
Chart on APAC - Year-over-year growth 2025-2030 (%)
Data Table on APAC - Year-over-year growth 2025-2030 (%)
Chart on Regional Comparison - APAC
Data Table on Regional Comparison - APAC

12.5.1 China - Market size and forecast 2025-2030

Chart on China - Market size and forecast 2025-2030 ($ million)
Data Table on China - Market size and forecast 2025-2030 ($ million)
Chart on China - Year-over-year growth 2025-2030 (%)
Data Table on China - Year-over-year growth 2025-2030 (%)

12.5.2 Japan - Market size and forecast 2025-2030

Chart on Japan - Market size and forecast 2025-2030 ($ million)
Data Table on Japan - Market size and forecast 2025-2030 ($ million)
Chart on Japan - Year-over-year growth 2025-2030 (%)
Data Table on Japan - Year-over-year growth 2025-2030 (%)

12.5.3 India - Market size and forecast 2025-2030

Chart on India - Market size and forecast 2025-2030 ($ million)
Data Table on India - Market size and forecast 2025-2030 ($ million)
Chart on India - Year-over-year growth 2025-2030 (%)
Data Table on India - Year-over-year growth 2025-2030 (%)

12.5.4 South Korea - Market size and forecast 2025-2030

Chart on South Korea - Market size and forecast 2025-2030 ($ million)
Data Table on South Korea - Market size and forecast 2025-2030 ($ million)
Chart on South Korea - Year-over-year growth 2025-2030 (%)
Data Table on South Korea - Year-over-year growth 2025-2030 (%)

12.5.5 Australia - Market size and forecast 2025-2030

Chart on Australia - Market size and forecast 2025-2030 ($ million)
Data Table on Australia - Market size and forecast 2025-2030 ($ million)
Chart on Australia - Year-over-year growth 2025-2030 (%)
Data Table on Australia - Year-over-year growth 2025-2030 (%)

12.5.6 Indonesia - Market size and forecast 2025-2030

Chart on Indonesia - Market size and forecast 2025-2030 ($ million)
Data Table on Indonesia - Market size and forecast 2025-2030 ($ million)
Chart on Indonesia - Year-over-year growth 2025-2030 (%)
Data Table on Indonesia - Year-over-year growth 2025-2030 (%)

12.6 South America - Market size and forecast 2025-2030

Chart on South America - Market size and forecast 2025-2030 ($ million)
Data Table on South America - Market size and forecast 2025-2030 ($ million)
Chart on South America - Year-over-year growth 2025-2030 (%)
Data Table on South America - Year-over-year growth 2025-2030 (%)
Chart on Regional Comparison - South America
Data Table on Regional Comparison - South America

12.6.1 Brazil - Market size and forecast 2025-2030

Chart on Brazil - Market size and forecast 2025-2030 ($ million)
Data Table on Brazil - Market size and forecast 2025-2030 ($ million)
Chart on Brazil - Year-over-year growth 2025-2030 (%)
Data Table on Brazil - Year-over-year growth 2025-2030 (%)

12.6.2 Argentina - Market size and forecast 2025-2030

Chart on Argentina - Market size and forecast 2025-2030 ($ million)
Data Table on Argentina - Market size and forecast 2025-2030 ($ million)
Chart on Argentina - Year-over-year growth 2025-2030 (%)
Data Table on Argentina - Year-over-year growth 2025-2030 (%)

12.6.3 Chile - Market size and forecast 2025-2030

Chart on Chile - Market size and forecast 2025-2030 ($ million)
Data Table on Chile - Market size and forecast 2025-2030 ($ million)
Chart on Chile - Year-over-year growth 2025-2030 (%)
Data Table on Chile - Year-over-year growth 2025-2030 (%)

12.7 Middle East and Africa - Market size and forecast 2025-2030

Chart on Middle East and Africa - Market size and forecast 2025-2030 ($ million)
Data Table on Middle East and Africa - Market size and forecast 2025-2030 ($ million)
Chart on Middle East and Africa - Year-over-year growth 2025-2030 (%)
Data Table on Middle East and Africa - Year-over-year growth 2025-2030 (%)
Chart on Regional Comparison - Middle East and Africa
Data Table on Regional Comparison - Middle East and Africa

12.7.1 Saudi Arabia - Market size and forecast 2025-2030

Chart on Saudi Arabia - Market size and forecast 2025-2030 ($ million)
Data Table on Saudi Arabia - Market size and forecast 2025-2030 ($ million)
Chart on Saudi Arabia - Year-over-year growth 2025-2030 (%)
Data Table on Saudi Arabia - Year-over-year growth 2025-2030 (%)

12.7.2 UAE - Market size and forecast 2025-2030

Chart on UAE - Market size and forecast 2025-2030 ($ million)
Data Table on UAE - Market size and forecast 2025-2030 ($ million)
Chart on UAE - Year-over-year growth 2025-2030 (%)
Data Table on UAE - Year-over-year growth 2025-2030 (%)

12.7.3 South Africa - Market size and forecast 2025-2030

Chart on South Africa - Market size and forecast 2025-2030 ($ million)
Data Table on South Africa - Market size and forecast 2025-2030 ($ million)
Chart on South Africa - Year-over-year growth 2025-2030 (%)
Data Table on South Africa - Year-over-year growth 2025-2030 (%)

12.7.4 Israel - Market size and forecast 2025-2030

Chart on Israel - Market size and forecast 2025-2030 ($ million)
Data Table on Israel - Market size and forecast 2025-2030 ($ million)
Chart on Israel - Year-over-year growth 2025-2030 (%)
Data Table on Israel - Year-over-year growth 2025-2030 (%)

12.7.5 Turkey - Market size and forecast 2025-2030

Chart on Turkey - Market size and forecast 2025-2030 ($ million)
Data Table on Turkey - Market size and forecast 2025-2030 ($ million)
Chart on Turkey - Year-over-year growth 2025-2030 (%)
Data Table on Turkey - Year-over-year growth 2025-2030 (%)

12.8 Market opportunity by geography

Market opportunity by geography ($ million)
Data Tables on Market opportunity by geography ($ million)

13. Drivers, Challenges, and Opportunity

13.1 Market drivers

Increasing strategic outsourcing by pharmaceutical and biotechnology companies
Growing complexity of biologic drugs and expanding biopharmaceutical pipeline
Stringent regulatory landscape and intensifying emphasis on quality and safety

13.2 Market challenges

Acute shortage of skilled personnel and rising labor costs
High capital investment and rapid technological obsolescence
Intensifying pricing pressure and commoditization of standard services

13.3 Impact of drivers and challenges

Impact of drivers and challenges in 2025 and 2030

13.4 Market opportunities

Increasing focus on analytical services for advanced therapy medicinal products (ATMPs)
Integration of advanced analytical technologies and data analytics
Evolution towards strategic partnerships and integrated service offerings

14. Competitive Landscape

14.1 Overview

14.2

Overview on criticality of inputs and factors of differentiation

14.3 Landscape disruption

Overview on factors of disruption

14.4 Industry risks

Impact of key risks on business

15. Competitive Analysis

15.1 Companies profiled

Companies covered

15.2 Company ranking index

15.3 Market positioning of companies

Matrix on companies position and classification

15.4 Almac Group Ltd.

Almac Group Ltd. - Overview
Almac Group Ltd. - Product / Service
Almac Group Ltd. - Key offerings
SWOT

15.5 Catalent Inc.

Catalent Inc. - Overview
Catalent Inc. - Business segments
Catalent Inc. - Key offerings
Catalent Inc. - Segment focus
SWOT

15.6 Charles River Laboratories

Charles River Laboratories - Overview
Charles River Laboratories - Business segments
Charles River Laboratories - Key offerings
Charles River Laboratories - Segment focus
SWOT

15.7 Eurofins Scientific SE

Eurofins Scientific SE - Overview
Eurofins Scientific SE - Business segments
Eurofins Scientific SE - Key offerings
Eurofins Scientific SE - Segment focus
SWOT

15.8 ICON plc

ICON plc - Overview
ICON plc - Product / Service
ICON plc - Key offerings
SWOT

15.9 Intertek Group Plc

Intertek Group Plc - Overview
Intertek Group Plc - Business segments
Intertek Group Plc - Key offerings
Intertek Group Plc - Segment focus
SWOT

15.10 IQVIA Holdings Inc.

IQVIA Holdings Inc. - Overview
IQVIA Holdings Inc. - Business segments
IQVIA Holdings Inc. - Key offerings
IQVIA Holdings Inc. - Segment focus
SWOT

15.11 Laboratory Corp.

Laboratory Corp. - Overview
Laboratory Corp. - Business segments
Laboratory Corp. - Key news
Laboratory Corp. - Key offerings
Laboratory Corp. - Segment focus
SWOT

15.12 Lonza Group Ltd.

Lonza Group Ltd. - Overview
Lonza Group Ltd. - Business segments
Lonza Group Ltd. - Key news
Lonza Group Ltd. - Key offerings
Lonza Group Ltd. - Segment focus
SWOT

15.13 Merck KGaA

Merck KGaA - Overview
Merck KGaA - Business segments
Merck KGaA - Key news
Merck KGaA - Key offerings
Merck KGaA - Segment focus
SWOT

15.14 Parexel International Corp.

Parexel International Corp. - Overview
Parexel International Corp. - Product / Service
Parexel International Corp. - Key offerings
SWOT

15.15 Sartorius AG

Sartorius AG - Overview
Sartorius AG - Business segments
Sartorius AG - Key news
Sartorius AG - Key offerings
Sartorius AG - Segment focus
SWOT

15.16 SGS SA

SGS SA - Overview
SGS SA - Business segments
SGS SA - Key offerings
SGS SA - Segment focus
SWOT

15.17 Syneos Health

Syneos Health - Overview
Syneos Health - Product / Service
Syneos Health - Key offerings
SWOT

15.18 Thermo Fisher Scientific Inc.

Thermo Fisher Scientific Inc. - Overview
Thermo Fisher Scientific Inc. - Business segments
Thermo Fisher Scientific Inc. - Key news
Thermo Fisher Scientific Inc. - Key offerings
Thermo Fisher Scientific Inc. - Segment focus
SWOT

16. Appendix

16.1 Scope of the report

Market definition
Objectives
Notes and caveats

16.2 Inclusions and exclusions checklist

Inclusions checklist
Exclusions checklist

16.3 Currency conversion rates for US$

16.4 Research methodology

16.5 Data procurement

Information sources

16.6 Data validation

16.7 Validation techniques employed for market sizing

16.8 Data synthesis

16.9 360 degree market analysis

16.10 List of abbreviations

Research Methodology

Technavio presents a detailed picture of the market by way of study, synthesis, and summation of data from multiple sources. The analysts have presented the various facets of the market with a particular focus on identifying the key industry influencers. The data thus presented is comprehensive, reliable, and the result of extensive research, both primary and secondary.

INFORMATION SOURCES

Primary sources

  • Manufacturers and suppliers
  • Channel partners
  • Industry experts
  • Strategic decision makers

Secondary sources

  • Industry journals and periodicals
  • Government data
  • Financial reports of key industry players
  • Historical data
  • Press releases

DATA ANALYSIS

Data Synthesis

  • Collation of data
  • Estimation of key figures
  • Analysis of derived insights

Data Validation

  • Triangulation with data models
  • Reference against proprietary databases
  • Corroboration with industry experts

REPORT WRITING

Qualitative

  • Market drivers
  • Market challenges
  • Market trends
  • Five forces analysis

Quantitative

  • Market size and forecast
  • Market segmentation
  • Geographical insights
  • Competitive landscape

Interested in this report?

Get your sample now to see our research methodology and insights!

Download Now

Frequently Asked Questions

Biopharmaceutical Analytical Testing Services market growth will increase by USD 6347.3 million during 2026-2030.

The Biopharmaceutical Analytical Testing Services market is expected to grow at a CAGR of 15.5% during 2026-2030.

Biopharmaceutical Analytical Testing Services market is segmented by Service (Bioanalytical, Method development and validation, Stability testing, Others) End-user (Pharma and biotech companies, CROs) Type (Physiochemical analysis, Biological assays, Microbial testing, Environmental monitoring)

Almac Group Ltd., Catalent Inc., Charles River Laboratories, Element Materials Tech., Eurofins Scientific SE, ICON plc, Intertek Group Plc, IQVIA Holdings Inc., Laboratory Corp., Lonza Group Ltd., Merck KGaA, Parexel International Corp., Sartorius AG, SGS SA, Syneos Health, Thermo Fisher Scientific Inc., WuXi AppTec Co. Ltd. are a few of the key vendors in the Biopharmaceutical Analytical Testing Services market.

North America will register the highest growth rate of 33.3% among the other regions. Therefore, the Biopharmaceutical Analytical Testing Services market in North America is expected to garner significant business opportunities for the vendors during the forecast period.

US, Canada, Mexico, Germany, UK, France, Italy, Spain, The Netherlands, China, Japan, India, South Korea, Australia, Indonesia, Brazil, Argentina, Chile, Saudi Arabia, UAE, South Africa, Israel, Turkey

  • Increasing strategic outsourcing by pharmaceutical and biotechnology companies is the driving factor this market.

The Biopharmaceutical Analytical Testing Services market vendors should focus on grabbing business opportunities from the Service segment as it accounted for the largest market share in the base year.
RIA - Research AI Assistant
Ask RIA