Contract Research Organization (CRO) Market Analysis, Size, and Forecast 2026-2030: North America (US, Canada, and Mexico), Europe (Germany, UK, and France), APAC (China, Japan, and India), South America (Brazil and Argentina), Middle East and Africa (Israel, South Africa, and Saudi Arabia), Asia, Rest of World (ROW)

Contract Research Organization (CRO) Market Analysis, Size, and Forecast 2026-2030:
North America (US, Canada, and Mexico), Europe (Germany, UK, and France), APAC (China, Japan, and India), South America (Brazil and Argentina), Middle East and Africa (Israel, South Africa, and Saudi Arabia), Asia, Rest of World (ROW)

Published: Mar 2026 336 Pages SKU: IRTNTR73340

Market Overview at a Glance

$51.87 B
Market Opportunity
8.9%
CAGR 2025 - 2030
38.2%
North America Growth
$50.58 B
Clinical research segment 2024

Contract Research Organization (CRO) Market Size 2026-2030

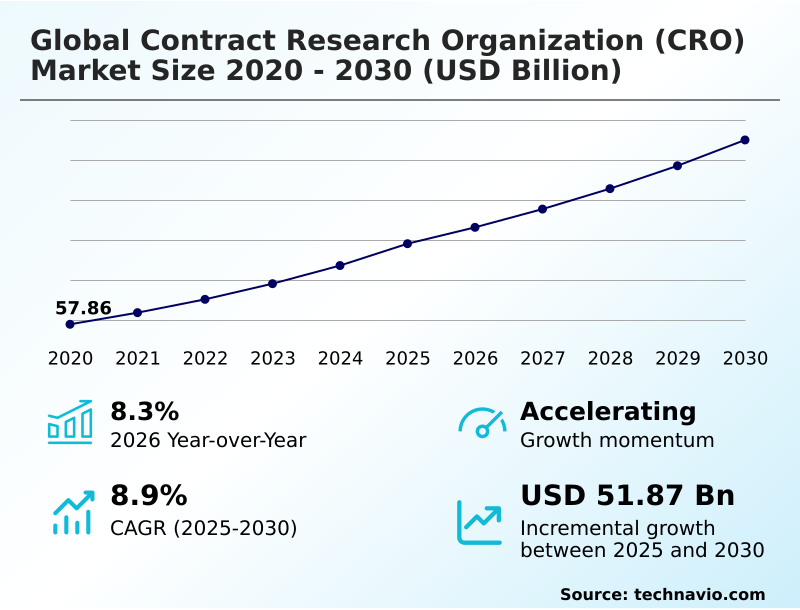
The contract research organization (cro) market size is valued to increase by USD 51.87 billion, at a CAGR of 8.9% from 2025 to 2030. Escalating research and development investments as primary catalyst will drive the contract research organization (cro) market.

Major Market Trends & Insights

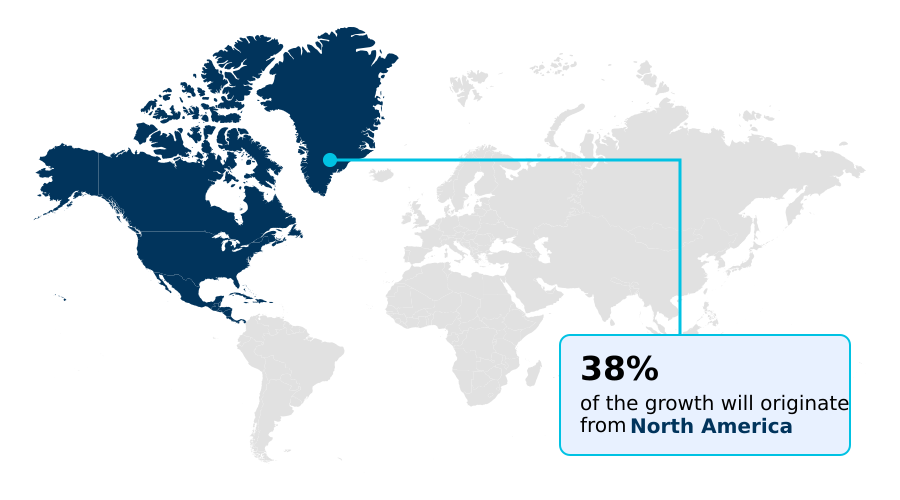
  • North America dominated the market and accounted for a 38.2% growth during the forecast period.
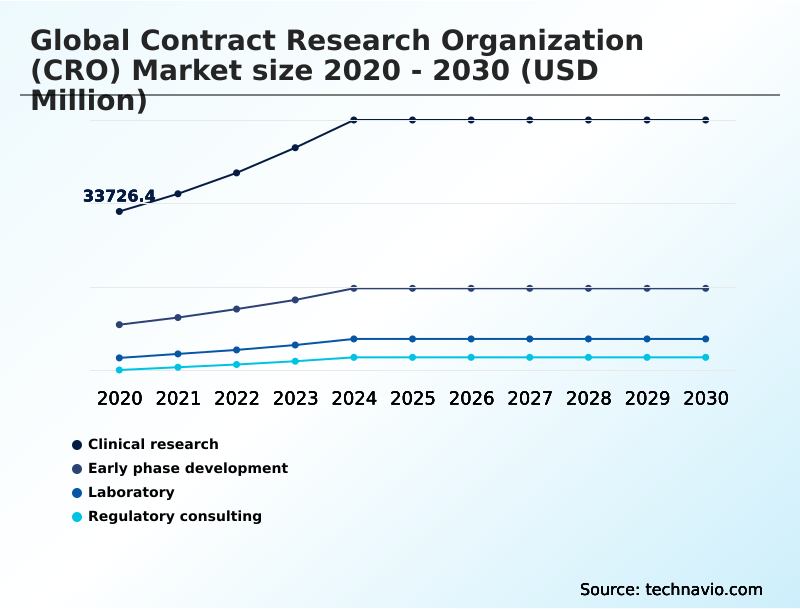
  • By Application - Clinical research segment was valued at USD 50.58 billion in 2024
  • By End-user - Pharmaceutical and biopharmaceutical companies segment accounted for the largest market revenue share in 2024

Market Size & Forecast

  • Market Opportunities: USD 92.16 billion
  • Market Future Opportunities: USD 51.87 billion
  • CAGR from 2025 to 2030 : 8.9%

Market Summary

  • The contract research organization (CRO) market is undergoing significant expansion, driven by the biopharmaceutical industry's strategic shift toward outsourcing to enhance efficiency and access specialized expertise. CROs provide end-to-end solutions across the drug development lifecycle, from preclinical research and toxicology studies to full-scale clinical trial management. This partnership model allows sponsors to navigate complex regulatory landscapes and accelerate timelines.
  • For instance, a mid-sized biotech firm can leverage a CRO for its entire clinical program, including pharmacovigilance services, bioanalytical testing, and biostatistics and data management, for a new oncology drug. This avoids the high fixed costs of building in-house infrastructure for services like central laboratory services and allows the firm to focus on its core discovery competencies.
  • The adoption of digital health technologies, decentralized clinical trials (DCT), and the use of real world evidence (RWE) are key trends, forcing CROs to innovate. Success hinges on therapeutic area expertise, a global operational footprint, and a commitment to quality and regulatory compliance, ensuring data integrity for submissions to bodies like the FDA and EMA.
  • This evolution transforms CROs from mere vendors to integral strategic partners in medical innovation.

What will be the Size of the Contract Research Organization (CRO) Market during the forecast period?

Get Key Insights on Market Forecast (PDF) Request Free Sample

How is the Contract Research Organization (CRO) Market Segmented?

The contract research organization (cro) industry research report provides comprehensive data (region-wise segment analysis), with forecasts and estimates in "USD million" for the period 2026-2030, as well as historical data from 2020-2024 for the following segments.

  • Application
    • Clinical research
    • Early phase development
    • Laboratory
    • Regulatory consulting
  • End-user
    • Pharmaceutical and biopharmaceutical companies
    • Medical device companies
    • Academic institutes
  • Therapeutic area
    • Oncology
    • Cardiovascular diseases
    • CNS disorders
    • Infectious diseases
    • Others
  • Geography
    • North America
      • US
      • Canada
      • Mexico
    • Europe
      • Germany
      • UK
      • France
    • Asia
    • Rest of World (ROW)

By Application Insights

The clinical research segment is estimated to witness significant growth during the forecast period.

The clinical research segment is the largest application in the contract research organization (CRO) market, managing human trials from phase I to IV. Growth is driven by complex trial designs and the need for operational efficiency.

CROs in this domain provide a spectrum of services, including protocol design, global site selection and management, and clinical endpoint adjudication. A core competency is patient recruitment and retention, where CROs leverage sophisticated data analytics.

Effective clinical data management systems (CDMS) and adherence to good clinical practice (GCP) are essential. By partnering with CROs for these services, sponsors can achieve a reduction in trial startup times of over 25%, a significant value-based pricing advantage.

This strategic outsourcing model enables a patient-centric approach and ensures data integrity and security for successful regulatory submissions.

Request Free Sample

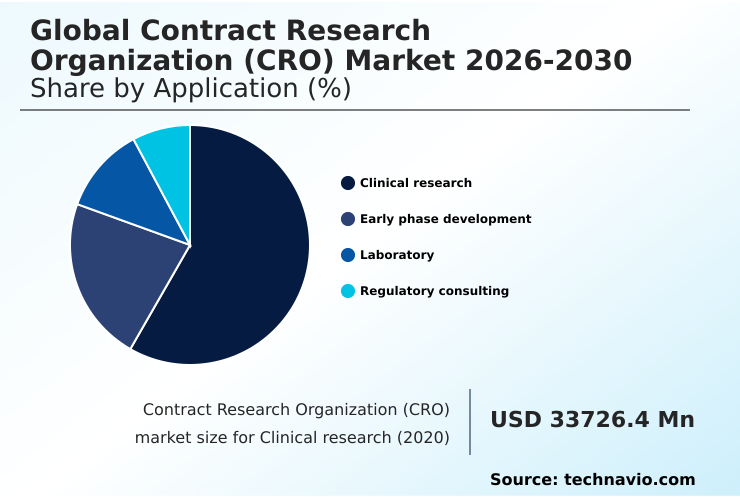
The Clinical research segment was valued at USD 50.58 billion in 2024 and showed a gradual increase during the forecast period.

Request Free Sample

Regional Analysis

North America is estimated to contribute 38.2% to the growth of the global market during the forecast period.Technavio’s analysts have elaborately explained the regional trends and drivers that shape the market during the forecast period.

See How Contract Research Organization (CRO) Market Demand is Rising in North America Request Free Sample

The geographic landscape of the contract research organization (CRO) market is characterized by established dominance and rapid evolution.

North America, accounting for 38.18% of incremental growth, leads due to high R&D investment and a sophisticated regulatory environment that fosters innovation in areas like cell and gene therapy and pharmacokinetics (PK).

Europe remains a mature market, while Asia is the fastest-growing region, driven by large patient pools and improving infrastructure. The Rest of World (ROW) segment offers unique advantages; for instance, Australia provides rapid five-week study start-up times for first-in-human studies.

CROs must demonstrate a strong global operational footprint and local expertise, offering services from investigational new drug (IND) support to marketing authorization application (MAA) preparation, to effectively serve sponsors' global clinical development services needs across these diverse regions.

Market Dynamics

Our researchers analyzed the data with 2025 as the base year, along with the key drivers, trends, and challenges. A holistic analysis of drivers will help companies refine their marketing strategies to gain a competitive advantage.

  • The contract research organization (CRO) market is evolving to meet the complex demands of modern drug development, extending far beyond traditional trial management. A critical area of expansion involves CRO services for cell and gene therapy, which require specialized infrastructure and regulatory knowledge.
  • The cost-benefit analysis of outsourcing preclinical studies consistently favors CRO partnerships, as they provide access to advanced capabilities without substantial capital investment. For later-stage development, the use of real world evidence in post-market surveillance is becoming standard practice, offering deeper insights into long-term safety and effectiveness.
  • Firms leveraging specialized CRO expertise in oncology trials report data submission timelines that are up to 20% faster than those managing similar complex trials in-house. Success in this environment depends on a CRO's ability to offer integrated platforms for clinical data management and provide robust regulatory submission support for novel biologics.
  • The role of CROs in personalized medicine is also growing, as they manage the complexities of biomarker-driven trials. Furthermore, AI for patient recruitment in CNS trials is a key innovation addressing historical bottlenecks.
  • The ability to manage data integrity in hybrid trials, navigate both FDA and EMA regulatory pathways, and offer comprehensive pharmacovigilance for small molecule drugs are all hallmarks of a leading CRO. This shift towards strategic partnerships in drug development is redefining the CRO selection criteria for biotech startups, which now prioritize partners offering end-to-end support.

What are the key market drivers leading to the rise in the adoption of Contract Research Organization (CRO) Industry?

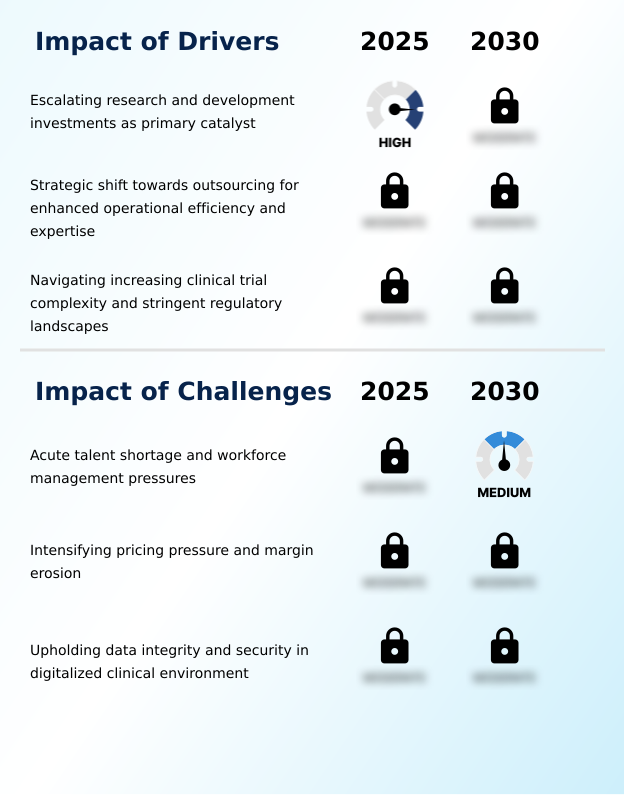
  • Escalating research and development investments by pharmaceutical and biotechnology companies serve as the primary catalyst for market growth.

  • The growth of the contract research organization (CRO) market is propelled by fundamental economic and scientific drivers.
  • Escalating R&D outsourcing, a strategic imperative for biopharma, allows sponsors to adopt a flexible variable cost model, reallocating up to 30% of their operational budget to core discovery activities.
  • This focus on capital efficiency is paramount as sponsors navigate increasingly complex therapeutic specialization. Access to deep therapeutic knowledge in areas like oncology and CNS disorders, provided by niche CRO providers and boutique CRO expertise, is a critical driver.
  • Furthermore, the increasing complexity of clinical research, including the rise of advanced modalities, necessitates specialized preclinical research and bioanalytical testing capabilities.
  • This demand for expert-driven end-to-end solutions accelerates the reliance on CROs to manage the intricacies of modern clinical development and achieve greater speed to market.

What are the market trends shaping the Contract Research Organization (CRO) Industry?

  • The ascent of decentralized and hybrid clinical trial models is reshaping clinical research. This shift represents a move toward more patient-centric, technology-enabled frameworks.

  • Key trends reshaping the contract research organization (CRO) market center on digitalization and strategic alignment. The pervasive integration of artificial intelligence (AI) in drug development is a dominant trend, with machine learning algorithms optimizing everything from site selection and management to risk-based monitoring.
  • Hybrid trial models are now commonplace, enhancing the patient-centric approach and improving retention rates in long-term studies by over 25%. This shift requires CROs to offer seamless eClinical platform integration and advanced health economics and outcomes research (HEOR). The evolution toward strategic partnerships continues, with a focus on risk sharing partnerships that align sponsor and CRO goals.
  • This dynamic fosters deeper collaboration across the drug development lifecycle, demanding more from a CRO’s supply chain management and regulatory compliance framework to deliver value.

What challenges does the Contract Research Organization (CRO) Industry face during its growth?

  • An acute talent shortage and persistent workforce management pressures represent a key challenge affecting industry growth.

  • The contract research organization (CRO) market faces significant operational and financial challenges that temper its growth. An acute shortage of skilled professionals leads to intense talent acquisition and retention pressures, with industry turnover rates for clinical research associates exceeding 25% annually. This workforce management issue directly impacts service quality and timelines.
  • Simultaneously, CROs face relentless pricing pressure and margin compression from sponsors, forcing a delicate balance between cost containment and investment in innovative technologies like electronic data capture (EDC) and decentralized clinical trials. Upholding data privacy regulations is another major challenge, as a single breach can result in compliance fines representing up to 4% of a company’s annual revenue.
  • These hurdles demand sophisticated strategies in both human capital and commercial operations.

Exclusive Technavio Analysis on Customer Landscape

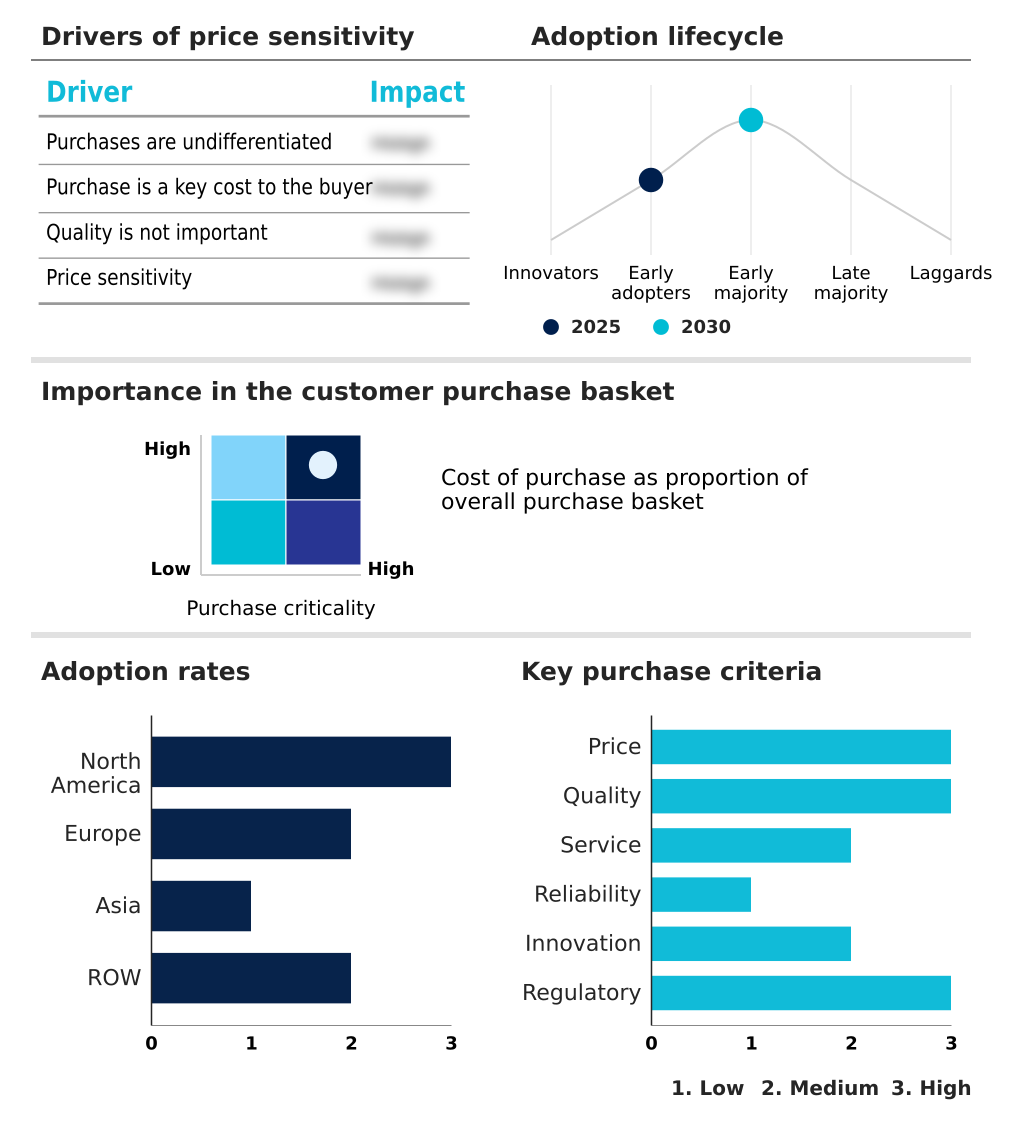
The contract research organization (cro) market forecasting report includes the adoption lifecycle of the market, covering from the innovator’s stage to the laggard’s stage. It focuses on adoption rates in different regions based on penetration. Furthermore, the contract research organization (cro) market report also includes key purchase criteria and drivers of price sensitivity to help companies evaluate and develop their market growth analysis strategies.

Customer Landscape of Contract Research Organization (CRO) Industry

Competitive Landscape

Companies are implementing various strategies, such as strategic alliances, contract research organization (cro) market forecast, partnerships, mergers and acquisitions, geographical expansion, and product/service launches, to enhance their presence in the industry.

Berries Health and Genetics - Delivers comprehensive contract research services, spanning clinical trial management and regulatory consulting, to support the entire drug development lifecycle.

The industry research and growth report includes detailed analyses of the competitive landscape of the market and information about key companies, including:

  • Berries Health and Genetics
  • BioAgile Therapeutics Pvt. Ltd.
  • Charles River Laboratories International Inc.
  • CTI Clinical Trial and Consulting Inc.
  • Diagnostic Laboratory Services Inc.
  • EmVenio Research
  • Ergomed Plc
  • Eurofins Scientific SE
  • Hangzhou Tigermed Consulting Co. Ltd.
  • ICON plc
  • IQVIA Holdings Inc.
  • Laboratory Holdings Inc.
  • Medpace Holdings Inc.
  • Novotech Health Holdings
  • Parexel International Corp.
  • Pharmaron Beijing Co. Ltd.
  • Syneos Health Inc.
  • Thermo Fisher Scientific Inc.
  • Worldwide Clinical Trials Holdings Inc.
  • WuXi AppTec Co. Ltd.

Qualitative and quantitative analysis of companies has been conducted to help clients understand the wider business environment as well as the strengths and weaknesses of key industry players. Data is qualitatively analyzed to categorize companies as pure play, category-focused, industry-focused, and diversified; it is quantitatively analyzed to categorize companies as dominant, leading, strong, tentative, and weak.

Recent Development and News in Contract research organization (cro) market

  • In August 2024, ICON plc acquired KCR, a clinical trial solutions provider, to enhance its operational presence in Europe, particularly in Central and Eastern Europe.
  • In October 2024, Thermo Fisher Scientific Inc. launched its Accelerator Drug Development service, integrating its contract development and manufacturing with contract research services into a unified offering.
  • In January 2025, Lindus Health, a technology-focused CRO, raised $55 million in a Series B funding round to enhance its AI-driven eClinical platform.
  • In January 2025, Avance Clinical announced it holds over 52% of the market share for active early-phase clinical trials in Australia, with a majority of its clients being US-based biotechs.

Dive into Technavio’s robust research methodology, blending expert interviews, extensive data synthesis, and validated models for unparalleled Contract Research Organization (CRO) Market insights. See full methodology.

Market Scope
Page number 336
Base year 2025
Historic period 2020-2024
Forecast period 2026-2030
Growth momentum & CAGR Accelerate at a CAGR of 8.9%
Market growth 2026-2030 USD 51874.2 million
Market structure Fragmented
YoY growth 2025-2026(%) 8.3%
Key countries US, Canada, Mexico, Germany, UK, France, Italy, Spain, Switzerland, China, Japan, India, South Korea, Singapore, Taiwan, Brazil, Israel, South Africa, Saudi Arabia, UAE, Argentina, Turkey and Egypt
Competitive landscape Leading Companies, Market Positioning of Companies, Competitive Strategies, and Industry Risks

Request Free Sample

Research Analyst Overview

  • The contract research organization (CRO) market is evolving from a transactional service model to one of deep strategic partnership, driven by the increasing complexity of clinical development. Core functions such as clinical trial management, pharmacovigilance services, and regulatory consulting are now table stakes; differentiation comes from advanced capabilities.
  • The integration of digital health technologies is central to this shift, with the adoption of decentralized clinical trials (DCT) being a key boardroom consideration impacting budgeting and risk management. This move toward virtual and hybrid models is compelling CROs to invest in eConsent platforms and robust cybersecurity postures to ensure data integrity and security.
  • Companies successfully implementing these technologies have achieved a 30% reduction in data processing times. Service providers must also offer deep therapeutic area expertise in high-growth fields like cell and gene therapy and provide specialized services such as biomarker development and immunogenicity testing.
  • Navigating the stringent requirements of good clinical practice (GCP) and good laboratory practice (GLP) while managing global cold chain logistics for advanced biologics remains a critical operational challenge. This dynamic environment necessitates a flexible, technology-forward approach to delivering comprehensive clinical development services.

What are the Key Data Covered in this Contract Research Organization (CRO) Market Research and Growth Report?

  • What is the expected growth of the Contract Research Organization (CRO) Market between 2026 and 2030?

    • USD 51.87 billion, at a CAGR of 8.9%

  • What segmentation does the market report cover?

    • The report is segmented by Application (Clinical research, Early phase development, Laboratory, and Regulatory consulting), End-user (Pharmaceutical and biopharmaceutical companies, Medical device companies, and Academic institutes), Therapeutic Area (Oncology, Cardiovascular diseases, CNS disorders, Infectious diseases, and Others) and Geography (North America, Europe, Asia, Rest of World (ROW))

  • Which regions are analyzed in the report?

    • North America, Europe, Asia and Rest of World (ROW)

  • What are the key growth drivers and market challenges?

    • Escalating research and development investments as primary catalyst, Acute talent shortage and workforce management pressures

  • Who are the major players in the Contract Research Organization (CRO) Market?

    • Berries Health and Genetics, BioAgile Therapeutics Pvt. Ltd., Charles River Laboratories International Inc., CTI Clinical Trial and Consulting Inc., Diagnostic Laboratory Services Inc., EmVenio Research, Ergomed Plc, Eurofins Scientific SE, Hangzhou Tigermed Consulting Co. Ltd., ICON plc, IQVIA Holdings Inc., Laboratory Holdings Inc., Medpace Holdings Inc., Novotech Health Holdings, Parexel International Corp., Pharmaron Beijing Co. Ltd., Syneos Health Inc., Thermo Fisher Scientific Inc., Worldwide Clinical Trials Holdings Inc. and WuXi AppTec Co. Ltd.

Market Research Insights

  • The contract research organization (CRO) market is defined by a dynamic shift toward strategic outsourcing models, where sponsors seek end-to-end solutions to improve capital efficiency. This has led to an increase in preferred provider agreements, with sponsors consolidating work to achieve operational consistency. This trend has been shown to improve study startup times by over 15%.
  • Simultaneously, the integration of AI in drug development is transforming key processes; advanced machine learning algorithms for patient identification can boost enrollment rates by up to 30% compared to traditional methods. While large providers offer a global operational footprint, niche CRO providers thrive by offering deep therapeutic specialization.
  • This competitive environment, marked by risk sharing partnerships and a focus on speed to market, pushes all firms to enhance their eClinical platform capabilities and data privacy regulations adherence.

We can help! Our analysts can customize this contract research organization (cro) market research report to meet your requirements.

Get in touch

1. Executive Summary

1.1 Market overview

Executive Summary - Chart on Market Overview
Executive Summary - Data Table on Market Overview
Executive Summary - Chart on Global Market Characteristics
Executive Summary - Chart on Market by Geography
Executive Summary - Chart on Market Segmentation by Application
Executive Summary - Chart on Market Segmentation by End-user
Executive Summary - Chart on Market Segmentation by Therapeutic Area
Executive Summary - Chart on Incremental Growth
Executive Summary - Data Table on Incremental Growth
Executive Summary - Chart on Company Market Positioning

2. Technavio Analysis

2.1 Analysis of price sensitivity, lifecycle, customer purchase basket, adoption rates, and purchase criteria

2.2 Criticality of inputs and Factors of differentiation

Chart on Overview on criticality of inputs and factors of differentiation

2.3 Factors of disruption

Chart on Overview on factors of disruption

2.4 Impact of drivers and challenges

Chart on Impact of drivers and challenges in 2025 and 2030

3. Market Landscape

3.1 Market ecosystem

Chart on Parent Market
Data Table on - Parent Market

3.2 Market characteristics

Chart on Market characteristics analysis

3.3 Value chain analysis

Chart on Value chain analysis

4. Market Sizing

4.1 Market definition

Data Table on Offerings of companies included in the market definition

4.2 Market segment analysis

Market segments

4.3 Market size 2025

4.4 Market outlook: Forecast for 2025-2030

Chart on Global - Market size and forecast 2025-2030 ($ million)
Data Table on Global - Market size and forecast 2025-2030 ($ million)
Chart on Global Market: Year-over-year growth 2025-2030 (%)
Data Table on Global Market: Year-over-year growth 2025-2030 (%)

5. Historic Market Size

5.1 Global Contract Research Organization (CRO) Market 2020 - 2024

Historic Market Size - Data Table on Global Contract Research Organization (CRO) Market 2020 - 2024 ($ million)

5.2 Application segment analysis 2020 - 2024

Historic Market Size - Application Segment 2020 - 2024 ($ million)

5.3 End-user segment analysis 2020 - 2024

Historic Market Size - End-user Segment 2020 - 2024 ($ million)

5.4 Therapeutic Area segment analysis 2020 - 2024

Historic Market Size - Therapeutic Area Segment 2020 - 2024 ($ million)

5.5 Geography segment analysis 2020 - 2024

Historic Market Size - Geography Segment 2020 - 2024 ($ million)

5.6 Country segment analysis 2020 - 2024

Historic Market Size - Country Segment 2020 - 2024 ($ million)

6. Qualitative Analysis

6.1 Impact of AI on global contract research organization (CRO) market

6.2 Impact of geopolitical conflicts on global contract research organization (CRO) market

7. Five Forces Analysis

7.1 Five forces summary

Five forces analysis - Comparison between 2025 and 2030

7.2 Bargaining power of buyers

Bargaining power of buyers - Impact of key factors 2025 and 2030

7.3 Bargaining power of suppliers

Bargaining power of suppliers - Impact of key factors in 2025 and 2030

7.4 Threat of new entrants

Threat of new entrants - Impact of key factors in 2025 and 2030

7.5 Threat of substitutes

Threat of substitutes - Impact of key factors in 2025 and 2030

7.6 Threat of rivalry

Threat of rivalry - Impact of key factors in 2025 and 2030

7.7 Market condition

Chart on Market condition - Five forces 2025 and 2030

8. Market Segmentation by Application

8.1 Market segments

Chart on Application - Market share 2025-2030 (%)
Data Table on Application - Market share 2025-2030 (%)

8.2 Comparison by Application

Chart on Comparison by Application
Data Table on Comparison by Application

8.3 Clinical research - Market size and forecast 2025-2030

Chart on Clinical research - Market size and forecast 2025-2030 ($ million)
Data Table on Clinical research - Market size and forecast 2025-2030 ($ million)
Chart on Clinical research - Year-over-year growth 2025-2030 (%)
Data Table on Clinical research - Year-over-year growth 2025-2030 (%)

8.4 Early phase development - Market size and forecast 2025-2030

Chart on Early phase development - Market size and forecast 2025-2030 ($ million)
Data Table on Early phase development - Market size and forecast 2025-2030 ($ million)
Chart on Early phase development - Year-over-year growth 2025-2030 (%)
Data Table on Early phase development - Year-over-year growth 2025-2030 (%)

8.5 Laboratory - Market size and forecast 2025-2030

Chart on Laboratory - Market size and forecast 2025-2030 ($ million)
Data Table on Laboratory - Market size and forecast 2025-2030 ($ million)
Chart on Laboratory - Year-over-year growth 2025-2030 (%)
Data Table on Laboratory - Year-over-year growth 2025-2030 (%)

8.6 Regulatory consulting - Market size and forecast 2025-2030

Chart on Regulatory consulting - Market size and forecast 2025-2030 ($ million)
Data Table on Regulatory consulting - Market size and forecast 2025-2030 ($ million)
Chart on Regulatory consulting - Year-over-year growth 2025-2030 (%)
Data Table on Regulatory consulting - Year-over-year growth 2025-2030 (%)

8.7 Market opportunity by Application

Market opportunity by Application ($ million)
Data Table on Market opportunity by Application ($ million)

9. Market Segmentation by End-user

9.1 Market segments

Chart on End-user - Market share 2025-2030 (%)
Data Table on End-user - Market share 2025-2030 (%)

9.2 Comparison by End-user

Chart on Comparison by End-user
Data Table on Comparison by End-user

9.3 Pharmaceutical and biopharmaceutical companies - Market size and forecast 2025-2030

Chart on Pharmaceutical and biopharmaceutical companies - Market size and forecast 2025-2030 ($ million)
Data Table on Pharmaceutical and biopharmaceutical companies - Market size and forecast 2025-2030 ($ million)
Chart on Pharmaceutical and biopharmaceutical companies - Year-over-year growth 2025-2030 (%)
Data Table on Pharmaceutical and biopharmaceutical companies - Year-over-year growth 2025-2030 (%)

9.4 Medical device companies - Market size and forecast 2025-2030

Chart on Medical device companies - Market size and forecast 2025-2030 ($ million)
Data Table on Medical device companies - Market size and forecast 2025-2030 ($ million)
Chart on Medical device companies - Year-over-year growth 2025-2030 (%)
Data Table on Medical device companies - Year-over-year growth 2025-2030 (%)

9.5 Academic institutes - Market size and forecast 2025-2030

Chart on Academic institutes - Market size and forecast 2025-2030 ($ million)
Data Table on Academic institutes - Market size and forecast 2025-2030 ($ million)
Chart on Academic institutes - Year-over-year growth 2025-2030 (%)
Data Table on Academic institutes - Year-over-year growth 2025-2030 (%)

9.6 Market opportunity by End-user

Market opportunity by End-user ($ million)
Data Table on Market opportunity by End-user ($ million)

10. Market Segmentation by Therapeutic Area

10.1 Market segments

Chart on Therapeutic Area - Market share 2025-2030 (%)
Data Table on Therapeutic Area - Market share 2025-2030 (%)

10.2 Comparison by Therapeutic Area

Chart on Comparison by Therapeutic Area
Data Table on Comparison by Therapeutic Area

10.3 Oncology - Market size and forecast 2025-2030

Chart on Oncology - Market size and forecast 2025-2030 ($ million)
Data Table on Oncology - Market size and forecast 2025-2030 ($ million)
Chart on Oncology - Year-over-year growth 2025-2030 (%)
Data Table on Oncology - Year-over-year growth 2025-2030 (%)

10.4 Cardiovascular diseases - Market size and forecast 2025-2030

Chart on Cardiovascular diseases - Market size and forecast 2025-2030 ($ million)
Data Table on Cardiovascular diseases - Market size and forecast 2025-2030 ($ million)
Chart on Cardiovascular diseases - Year-over-year growth 2025-2030 (%)
Data Table on Cardiovascular diseases - Year-over-year growth 2025-2030 (%)

10.5 CNS disorders - Market size and forecast 2025-2030

Chart on CNS disorders - Market size and forecast 2025-2030 ($ million)
Data Table on CNS disorders - Market size and forecast 2025-2030 ($ million)
Chart on CNS disorders - Year-over-year growth 2025-2030 (%)
Data Table on CNS disorders - Year-over-year growth 2025-2030 (%)

10.6 Infectious diseases - Market size and forecast 2025-2030

Chart on Infectious diseases - Market size and forecast 2025-2030 ($ million)
Data Table on Infectious diseases - Market size and forecast 2025-2030 ($ million)
Chart on Infectious diseases - Year-over-year growth 2025-2030 (%)
Data Table on Infectious diseases - Year-over-year growth 2025-2030 (%)

10.7 Others - Market size and forecast 2025-2030

Chart on Others - Market size and forecast 2025-2030 ($ million)
Data Table on Others - Market size and forecast 2025-2030 ($ million)
Chart on Others - Year-over-year growth 2025-2030 (%)
Data Table on Others - Year-over-year growth 2025-2030 (%)

10.8 Market opportunity by Therapeutic Area

Market opportunity by Therapeutic Area ($ million)
Data Table on Market opportunity by Therapeutic Area ($ million)

11. Customer Landscape

11.1 Customer landscape overview

Analysis of price sensitivity, lifecycle, customer purchase basket, adoption rates, and purchase criteria

12. Geographic Landscape

12.1 Geographic segmentation

Chart on Market share by geography 2025-2030 (%)
Data Table on Market share by geography 2025-2030 (%)

12.2 Geographic comparison

Chart on Geographic comparison
Data Table on Geographic comparison

12.3 North America - Market size and forecast 2025-2030

Chart on North America - Market size and forecast 2025-2030 ($ million)
Data Table on North America - Market size and forecast 2025-2030 ($ million)
Chart on North America - Year-over-year growth 2025-2030 (%)
Data Table on North America - Year-over-year growth 2025-2030 (%)
Chart on Regional Comparison - North America
Data Table on Regional Comparison - North America

12.3.1 US - Market size and forecast 2025-2030

Chart on US - Market size and forecast 2025-2030 ($ million)
Data Table on US - Market size and forecast 2025-2030 ($ million)
Chart on US - Year-over-year growth 2025-2030 (%)
Data Table on US - Year-over-year growth 2025-2030 (%)

12.3.2 Canada - Market size and forecast 2025-2030

Chart on Canada - Market size and forecast 2025-2030 ($ million)
Data Table on Canada - Market size and forecast 2025-2030 ($ million)
Chart on Canada - Year-over-year growth 2025-2030 (%)
Data Table on Canada - Year-over-year growth 2025-2030 (%)

12.3.3 Mexico - Market size and forecast 2025-2030

Chart on Mexico - Market size and forecast 2025-2030 ($ million)
Data Table on Mexico - Market size and forecast 2025-2030 ($ million)
Chart on Mexico - Year-over-year growth 2025-2030 (%)
Data Table on Mexico - Year-over-year growth 2025-2030 (%)

12.4 Europe - Market size and forecast 2025-2030

Chart on Europe - Market size and forecast 2025-2030 ($ million)
Data Table on Europe - Market size and forecast 2025-2030 ($ million)
Chart on Europe - Year-over-year growth 2025-2030 (%)
Data Table on Europe - Year-over-year growth 2025-2030 (%)
Chart on Regional Comparison - Europe
Data Table on Regional Comparison - Europe

12.4.1 Germany - Market size and forecast 2025-2030

Chart on Germany - Market size and forecast 2025-2030 ($ million)
Data Table on Germany - Market size and forecast 2025-2030 ($ million)
Chart on Germany - Year-over-year growth 2025-2030 (%)
Data Table on Germany - Year-over-year growth 2025-2030 (%)

12.4.2 UK - Market size and forecast 2025-2030

Chart on UK - Market size and forecast 2025-2030 ($ million)
Data Table on UK - Market size and forecast 2025-2030 ($ million)
Chart on UK - Year-over-year growth 2025-2030 (%)
Data Table on UK - Year-over-year growth 2025-2030 (%)

12.4.3 France - Market size and forecast 2025-2030

Chart on France - Market size and forecast 2025-2030 ($ million)
Data Table on France - Market size and forecast 2025-2030 ($ million)
Chart on France - Year-over-year growth 2025-2030 (%)
Data Table on France - Year-over-year growth 2025-2030 (%)

12.4.4 Italy - Market size and forecast 2025-2030

Chart on Italy - Market size and forecast 2025-2030 ($ million)
Data Table on Italy - Market size and forecast 2025-2030 ($ million)
Chart on Italy - Year-over-year growth 2025-2030 (%)
Data Table on Italy - Year-over-year growth 2025-2030 (%)

12.4.5 Spain - Market size and forecast 2025-2030

Chart on Spain - Market size and forecast 2025-2030 ($ million)
Data Table on Spain - Market size and forecast 2025-2030 ($ million)
Chart on Spain - Year-over-year growth 2025-2030 (%)
Data Table on Spain - Year-over-year growth 2025-2030 (%)

12.4.6 Switzerland - Market size and forecast 2025-2030

Chart on Switzerland - Market size and forecast 2025-2030 ($ million)
Data Table on Switzerland - Market size and forecast 2025-2030 ($ million)
Chart on Switzerland - Year-over-year growth 2025-2030 (%)
Data Table on Switzerland - Year-over-year growth 2025-2030 (%)

12.5 Asia - Market size and forecast 2025-2030

Chart on Asia - Market size and forecast 2025-2030 ($ million)
Data Table on Asia - Market size and forecast 2025-2030 ($ million)
Chart on Asia - Year-over-year growth 2025-2030 (%)
Data Table on Asia - Year-over-year growth 2025-2030 (%)
Chart on Regional Comparison - Asia
Data Table on Regional Comparison - Asia

12.5.1 China - Market size and forecast 2025-2030

Chart on China - Market size and forecast 2025-2030 ($ million)
Data Table on China - Market size and forecast 2025-2030 ($ million)
Chart on China - Year-over-year growth 2025-2030 (%)
Data Table on China - Year-over-year growth 2025-2030 (%)

12.5.2 Japan - Market size and forecast 2025-2030

Chart on Japan - Market size and forecast 2025-2030 ($ million)
Data Table on Japan - Market size and forecast 2025-2030 ($ million)
Chart on Japan - Year-over-year growth 2025-2030 (%)
Data Table on Japan - Year-over-year growth 2025-2030 (%)

12.5.3 India - Market size and forecast 2025-2030

Chart on India - Market size and forecast 2025-2030 ($ million)
Data Table on India - Market size and forecast 2025-2030 ($ million)
Chart on India - Year-over-year growth 2025-2030 (%)
Data Table on India - Year-over-year growth 2025-2030 (%)

12.5.4 South Korea - Market size and forecast 2025-2030

Chart on South Korea - Market size and forecast 2025-2030 ($ million)
Data Table on South Korea - Market size and forecast 2025-2030 ($ million)
Chart on South Korea - Year-over-year growth 2025-2030 (%)
Data Table on South Korea - Year-over-year growth 2025-2030 (%)

12.5.5 Singapore - Market size and forecast 2025-2030

Chart on Singapore - Market size and forecast 2025-2030 ($ million)
Data Table on Singapore - Market size and forecast 2025-2030 ($ million)
Chart on Singapore - Year-over-year growth 2025-2030 (%)
Data Table on Singapore - Year-over-year growth 2025-2030 (%)

12.5.6 Taiwan - Market size and forecast 2025-2030

Chart on Taiwan - Market size and forecast 2025-2030 ($ million)
Data Table on Taiwan - Market size and forecast 2025-2030 ($ million)
Chart on Taiwan - Year-over-year growth 2025-2030 (%)
Data Table on Taiwan - Year-over-year growth 2025-2030 (%)

12.6 Rest of World (ROW) - Market size and forecast 2025-2030

Chart on Rest of World (ROW) - Market size and forecast 2025-2030 ($ million)
Data Table on Rest of World (ROW) - Market size and forecast 2025-2030 ($ million)
Chart on Rest of World (ROW) - Year-over-year growth 2025-2030 (%)
Data Table on Rest of World (ROW) - Year-over-year growth 2025-2030 (%)
Chart on Regional Comparison - Rest of World (ROW)
Data Table on Regional Comparison - Rest of World (ROW)

12.6.1 Brazil - Market size and forecast 2025-2030

Chart on Brazil - Market size and forecast 2025-2030 ($ million)
Data Table on Brazil - Market size and forecast 2025-2030 ($ million)
Chart on Brazil - Year-over-year growth 2025-2030 (%)
Data Table on Brazil - Year-over-year growth 2025-2030 (%)

12.6.2 Israel - Market size and forecast 2025-2030

Chart on Israel - Market size and forecast 2025-2030 ($ million)
Data Table on Israel - Market size and forecast 2025-2030 ($ million)
Chart on Israel - Year-over-year growth 2025-2030 (%)
Data Table on Israel - Year-over-year growth 2025-2030 (%)

12.6.3 South Africa - Market size and forecast 2025-2030

Chart on South Africa - Market size and forecast 2025-2030 ($ million)
Data Table on South Africa - Market size and forecast 2025-2030 ($ million)
Chart on South Africa - Year-over-year growth 2025-2030 (%)
Data Table on South Africa - Year-over-year growth 2025-2030 (%)

12.6.4 Saudi Arabia - Market size and forecast 2025-2030

Chart on Saudi Arabia - Market size and forecast 2025-2030 ($ million)
Data Table on Saudi Arabia - Market size and forecast 2025-2030 ($ million)
Chart on Saudi Arabia - Year-over-year growth 2025-2030 (%)
Data Table on Saudi Arabia - Year-over-year growth 2025-2030 (%)

12.6.5 UAE - Market size and forecast 2025-2030

Chart on UAE - Market size and forecast 2025-2030 ($ million)
Data Table on UAE - Market size and forecast 2025-2030 ($ million)
Chart on UAE - Year-over-year growth 2025-2030 (%)
Data Table on UAE - Year-over-year growth 2025-2030 (%)

12.6.6 Argentina - Market size and forecast 2025-2030

Chart on Argentina - Market size and forecast 2025-2030 ($ million)
Data Table on Argentina - Market size and forecast 2025-2030 ($ million)
Chart on Argentina - Year-over-year growth 2025-2030 (%)
Data Table on Argentina - Year-over-year growth 2025-2030 (%)

12.6.7 Turkey - Market size and forecast 2025-2030

Chart on Turkey - Market size and forecast 2025-2030 ($ million)
Data Table on Turkey - Market size and forecast 2025-2030 ($ million)
Chart on Turkey - Year-over-year growth 2025-2030 (%)
Data Table on Turkey - Year-over-year growth 2025-2030 (%)

12.6.8 Egypt - Market size and forecast 2025-2030

Chart on Egypt - Market size and forecast 2025-2030 ($ million)
Data Table on Egypt - Market size and forecast 2025-2030 ($ million)
Chart on Egypt - Year-over-year growth 2025-2030 (%)
Data Table on Egypt - Year-over-year growth 2025-2030 (%)

12.7 Market opportunity by geography

Market opportunity by geography ($ million)
Data Tables on Market opportunity by geography ($ million)

13. Drivers, Challenges, and Opportunity

13.1 Market drivers

Escalating research and development investments as primary catalyst
Strategic shift towards outsourcing for enhanced operational efficiency and expertise
Navigating increasing clinical trial complexity and stringent regulatory landscapes

13.2 Market challenges

Acute talent shortage and workforce management pressures
Intensifying pricing pressure and margin erosion
Upholding data integrity and security in digitalized clinical environment

13.3 Impact of drivers and challenges

Impact of drivers and challenges in 2025 and 2030

13.4 Market opportunities

Ascent of decentralized and hybrid clinical trial models
Pervasive integration of artificial intelligence and real world evidence
Evolution towards strategic partnerships and intensified market consolidation

14. Competitive Landscape

14.1 Overview

14.2

Overview on criticality of inputs and factors of differentiation

14.3 Landscape disruption

Overview on factors of disruption

14.4 Industry risks

Impact of key risks on business

15. Competitive Analysis

15.1 Companies profiled

Companies covered

15.2 Company ranking index

15.3 Market positioning of companies

Matrix on companies position and classification

15.4 BioAgile Therapeutics Pvt. Ltd.

BioAgile Therapeutics Pvt. Ltd. - Overview
BioAgile Therapeutics Pvt. Ltd. - Product / Service
BioAgile Therapeutics Pvt. Ltd. - Key offerings
SWOT

15.5 Charles River Laboratories International Inc.

Charles River Laboratories International Inc. - Overview
Charles River Laboratories International Inc. - Business segments
Charles River Laboratories International Inc. - Key offerings
Charles River Laboratories International Inc. - Segment focus
SWOT

15.6 CTI Clinical Trial and Consulting Inc.

CTI Clinical Trial and Consulting Inc. - Overview
CTI Clinical Trial and Consulting Inc. - Product / Service
CTI Clinical Trial and Consulting Inc. - Key offerings
SWOT

15.7 Ergomed Plc

Ergomed Plc - Overview
Ergomed Plc - Product / Service
Ergomed Plc - Key offerings
SWOT

15.8 Eurofins Scientific SE

Eurofins Scientific SE - Overview
Eurofins Scientific SE - Business segments
Eurofins Scientific SE - Key offerings
Eurofins Scientific SE - Segment focus
SWOT

15.9 ICON plc

ICON plc - Overview
ICON plc - Product / Service
ICON plc - Key offerings
SWOT

15.10 IQVIA Holdings Inc.

IQVIA Holdings Inc. - Overview
IQVIA Holdings Inc. - Business segments
IQVIA Holdings Inc. - Key offerings
IQVIA Holdings Inc. - Segment focus
SWOT

15.11 Laboratory Holdings Inc.

Laboratory Holdings Inc. - Overview
Laboratory Holdings Inc. - Business segments
Laboratory Holdings Inc. - Key news
Laboratory Holdings Inc. - Key offerings
Laboratory Holdings Inc. - Segment focus
SWOT

15.12 Medpace Holdings Inc.

Medpace Holdings Inc. - Overview
Medpace Holdings Inc. - Product / Service
Medpace Holdings Inc. - Key offerings
SWOT

15.13 Novotech Health Holdings

Novotech Health Holdings - Overview
Novotech Health Holdings - Product / Service
Novotech Health Holdings - Key offerings
SWOT

15.14 Parexel International Corp.

Parexel International Corp. - Overview
Parexel International Corp. - Product / Service
Parexel International Corp. - Key offerings
SWOT

15.15 Syneos Health Inc.

Syneos Health Inc. - Overview
Syneos Health Inc. - Product / Service
Syneos Health Inc. - Key offerings
SWOT

15.16 Thermo Fisher Scientific Inc.

Thermo Fisher Scientific Inc. - Overview
Thermo Fisher Scientific Inc. - Business segments
Thermo Fisher Scientific Inc. - Key news
Thermo Fisher Scientific Inc. - Key offerings
Thermo Fisher Scientific Inc. - Segment focus
SWOT

15.17 Worldwide Clinical Trials Holdings Inc.

Worldwide Clinical Trials Holdings Inc. - Overview
Worldwide Clinical Trials Holdings Inc. - Product / Service
Worldwide Clinical Trials Holdings Inc. - Key offerings
SWOT

15.18 WuXi AppTec Co. Ltd.

WuXi AppTec Co. Ltd. - Overview
WuXi AppTec Co. Ltd. - Business segments
WuXi AppTec Co. Ltd. - Key offerings
WuXi AppTec Co. Ltd. - Segment focus
SWOT

16. Appendix

16.1 Scope of the report

Market definition
Objectives
Notes and caveats

16.2 Inclusions and exclusions checklist

Inclusions checklist
Exclusions checklist

16.3 Currency conversion rates for US$

16.4 Research methodology

16.5 Data procurement

Information sources

16.6 Data validation

16.7 Validation techniques employed for market sizing

16.8 Data synthesis

16.9 360 degree market analysis

16.10 List of abbreviations

Research Methodology

Technavio presents a detailed picture of the market by way of study, synthesis, and summation of data from multiple sources. The analysts have presented the various facets of the market with a particular focus on identifying the key industry influencers. The data thus presented is comprehensive, reliable, and the result of extensive research, both primary and secondary.

INFORMATION SOURCES

Primary sources

  • Manufacturers and suppliers
  • Channel partners
  • Industry experts
  • Strategic decision makers

Secondary sources

  • Industry journals and periodicals
  • Government data
  • Financial reports of key industry players
  • Historical data
  • Press releases

DATA ANALYSIS

Data Synthesis

  • Collation of data
  • Estimation of key figures
  • Analysis of derived insights

Data Validation

  • Triangulation with data models
  • Reference against proprietary databases
  • Corroboration with industry experts

REPORT WRITING

Qualitative

  • Market drivers
  • Market challenges
  • Market trends
  • Five forces analysis

Quantitative

  • Market size and forecast
  • Market segmentation
  • Geographical insights
  • Competitive landscape

Interested in this report?

Get your sample now to see our research methodology and insights!

Download Now

Frequently Asked Questions

Contract Research Organization (CRO) market growth will increase by USD 51874.2 million during 2026-2030.

The Contract Research Organization (CRO) market is expected to grow at a CAGR of 8.9% during 2026-2030.

Contract Research Organization (CRO) market is segmented by Application (Clinical research, Early phase development, Laboratory, Regulatory consulting) End-user (Pharmaceutical and biopharmaceutical companies, Medical device companies, Academic institutes) Therapeutic area (Oncology, Cardiovascular diseases, CNS disorders, Infectious diseases, Others)

Berries Health and Genetics, BioAgile Therapeutics Pvt. Ltd., Charles River Laboratories International Inc., CTI Clinical Trial and Consulting Inc., Diagnostic Laboratory Services Inc., EmVenio Research, Ergomed Plc, Eurofins Scientific SE, Hangzhou Tigermed Consulting Co. Ltd., ICON plc, IQVIA Holdings Inc., Laboratory Holdings Inc., Medpace Holdings Inc., Novotech Health Holdings, Parexel International Corp., Pharmaron Beijing Co. Ltd., Syneos Health Inc., Thermo Fisher Scientific Inc., Worldwide Clinical Trials Holdings Inc., WuXi AppTec Co. Ltd. are a few of the key vendors in the Contract Research Organization (CRO) market.

North America will register the highest growth rate of 38.2% among the other regions. Therefore, the Contract Research Organization (CRO) market in North America is expected to garner significant business opportunities for the vendors during the forecast period.

US, Canada, Mexico, Germany, UK, France, Italy, Spain, Switzerland, China, Japan, India, South Korea, Singapore, Taiwan, Brazil, Israel, South Africa, Saudi Arabia, UAE, Argentina, Turkey, Egypt

  • Escalating research and development investments as primary catalyst is the driving factor this market.

The Contract Research Organization (CRO) market vendors should focus on grabbing business opportunities from the Application segment as it accounted for the largest market share in the base year.