
Bone And Joint Supplement Market Size and Growth Forecast 2026-2030
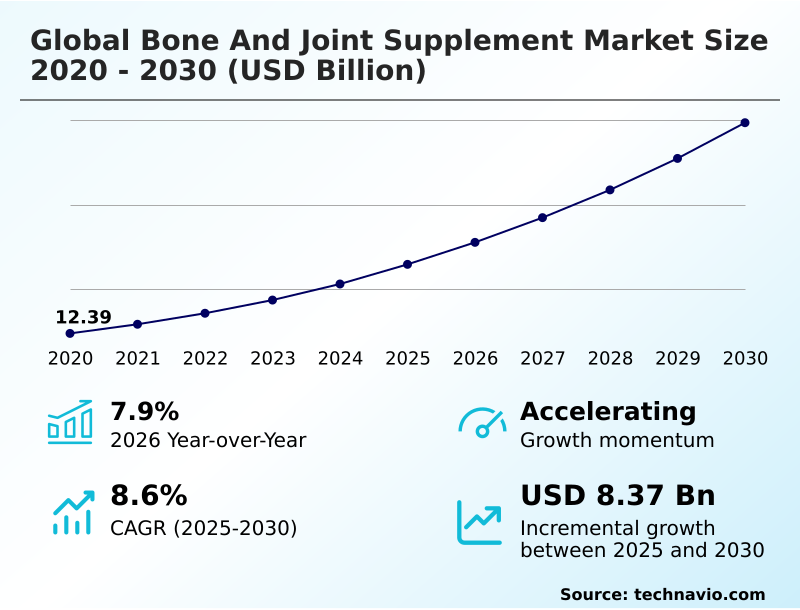
The Bone And Joint Supplement Market size was valued at USD 16.47 billion in 2025 growing at a CAGR of 8.6% during the forecast period 2026-2030.
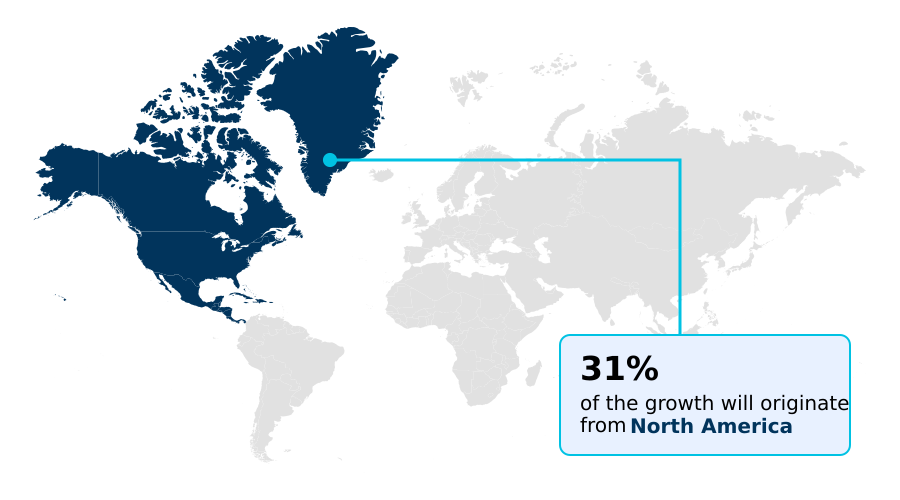
North America accounts for 31.2% of incremental growth during the forecast period. The Vitamins and minerals segment by Product was valued at USD 5.17 billion in 2024, while the Tablets segment holds the largest revenue share by Formulation.
The market is projected to grow by USD 12.45 billion from 2020 to 2030, with USD 8.37 billion of the growth expected during the forecast period of 2025 to 2030.
Get Key Insights on Market Forecast (PDF) Request Free Sample
Bone And Joint Supplement Market Overview
The bone and joint supplement market is expanding, driven by an aging global population and a growing emphasis on preventive healthcare among younger, active consumers. Demand for proven ingredients that support bone mineral density and joint lubrication is increasing, leading to significant innovation in product formulation and delivery systems. For instance, a contract manufacturing facility implementing advanced quality control for a new hydrolyzed collagen peptide formula can achieve higher purity and better molecular weight profiles, improving nutrient bioavailability. This enhancement in product efficacy, compliant with United States Pharmacopeia standards, allows the brand to secure premium placement in major retail channels and justify a higher price point, capturing a larger share of the health-conscious consumer segment. North America is set to contribute approximately 31.2% of the market's incremental growth, reflecting the region's strong consumer awareness and high disposable income, which supports the adoption of advanced joint support nutrients and cartilage health supplements.
Drivers, Trends, and Challenges in the Bone And Joint Supplement Market
The global bone and joint supplement market navigates a complex operational landscape where formulation efficacy and regulatory adherence are paramount.
The financial investment required to develop and validate a new vegan collagen precursor for joint cartilage repair is significantly higher than that for a standard glucosamine and chondroitin formula, a decision influenced by the demand for plant-based supplements for joint health.
Manufacturers must balance innovation with the high costs of compliance with bodies like the European Food Safety Authority, which demands extensive clinical data for any health claims.
In practice, a company aiming for clean label transparency might implement blockchain technology to trace turmeric extract for joint inflammation from the farm to the finished capsule, ensuring adherence to non-GMO and organic standards. This strategy directly addresses consumer demand for natural supplements for bone density and ethical sourcing.
With the market growing at a 7.9% year-over-year rate, companies that successfully manage these dynamics by offering clinically supported, transparently sourced products, such as supplements for osteoarthritis pain relief, are best positioned for success.
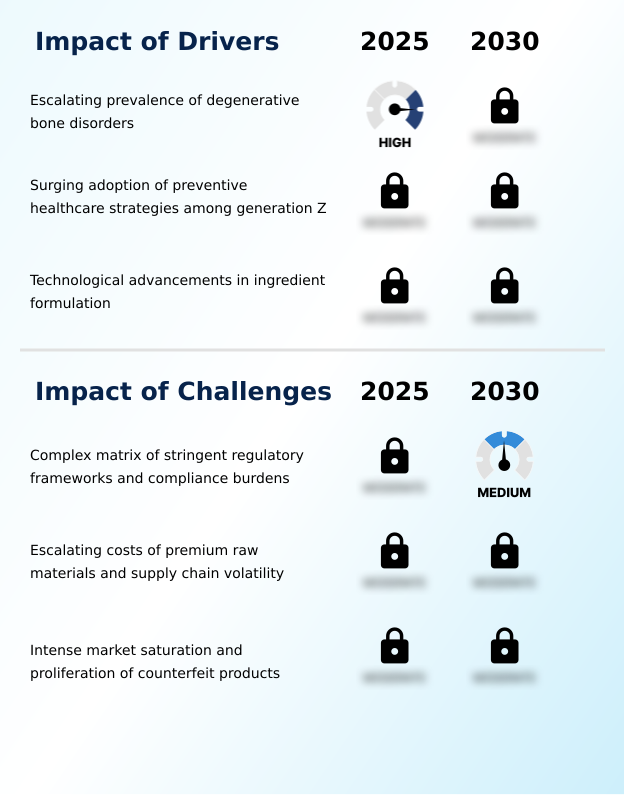
Primary Growth Driver: The escalating prevalence of degenerative bone disorders, such as osteoarthritis and osteoporosis, serves as a primary driver for market expansion.
The market's expansion is propelled by two powerful demographic forces. Firstly, the globally aging population creates a sustained demand for products addressing age-related degenerative conditions like osteoarthritis and osteoporosis, fueling sales of foundational supplements containing calcium, vitamin D, and glucosamine.
Secondly, a paradigm shift is occurring among younger consumers, particularly millennials and Generation Z, who are proactively adopting supplements for preventive care.
This demographic seeks functional products for exercise recovery, such as those containing hydrolyzed collagen and hyaluronic acid, to maintain long-term mobility and athletic performance.
The higher market growth rate in Asia, at 9.8% CAGR, illustrates the global nature of these drivers, as rising health consciousness transcends regional boundaries and fuels demand for effective joint and bone health solutions.
Emerging Market Trend: The rise of plant-based and vegan nutritional formulations marks a significant upcoming market trend. This shift is reshaping product development and supply chain strategies across the industry.
Key trends are reshaping the market as consumers demand more than generic formulations. The integration of personalized nutrition, facilitated by at-home biomarker analysis and DNA testing, allows for the creation of customized supplement regimens tailored to an individual's specific needs for bone density and joint support. This data-driven approach moves the industry toward precision wellness.
Simultaneously, the demand for clean label transparency is compelling manufacturers to eliminate synthetic additives and disclose the full sourcing journey of ingredients like marine collagen and turmeric. This push for purity and traceability, often verified by third-party certifications, builds consumer trust and loyalty.
The growth of the online sales channel, which is expanding faster than offline retail, serves as a critical enabler for these trends, connecting consumers directly with brands that offer personalized and transparent solutions.
Key Industry Challenge: A complex matrix of stringent regulatory frameworks and varied compliance burdens across different regions presents a key challenge affecting industry growth and market entry.
Intense market saturation and the proliferation of counterfeit goods present significant challenges to legitimate manufacturers. The low barrier to entry for online retail has flooded the market with innumerable brands, leading to consumer confusion and brand fatigue.
This forces companies to allocate substantial budgets to marketing and securing third-party certifications like those from the United States Pharmacopeia (USP) to differentiate their products. Moreover, the presence of counterfeit supplements with ineffective or harmful ingredients erodes consumer trust across the entire category.
Brands must invest in anti-counterfeiting technologies, such as blockchain for supply chain transparency, and navigate a complex web of international regulations to protect their intellectual property and ensure consumer safety, adding significant operational costs and complexity.
Explore Full Market Dynamics Analysis Request Free Sample
Bone And Joint Supplement Market Segmentation
The bone and joint supplement industry research report provides comprehensive data including region-wise segment analysis, with forecasts and analysis for the period 2026-2030, as well as historical data from 2020-2024 for the following segments.
Product Segment Analysis
The vitamins and minerals segment is estimated to witness significant growth during the forecast period.
The vitamins and minerals segment forms the foundational bedrock of the bone and joint supplement market, driven by its indispensable role in maintaining skeletal integrity and supporting overall cartilage health.
Calcium and vitamin D remain central to product formulation, but development now emphasizes synergistic nutrient bioavailability to maximize efficacy. Formulations often include vitamin K2 for proper calcium utilization and magnesium to support bone mineral density.
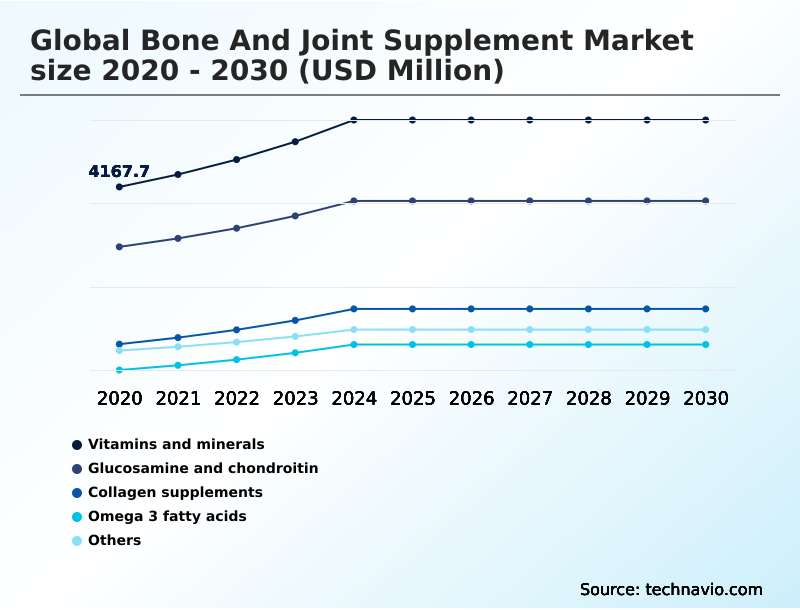
This segment, which stood at USD 5566.9 million in 2021, is critical for preventative healthcare, particularly for aging demographics susceptible to osteopenia.
Manufacturers focus on improving the consumer experience with bioavailable forms like calcium citrate, addressing the core needs for structural support and mitigating bone resorption, establishing these nutrients as the first line of defense in preserving lifelong mobility.
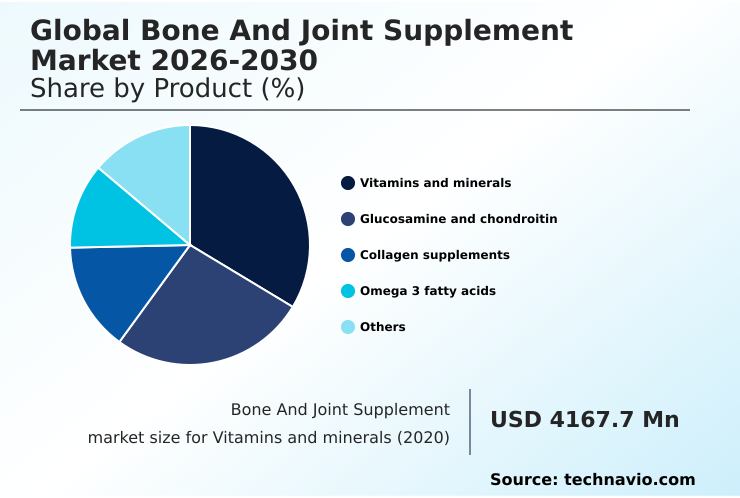
The Vitamins and minerals segment was valued at USD 5.17 billion in 2024 and showed a gradual increase during the forecast period.
Bone And Joint Supplement Market by Region: North America Leads with 31.2% Growth Share
North America is estimated to contribute 31.2% to the growth of the global market during the forecast period.
The geographic landscape of the market is diverse, with North America and Europe representing mature but steadily growing regions, while Asia is experiencing the most rapid expansion.
North America is projected to account for 31.16% of market growth, driven by high consumer awareness and a robust sports nutrition sector that incorporates joint support ingredients.
In contrast, Asia, contributing 27.88% to growth, is fueled by an expanding middle class, rising disposable incomes, and a cultural integration of traditional medicine with modern nutritional science, creating demand for formulas with boswellia serrata and other botanicals.
European markets are defined by stringent regulations from bodies like the European Food Safety Authority, pushing demand for clean-label, certified-organic products.
This regional divergence requires manufacturers to tailor their product strategies, from ingredient sourcing to marketing, to align with local preferences and regulatory standards for compounds affecting bone resorption and cartilage health.
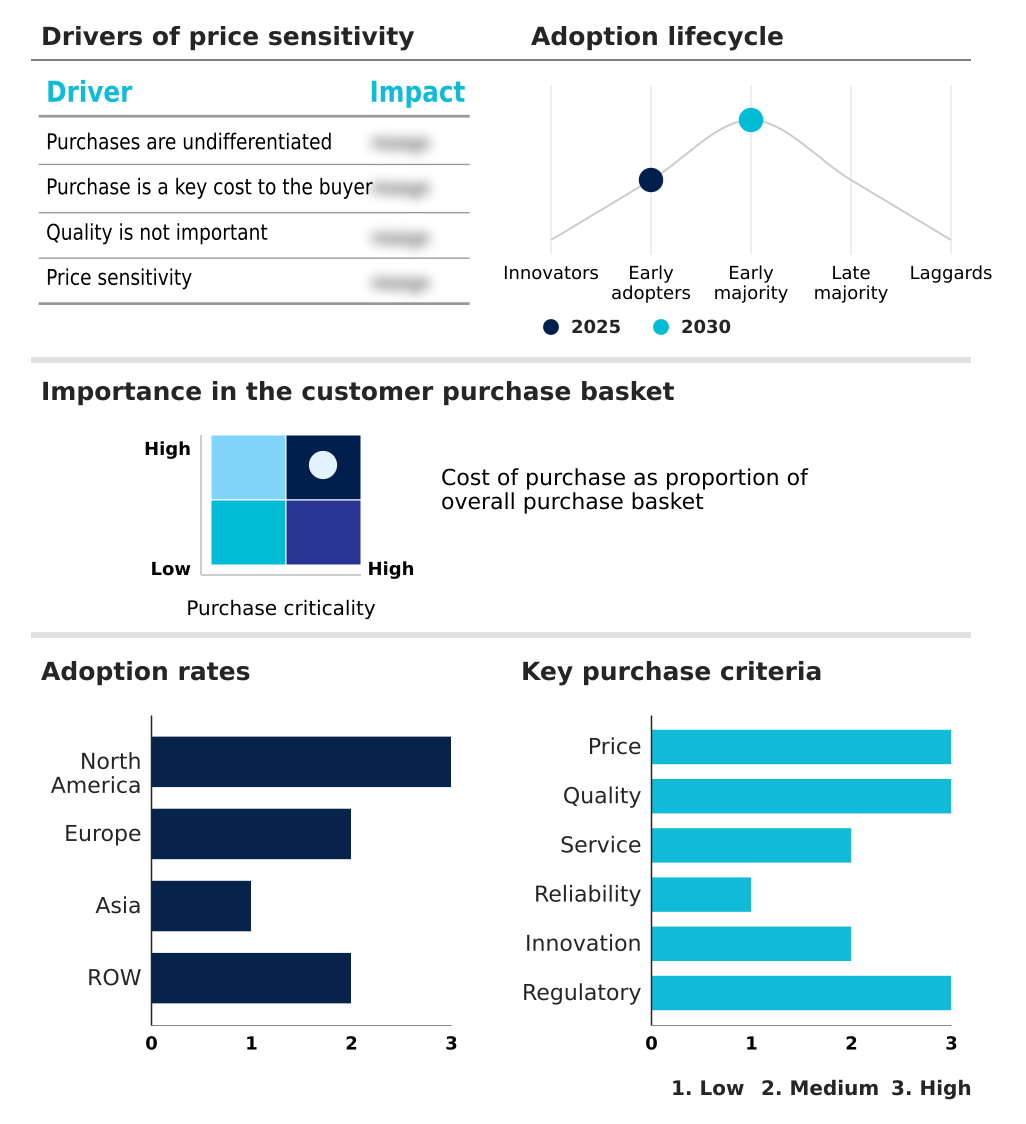
Customer Landscape Analysis for the Bone And Joint Supplement Market
The bone and joint supplement market forecasting report includes the adoption lifecycle of the market, covering from the innovator’s stage to the laggard’s stage. It focuses on adoption rates in different regions based on penetration. Furthermore, the bone and joint supplement market report also includes key purchase criteria and drivers of price sensitivity to help companies evaluate and develop their market growth analysis strategies.
Competitive Landscape of the Bone And Joint Supplement Market
Companies are implementing various strategies, such as strategic alliances, partnerships, mergers and acquisitions, geographical expansion, and product/service launches, to enhance their presence in the bone and joint supplement market industry.
Abbott Laboratories - The company provides a diverse range of nutritional products, including specialized formulas designed to support and maintain bone health as part of a comprehensive wellness strategy.
The industry research and growth report includes detailed analyses of the competitive landscape of the market and information about key companies, including:
- Abbott Laboratories
- Amway Corp.
- Bayer AG
- Blackmores Ltd.
- Gaia Herbs Inc.
- Haleon Plc
- Herbalife International Inc.
- Jarrow Formulas Inc.
- Life Extension
- Natures Way Brands LLC
- Nordic Naturals Inc.
- NOW Health Group Inc.
- Nutramax Laboratories Inc.
- Otsuka Holdings Co. Ltd.
- Procter and Gamble Co.
- Reckitt Benckiser Group Plc
- Sanofi SA
- Swisse
- Thorne HealthTech Inc.
- Vitafusion
Qualitative and quantitative analysis of companies has been conducted to help clients understand the wider business environment as well as the strengths and weaknesses of key industry players. Data is qualitatively analyzed to categorize companies as pure play, category-focused, industry-focused, and diversified; it is quantitatively analyzed to categorize companies as dominant, leading, strong, tentative, and weak.
Recent Developments in the Bone And Joint Supplement Market
- In August 2025, FitLife Brands completed the acquisition of substantially all assets of Irwin Naturals, a well-known U.S. supplement brand, in a deal valued at USD 42.5 million.
- In April 2025, Juvent Health introduced HydroxyBMD3 at the National Bone Health and Osteoporosis Foundation Symposium 2025 in Washington, D.C., as an advanced bone-support supplement system.
- In April 2025, Qualia Life Sciences introduced a new product, Qualia Joint Health, designed to support joint mobility, cartilage function, and inflammation management with ingredients like collagen peptides and hyaluronic acid.
- In March 2025, Herbalife announced plans to acquire personalized nutrition companies, including Pruvit and Link BioSciences, to strengthen its capabilities in data-driven supplement formulation.
Research Analyst Overview: Bone And Joint Supplement Market
Boardroom decisions are increasingly centered on R&D investment in advanced delivery systems to differentiate products in a crowded marketplace. The vitamins and minerals segment's dominance underscores the continued consumer trust in foundational nutrients, but the future lies in enhancing their efficacy.
For instance, developing a liposomal-encapsulated calcium and vitamin D3 formulation allows a brand to command a premium price by marketing superior nutrient bioavailability and absorption, a key factor for consumers seeking to improve bone mineral density. This strategy directly addresses the need for more effective solutions for age-related bone resorption.
Investing in clinical trials to validate claims related to joint lubrication or cartilage health, and securing certifications from bodies like the National Sanitation Foundation (NSF), are becoming standard practice to build credibility. Such strategic moves are crucial for capturing share in a market where consumers are scrutinizing the science behind joint support nutrients and other active ingredients.
Dive into Technavio’s robust research methodology, blending expert interviews, extensive data synthesis, and validated models for unparalleled Bone And Joint Supplement Market insights. See full methodology.
| Market Scope | |
|---|---|
| Page number | 305 |
| Base year | 2025 |
| Historic period | 2020-2024 |
| Forecast period | 2026-2030 |
| Growth momentum & CAGR | Accelerate at a CAGR of 8.6% |
| Market growth 2026-2030 | USD 8368.1 million |
| Market structure | Fragmented |
| YoY growth 2025-2026(%) | 7.9% |
| Key countries | US, Canada, Mexico, Germany, UK, France, Italy, The Netherlands, Spain, Russia, China, Japan, India, South Korea, Indonesia, Thailand, Singapore, Australia, Brazil, UAE, South Africa, Saudi Arabia and Turkey |
| Competitive landscape | Leading Companies, Market Positioning of Companies, Competitive Strategies, and Industry Risks |
Bone And Joint Supplement Market: Key Questions Answered in This Report
-
What is the expected growth of the Bone And Joint Supplement Market between 2026 and 2030?
-
The Bone And Joint Supplement Market is expected to grow by USD 8.37 billion during 2026-2030, registering a CAGR of 8.6%. Year-over-year growth in 2026 is estimated at 7.9%%. This acceleration is shaped by escalating prevalence of degenerative bone disorders, which is intensifying demand across multiple end-use verticals covered in the report.
-
-
What segmentation does the market report cover?
-
The report is segmented by Product (Vitamins and minerals, Glucosamine and chondroitin, Collagen supplements, Omega 3 fatty acids, and Others), Formulation (Tablets, Capsules and softgels, Powders, Gummies and chewable, and Liquids), Distribution Channel (Offline, and Online) and Geography (North America, Europe, Asia, Rest of World (ROW)). Among these, the Vitamins and minerals segment is estimated to witness significant growth during the forecast period, driven by rising adoption across key application areas. Each segment includes detailed qualitative and quantitative analysis, along with historical data from 2020-2024 and forecasts through 2030 with year-over-year growth rates.
-
-
Which regions are analyzed in the report?
-
The report covers North America, Europe, Asia and Rest of World (ROW). North America is estimated to contribute 31.2% to market growth during the forecast period. Country-level analysis includes US, Canada, Mexico, Germany, UK, France, Italy, The Netherlands, Spain, Russia, China, Japan, India, South Korea, Indonesia, Thailand, Singapore, Australia, Brazil, UAE, South Africa, Saudi Arabia and Turkey, with dedicated market size tables and year-over-year growth for each.
-
-
What are the key growth drivers and market challenges?
-
The primary driver is escalating prevalence of degenerative bone disorders, which is accelerating investment and industry demand. The main challenge is complex matrix of stringent regulatory frameworks and compliance burdens, creating operational barriers for key market participants. The report quantifies the impact of each driver and challenge across 2026 and 2030 with comparative analysis.
-
-
Who are the major players in the Bone And Joint Supplement Market?
-
Key vendors include Abbott Laboratories, Amway Corp., Bayer AG, Blackmores Ltd., Gaia Herbs Inc., Haleon Plc, Herbalife International Inc., Jarrow Formulas Inc., Life Extension, Natures Way Brands LLC, Nordic Naturals Inc., NOW Health Group Inc., Nutramax Laboratories Inc., Otsuka Holdings Co. Ltd., Procter and Gamble Co., Reckitt Benckiser Group Plc, Sanofi SA, Swisse, Thorne HealthTech Inc. and Vitafusion. The report provides qualitative and quantitative analysis categorizing companies as dominant, leading, strong, tentative, and weak based on their market positioning. Company profiles include business segment analysis, SWOT assessment, key offerings, and recent strategic developments.
-
Bone And Joint Supplement Market Research Insights
Market dynamics are shaped by a consumer shift toward proactive health management, creating demand for scientifically backed formulations that offer enhanced nutrient bioavailability. The proliferation of appealing consumption formats, such as chewable gummies and functional powders, is expanding the user base beyond traditional elderly demographics to include younger, active individuals focused on exercise recovery and long-term mobility.
This trend is compelling manufacturers to innovate beyond standard tablets. For instance, securing a National Sanitation Foundation certification provides a competitive edge in a saturated market, signaling superior quality control. The gummies and chewable segment is growing faster than tablets, reflecting a clear preference for user-friendly and palatable options.
This evolution highlights a move from reactive treatment to a holistic, preventative approach to skeletal wellness.
We can help! Our analysts can customize this bone and joint supplement market research report to meet your requirements.
 RIA -
RIA - 
