Bovine Colostrum Market Analysis, Size, and Forecast 2025-2029: North America (US, Canada, and Mexico), Europe (Germany, France, and UK), APAC (China, India, and Japan), South America (Brazil), Middle East and Africa (UAE, Saudi Arabia, and South Africa), Asia, Rest of World (ROW)

Bovine Colostrum Market Analysis, Size, and Forecast 2025-2029:
North America (US, Canada, and Mexico), Europe (Germany, France, and UK), APAC (China, India, and Japan), South America (Brazil), Middle East and Africa (UAE, Saudi Arabia, and South Africa), Asia, Rest of World (ROW)

Published: Dec 2025 295 Pages SKU: IRTNTR81146

Market Overview at a Glance

$607.3 Mn
Market Opportunity
5.6%
CAGR 2024 - 2029
34.9%
North America Growth
$837.8 Mn
Whole colostrum powder segment 2023

Bovine Colostrum Market Size 2025-2029

The bovine colostrum market size is valued to increase by USD 607.3 million, at a CAGR of 5.6% from 2024 to 2029. Growing consumer focus on preventative health and natural ingredients will drive the bovine colostrum market.

Major Market Trends & Insights

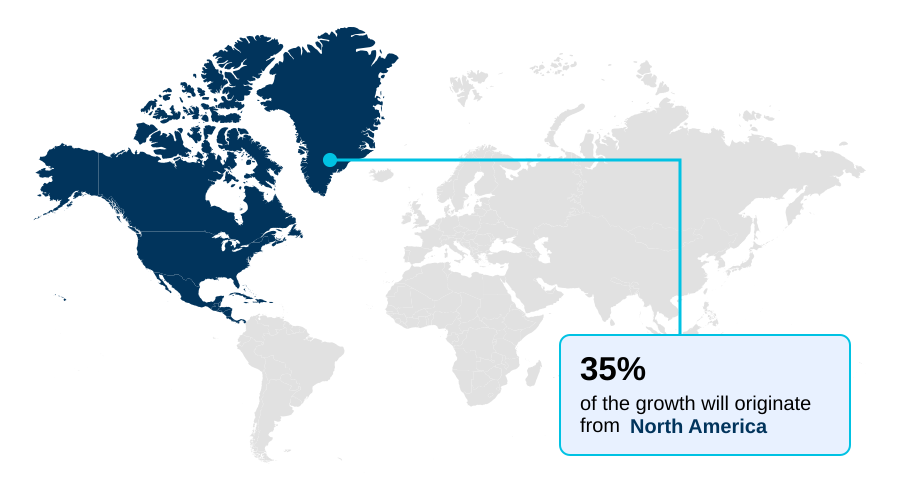
  • North America dominated the market and accounted for a 34.9% growth during the forecast period.
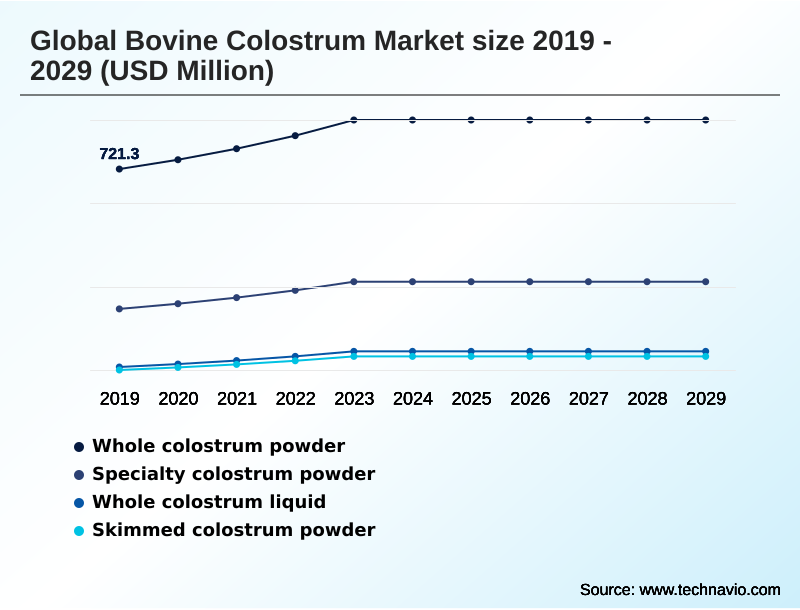
  • By Product - Whole colostrum powder segment was valued at USD 837.8 million in 2023
  • By Type - Conventional segment accounted for the largest market revenue share in 2023

Market Size & Forecast

  • Market Opportunities: USD 954 million
  • Market Future Opportunities: USD 607.3 million
  • CAGR from 2024 to 2029 : 5.6%

Market Summary

  • The bovine colostrum market is experiencing sustained expansion, driven by a profound consumer shift toward preventative healthcare and natural wellness solutions. With its dense profile of immunoglobulins, lactoferrin, and other bioactive components, bovine colostrum is well-positioned to meet the demand for supplements that support immune function and gastrointestinal health.
  • This is leading to diversification beyond traditional capsules into applications like sports nutrition recovery, functional food fortification, and nutricosmetics. A key business scenario involves nutraceutical firms navigating the complexities of the supply chain. Companies must balance ethical sourcing policies, such as calf-first protocols, with the need for a consistent supply of high-potency raw material.
  • This requires implementing rigorous quality control systems to verify immunoglobulin g (igg) concentration and ensure the absence of contaminants. Such measures, while increasing operational costs, are crucial for building brand trust and complying with varied international standards, directly impacting production planning and final product positioning in a competitive landscape.

What will be the Size of the Bovine Colostrum Market during the forecast period?

Get Key Insights on Market Forecast (PDF) Request Free Sample

How is the Bovine Colostrum Market Segmented?

The bovine colostrum industry research report provides comprehensive data (region-wise segment analysis), with forecasts and estimates in "USD million" for the period 2025-2029, as well as historical data from 2019-2023 for the following segments.

  • Product
    • Whole colostrum powder
    • Specialty colostrum powder
    • Whole colostrum liquid
    • Skimmed colostrum powder
  • Type
    • Conventional
    • Organic
  • Application
    • Dietary supplement
    • Animal nutrition
    • Sports nutrition
    • Functional food
    • Others
  • Geography
    • North America
      • US
      • Canada
      • Mexico
    • Europe
      • Germany
      • France
      • UK
    • Asia
    • Rest of World (ROW)

By Product Insights

The whole colostrum powder segment is estimated to witness significant growth during the forecast period.

Whole colostrum powder remains the cornerstone of the bovine colostrum market, aligning with robust consumer demand for natural, whole-food nutritional solutions. Its complete matrix of bioactive components, including immunoglobulins and growth factors, offers synergistic benefits that isolated constituents lack.

This segment’s versatility in application, from dietary supplements to functional food fortification, underpins its market dominance. Advanced processing like low-temperature spray drying is critical for preserving its delicate molecular structure.

Formulations are increasingly standardized for potency, with some specialty powders guaranteeing an immunoglobulin g (igg) concentration of 40%, reflecting a maturing market focused on quantifiable efficacy and clean-label supplements.

The emphasis on ethical sourcing policies further strengthens its appeal to a conscientious consumer base.

Request Free Sample

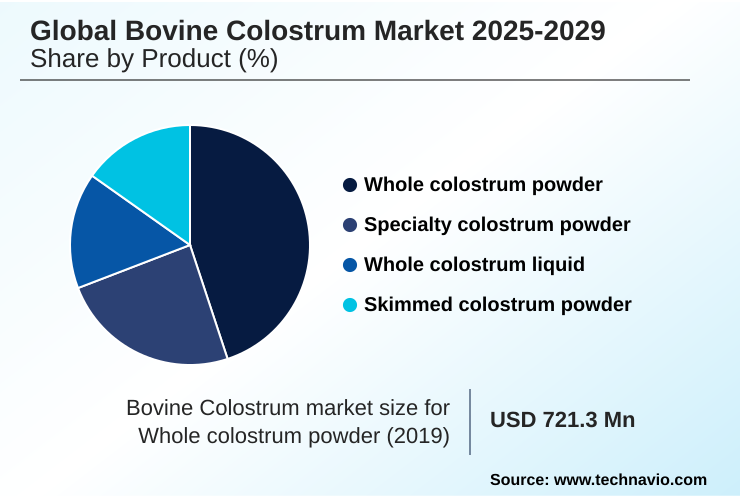
The Whole colostrum powder segment was valued at USD 837.8 million in 2023 and showed a gradual increase during the forecast period.

Request Free Sample

Regional Analysis

North America is estimated to contribute 34.9% to the growth of the global market during the forecast period.Technavio’s analysts have elaborately explained the regional trends and drivers that shape the market during the forecast period.

See How Bovine Colostrum Market Demand is Rising in North America Request Free Sample

The geographic landscape of the bovine colostrum market is led by North America, which accounts for approximately 34.9% of the incremental growth, driven by high consumer awareness and a sophisticated retail environment.

Europe serves as a key hub for technological innovation, particularly Germany, where manufacturers specialize in advanced processing techniques. However, navigating Europe's stringent Novel Foods Regulation can increase product launch budgets by up to 40% compared to US market entry.

Asia is the fastest-growing region, with a projected CAGR of 6.0%, fueled by rising disposable incomes and a strong focus on immune health in countries like China and India.

Suppliers in Australia and New Zealand are critical to the global supply chain, exporting premium raw materials valued for their quality and traceability, essential for brands targeting these discerning international markets.

Market Dynamics

Our researchers analyzed the data with 2024 as the base year, along with the key drivers, trends, and challenges. A holistic analysis of drivers will help companies refine their marketing strategies to gain a competitive advantage.

  • When deciding how to choose a bovine colostrum supplement, consumers are increasingly weighing factors beyond price, focusing on ethical sourcing of bovine colostrum and the specific health outcomes they seek. The benefits of grass-fed bovine colostrum, with its superior nutrient profile, are a key differentiator for premium brands.
  • In the athletic sphere, the debate over colostrum vs whey protein for immunity continues, though many athletes now utilize bovine colostrum for athletic recovery due to its unique growth factors that support muscle repair.
  • For those focused on aesthetic benefits, bovine colostrum for skin and hair health is a burgeoning application within the nutricosmetics field, leveraging its role in cellular regeneration. Similarly, colostrum powder for gut health remains a primary driver, with formulations standardized for high immunoglobulin G (IgG) concentration in colostrum supplements to ensure efficacy.
  • The demand for organic bovine colostrum benefits reflects a broader clean-label trend. For businesses, emphasizing transparent and ethical practices offers a distinct advantage; companies that actively promote calf-first sourcing policies report consumer loyalty rates nearly double those of competitors, a crucial metric for long-term operational planning and brand equity.

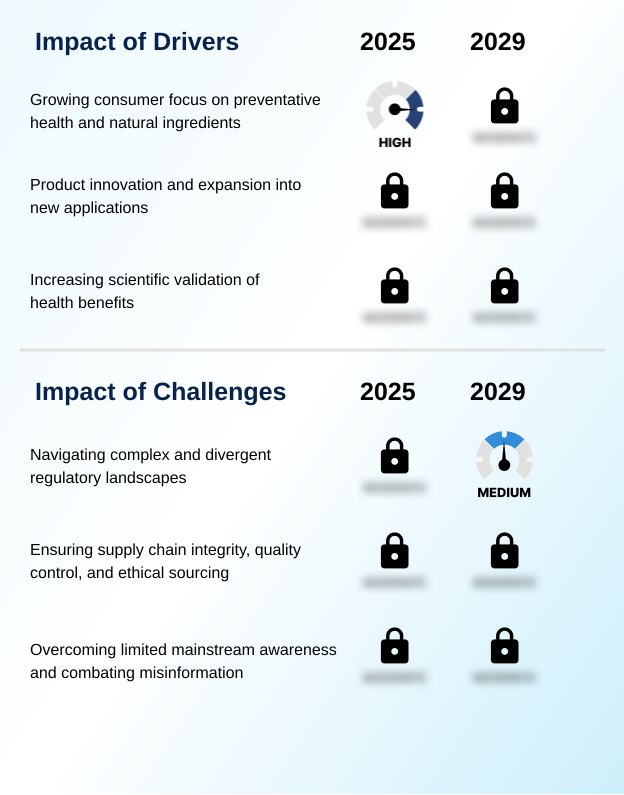
What are the key market drivers leading to the rise in the adoption of Bovine Colostrum Industry?

  • The market's growth is fundamentally driven by a profound consumer shift toward preventative healthcare and a strong preference for natural, minimally processed ingredients.

  • A powerful driver for the market is the increasing scientific validation of bovine colostrum's health benefits, which builds credibility and expands its application into medical nutrition products.
  • For instance, securing regulatory approval for a colostrum-based medical food can increase a brand's credibility score by over 50%, opening new, high-value market segments.
  • This is coupled with a profound consumer shift toward preventative health and a preference for natural ingredients.
  • Products marketed with strong ethical claims, such as those adhering to animal welfare standards and calf-first sourcing, command a price premium tolerance up to 20% higher.
  • This demand for authenticity and efficacy is fueling innovation in functional food fortification and high-potency supplements, solidifying colostrum's position as a premium wellness ingredient.

What are the market trends shaping the Bovine Colostrum Industry?

  • A defining trend is the strategic migration of bovine colostrum from niche, direct-to-consumer models into mainstream retail channels. This expansion signifies a crucial market maturation and growing acceptance by a broader consumer demographic.

  • A defining trend is the strategic expansion of bovine colostrum from niche health stores into mainstream retail and beauty channels, capitalizing on the growing beauty-from-within movement. This channel diversification, which reduces customer acquisition costs by up to 25% compared to purely online models, positions colostrum as a staple for immune modulation and gastrointestinal health.
  • The sports nutrition recovery segment has seen remarkable traction, with products containing colostrum experiencing over 150% year-on-year growth. Brands are leveraging the ingredient's unique profile of growth factors and its role in enhancing gut barrier function to appeal to athletes.
  • This mainstream acceptance is supported by a focus on clean-label supplements and transparent, ethical sourcing policies, meeting the demands of an increasingly discerning consumer base.

What challenges does the Bovine Colostrum Industry face during its growth?

  • A significant challenge impeding seamless global expansion is the complex, fragmented, and often stringent regulatory landscape that varies dramatically between regions.

  • A primary challenge is navigating divergent and complex global regulatory landscapes, which can increase product launch timelines by up to 18 months when moving between markets like the EU and the US. Furthermore, ensuring supply chain integrity and quality control for bovine colostrum presents a persistent hurdle.
  • The use of advanced manufacturing techniques like freeze-drying to preserve the bioactivity of its sensitive components can increase production costs by 35% compared to standard heat treatments. This inherent variability in raw material and the high cost of gentle processing create significant barriers to entry and add to the final product cost, impacting market accessibility.
  • These factors require substantial investment in compliance and quality assurance to maintain consumer trust and market position.

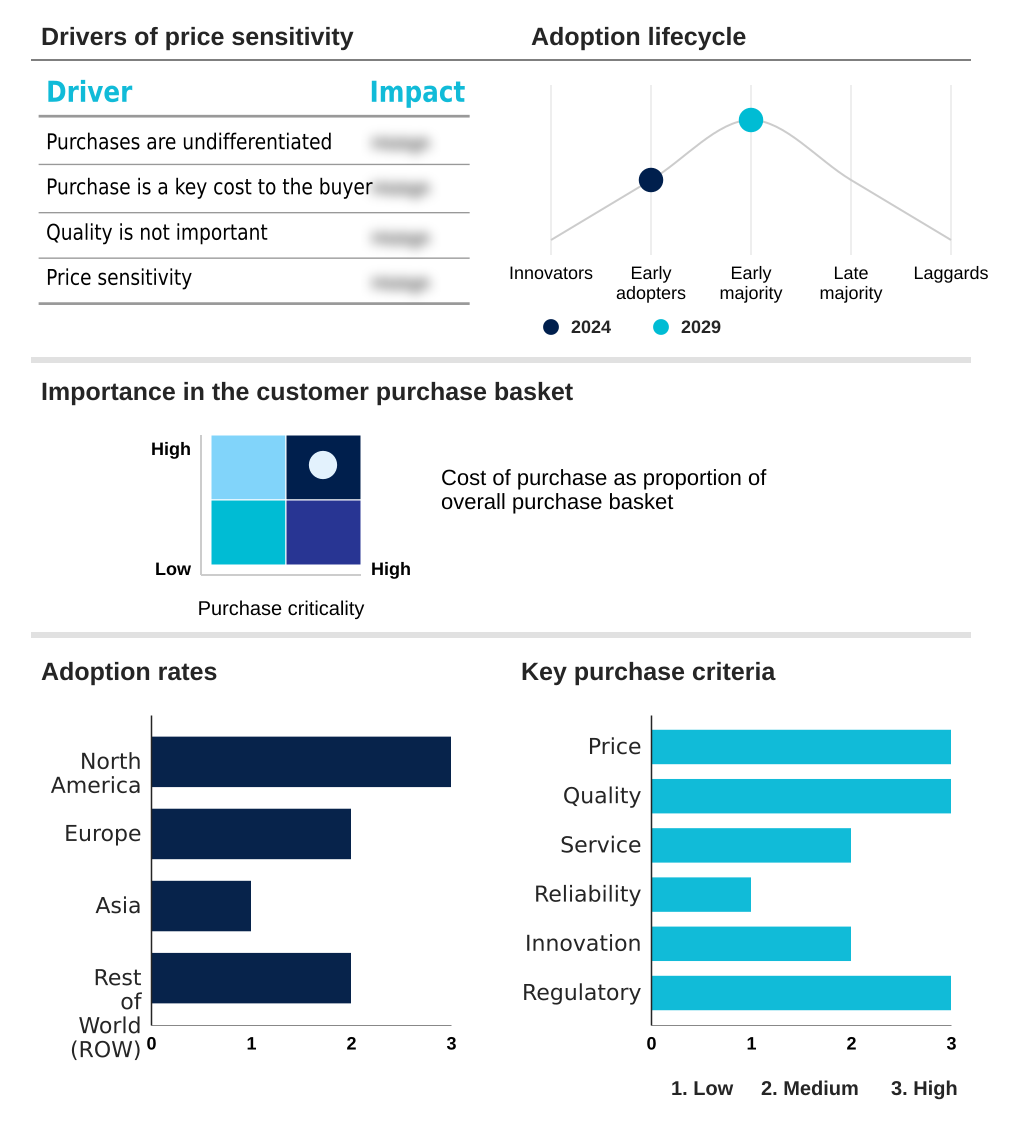
Exclusive Technavio Analysis on Customer Landscape

The bovine colostrum market forecasting report includes the adoption lifecycle of the market, covering from the innovator’s stage to the laggard’s stage. It focuses on adoption rates in different regions based on penetration. Furthermore, the bovine colostrum market report also includes key purchase criteria and drivers of price sensitivity to help companies evaluate and develop their market growth analysis strategies.

Customer Landscape of Bovine Colostrum Industry

Competitive Landscape

Companies are implementing various strategies, such as strategic alliances, bovine colostrum market forecast, partnerships, mergers and acquisitions, geographical expansion, and product/service launches, to enhance their presence in the industry.

Adapt Naturals - Formulations combine cold-processed bovine colostrum with lactoferrin and beta-glucan to enhance gut health, fortify immunity, and promote overall vitality.

The industry research and growth report includes detailed analyses of the competitive landscape of the market and information about key companies, including:

  • Adapt Naturals
  • Bloom Nu LLC
  • Codeage LLC
  • Cowboy Colostrum
  • CYMBIOTIKA LLC.
  • Double Wood Supplements
  • Elm and Rye
  • Equip Foods LLC
  • Fasted Athlete LLC.
  • Folqs s.r.o.
  • Heart and Soil
  • Miracle Moo
  • Nootrum
  • NOW Health Group Inc.
  • Rahal Biosciences Inc.
  • Sovereign Laboratories
  • Transparent Labs
  • Vital Proteins LLC
  • WonderCow Nutrition Inc.

Qualitative and quantitative analysis of companies has been conducted to help clients understand the wider business environment as well as the strengths and weaknesses of key industry players. Data is qualitatively analyzed to categorize companies as pure play, category-focused, industry-focused, and diversified; it is quantitatively analyzed to categorize companies as dominant, leading, strong, tentative, and weak.

Recent Development and News in Bovine colostrum market

  • In October 2024, ARMRA expanded its retail presence by launching its bovine colostrum products in Sprouts Farmers Market stores nationwide, marking a significant shift from a direct-to-consumer model.
  • In January 2025, Vital Proteins announced its entry into the bovine colostrum segment with the launch of its own colostrum capsules, signaling growing mainstream confidence in the market.
  • In December 2024, Swedish firm ColoPlus AB announced a collaboration with Blendhub to develop a line of colostrum-fortified porridges, expanding the application of bovine colostrum into the functional food category.
  • In January 2025, the Russian government designated dairy production as a priority for concessional loans and allocated over USD 820.5 million for industry support, a move expected to boost raw material availability for colostrum.

Dive into Technavio’s robust research methodology, blending expert interviews, extensive data synthesis, and validated models for unparalleled Bovine Colostrum Market insights. See full methodology.

Market Scope
Page number 295
Base year 2024
Historic period 2019-2023
Forecast period 2025-2029
Growth momentum & CAGR Accelerate at a CAGR of 5.6%
Market growth 2025-2029 USD 607.3 million
Market structure Fragmented
YoY growth 2024-2025(%) 5.3%
Key countries US, Canada, Mexico, Germany, France, UK, Italy, Russia, The Netherlands, Spain, China, India, Japan, Singapore, Indonesia, South Korea, Thailand, Brazil, UAE, Saudi Arabia, South Africa, Australia and Turkey
Competitive landscape Leading Companies, Market Positioning of Companies, Competitive Strategies, and Industry Risks

Request Free Sample

Research Analyst Overview

  • The bovine colostrum market is rapidly evolving from a niche wellness product to a scientifically-backed functional ingredient. This transition is marked by a significant shift toward high-potency, condition-specific formulations driven by technological advancements in processing, such as microfiltration and ultrafiltration, which preserve the integrity of bioactive components like lactoferrin and growth factors.
  • Advanced processing can increase immunoglobulin G (IgG) concentration by over 30% compared to standard methods, creating premium ingredients for targeted applications. This trend presents a critical boardroom-level decision: whether to focus on the high-volume dietary supplement market or allocate significant R&D investment toward the higher-margin medical nutrition and nutricosmetics sectors.
  • Success hinges on navigating complex supply chain logistics, including cold-chain processing and ensuring ethical calf-first sourcing, while substantiating health claims related to passive immunity and gut barrier function to gain consumer trust and regulatory approval. The ability to deliver standardized, high-efficacy products, from colostrum replacers to freeze-dried powders, will define market leadership.

What are the Key Data Covered in this Bovine Colostrum Market Research and Growth Report?

  • What is the expected growth of the Bovine Colostrum Market between 2025 and 2029?

    • USD 607.3 million, at a CAGR of 5.6%

  • What segmentation does the market report cover?

    • The report is segmented by Product (Whole colostrum powder, Specialty colostrum powder, Whole colostrum liquid, and Skimmed colostrum powder), Type (Conventional, and Organic), Application (Dietary supplement, Animal nutrition, Sports nutrition, Functional food, and Others) and Geography (North America, Europe, Asia, Rest of World (ROW))

  • Which regions are analyzed in the report?

    • North America, Europe, Asia and Rest of World (ROW)

  • What are the key growth drivers and market challenges?

    • Growing consumer focus on preventative health and natural ingredients, Navigating complex and divergent regulatory landscapes

  • Who are the major players in the Bovine Colostrum Market?

    • Adapt Naturals, Bloom Nu LLC, Codeage LLC, Cowboy Colostrum, CYMBIOTIKA LLC., Double Wood Supplements, Elm and Rye, Equip Foods LLC, Fasted Athlete LLC., Folqs s.r.o., Heart and Soil, Miracle Moo, Nootrum, NOW Health Group Inc., Rahal Biosciences Inc., Sovereign Laboratories, Transparent Labs, Vital Proteins LLC and WonderCow Nutrition Inc.

Market Research Insights

  • The market dynamics are increasingly shaped by a pivot toward evidence-based, specialized formulations and mainstream channel diversification. The growing consumer focus on preventative health and natural ingredients is driving this shift, with formulators leveraging the unique bioactive components of bovine colostrum. For instance, adoption rates in sports nutrition recovery applications have surged, with some products experiencing over 150% year-on-year growth.
  • In animal nutrition, the use of colostrum replacers to counter failure of passive transfer can reduce calf mortality rates by over 50%, a compelling ROI for agricultural operations.
  • This move toward validated, high-potency products is expanding applications into medical nutrition and nutricosmetics, where the emphasis is on measurable outcomes like enhanced gut barrier function and immune modulation, creating new avenues for market growth.

We can help! Our analysts can customize this bovine colostrum market research report to meet your requirements.

Get in touch

1. Executive Summary

1.1 Market overview

Executive Summary - Chart on Market Overview
Executive Summary - Data Table on Market Overview
Executive Summary - Chart on Global Market Characteristics
Executive Summary - Chart on Market by Geography
Executive Summary - Chart on Market Segmentation by Product
Executive Summary - Chart on Market Segmentation by Type
Executive Summary - Chart on Market Segmentation by Application
Executive Summary - Chart on Incremental Growth
Executive Summary - Data Table on Incremental Growth
Executive Summary - Chart on Company Market Positioning

2. Technavio Analysis

2.1 Analysis of price sensitivity, lifecycle, customer purchase basket, adoption rates, and purchase criteria

2.2 Criticality of inputs and Factors of differentiation

Chart on Overview on criticality of inputs and factors of differentiation

2.3 Factors of disruption

Chart on Overview on factors of disruption

2.4 Impact of drivers and challenges

Chart on Impact of drivers and challenges in 2024 and 2029

3. Market Landscape

3.1 Market ecosystem

Chart on Parent Market
Data Table on - Parent Market

3.2 Market characteristics

Chart on Market characteristics analysis

3.3 Value chain analysis

Chart on Value chain analysis

4. Market Sizing

4.1 Market definition

Data Table on Offerings of companies included in the market definition

4.2 Market segment analysis

Market segments

4.3 Market size 2024

4.4 Market outlook: Forecast for 2024-2029

Chart on Global - Market size and forecast 2024-2029 ($ million)
Data Table on Global - Market size and forecast 2024-2029 ($ million)
Chart on Global Market: Year-over-year growth 2024-2029 (%)
Data Table on Global Market: Year-over-year growth 2024-2029 (%)

5. Historic Market Size

5.1 Global Bovine Colostrum Market 2019 - 2023

Historic Market Size - Data Table on Global Bovine Colostrum Market 2019 - 2023 ($ million)

5.2 Product segment analysis 2019 - 2023

Historic Market Size - Product Segment 2019 - 2023 ($ million)

5.3 Type segment analysis 2019 - 2023

Historic Market Size - Type Segment 2019 - 2023 ($ million)

5.4 Application segment analysis 2019 - 2023

Historic Market Size - Application Segment 2019 - 2023 ($ million)

5.5 Geography segment analysis 2019 - 2023

Historic Market Size - Geography Segment 2019 - 2023 ($ million)

5.6 Country segment analysis 2019 - 2023

Historic Market Size - Country Segment 2019 - 2023 ($ million)

6. Qualitative Analysis

6.1 The AI impact on global bovine colostrum market

7. Five Forces Analysis

7.1 Five forces summary

Five forces analysis - Comparison between 2024 and 2029

7.2 Bargaining power of buyers

Bargaining power of buyers - Impact of key factors 2024 and 2029

7.3 Bargaining power of suppliers

Bargaining power of suppliers - Impact of key factors in 2024 and 2029

7.4 Threat of new entrants

Threat of new entrants - Impact of key factors in 2024 and 2029

7.5 Threat of substitutes

Threat of substitutes - Impact of key factors in 2024 and 2029

7.6 Threat of rivalry

Threat of rivalry - Impact of key factors in 2024 and 2029

7.7 Market condition

Chart on Market condition - Five forces 2024 and 2029

8. Market Segmentation by Product

8.1 Market segments

Chart on Product - Market share 2024-2029 (%)
Data Table on Product - Market share 2024-2029 (%)

8.2 Comparison by Product

Chart on Comparison by Product
Data Table on Comparison by Product

8.3 Whole colostrum powder - Market size and forecast 2024-2029

Chart on Whole colostrum powder - Market size and forecast 2024-2029 ($ million)
Data Table on Whole colostrum powder - Market size and forecast 2024-2029 ($ million)
Chart on Whole colostrum powder - Year-over-year growth 2024-2029 (%)
Data Table on Whole colostrum powder - Year-over-year growth 2024-2029 (%)

8.4 Specialty colostrum powder - Market size and forecast 2024-2029

Chart on Specialty colostrum powder - Market size and forecast 2024-2029 ($ million)
Data Table on Specialty colostrum powder - Market size and forecast 2024-2029 ($ million)
Chart on Specialty colostrum powder - Year-over-year growth 2024-2029 (%)
Data Table on Specialty colostrum powder - Year-over-year growth 2024-2029 (%)

8.5 Whole colostrum liquid - Market size and forecast 2024-2029

Chart on Whole colostrum liquid - Market size and forecast 2024-2029 ($ million)
Data Table on Whole colostrum liquid - Market size and forecast 2024-2029 ($ million)
Chart on Whole colostrum liquid - Year-over-year growth 2024-2029 (%)
Data Table on Whole colostrum liquid - Year-over-year growth 2024-2029 (%)

8.6 Skimmed colostrum powder - Market size and forecast 2024-2029

Chart on Skimmed colostrum powder - Market size and forecast 2024-2029 ($ million)
Data Table on Skimmed colostrum powder - Market size and forecast 2024-2029 ($ million)
Chart on Skimmed colostrum powder - Year-over-year growth 2024-2029 (%)
Data Table on Skimmed colostrum powder - Year-over-year growth 2024-2029 (%)

8.7 Market opportunity by Product

Market opportunity by Product ($ million)
Data Table on Market opportunity by Product ($ million)

9. Market Segmentation by Type

9.1 Market segments

Chart on Type - Market share 2024-2029 (%)
Data Table on Type - Market share 2024-2029 (%)

9.2 Comparison by Type

Chart on Comparison by Type
Data Table on Comparison by Type

9.3 Conventional - Market size and forecast 2024-2029

Chart on Conventional - Market size and forecast 2024-2029 ($ million)
Data Table on Conventional - Market size and forecast 2024-2029 ($ million)
Chart on Conventional - Year-over-year growth 2024-2029 (%)
Data Table on Conventional - Year-over-year growth 2024-2029 (%)

9.4 Organic - Market size and forecast 2024-2029

Chart on Organic - Market size and forecast 2024-2029 ($ million)
Data Table on Organic - Market size and forecast 2024-2029 ($ million)
Chart on Organic - Year-over-year growth 2024-2029 (%)
Data Table on Organic - Year-over-year growth 2024-2029 (%)

9.5 Market opportunity by Type

Market opportunity by Type ($ million)
Data Table on Market opportunity by Type ($ million)

10. Market Segmentation by Application

10.1 Market segments

Chart on Application - Market share 2024-2029 (%)
Data Table on Application - Market share 2024-2029 (%)

10.2 Comparison by Application

Chart on Comparison by Application
Data Table on Comparison by Application

10.3 Dietary supplement - Market size and forecast 2024-2029

Chart on Dietary supplement - Market size and forecast 2024-2029 ($ million)
Data Table on Dietary supplement - Market size and forecast 2024-2029 ($ million)
Chart on Dietary supplement - Year-over-year growth 2024-2029 (%)
Data Table on Dietary supplement - Year-over-year growth 2024-2029 (%)

10.4 Animal nutrition - Market size and forecast 2024-2029

Chart on Animal nutrition - Market size and forecast 2024-2029 ($ million)
Data Table on Animal nutrition - Market size and forecast 2024-2029 ($ million)
Chart on Animal nutrition - Year-over-year growth 2024-2029 (%)
Data Table on Animal nutrition - Year-over-year growth 2024-2029 (%)

10.5 Sports nutrition - Market size and forecast 2024-2029

Chart on Sports nutrition - Market size and forecast 2024-2029 ($ million)
Data Table on Sports nutrition - Market size and forecast 2024-2029 ($ million)
Chart on Sports nutrition - Year-over-year growth 2024-2029 (%)
Data Table on Sports nutrition - Year-over-year growth 2024-2029 (%)

10.6 Functional food - Market size and forecast 2024-2029

Chart on Functional food - Market size and forecast 2024-2029 ($ million)
Data Table on Functional food - Market size and forecast 2024-2029 ($ million)
Chart on Functional food - Year-over-year growth 2024-2029 (%)
Data Table on Functional food - Year-over-year growth 2024-2029 (%)

10.7 Others - Market size and forecast 2024-2029

Chart on Others - Market size and forecast 2024-2029 ($ million)
Data Table on Others - Market size and forecast 2024-2029 ($ million)
Chart on Others - Year-over-year growth 2024-2029 (%)
Data Table on Others - Year-over-year growth 2024-2029 (%)

10.8 Market opportunity by Application

Market opportunity by Application ($ million)
Data Table on Market opportunity by Application ($ million)

11. Customer Landscape

11.1 Customer landscape overview

Analysis of price sensitivity, lifecycle, customer purchase basket, adoption rates, and purchase criteria

12. Geographic Landscape

12.1 Geographic segmentation

Chart on Market share by geography 2024-2029 (%)
Data Table on Market share by geography 2024-2029 (%)

12.2 Geographic comparison

Chart on Geographic comparison
Data Table on Geographic comparison

12.3 North America - Market size and forecast 2024-2029

Chart on North America - Market size and forecast 2024-2029 ($ million)
Data Table on North America - Market size and forecast 2024-2029 ($ million)
Chart on North America - Year-over-year growth 2024-2029 (%)
Data Table on North America - Year-over-year growth 2024-2029 (%)
Chart on Regional Comparison - North America
Data Table on Regional Comparison - North America

12.3.1 US - Market size and forecast 2024-2029

Chart on US - Market size and forecast 2024-2029 ($ million)
Data Table on US - Market size and forecast 2024-2029 ($ million)
Chart on US - Year-over-year growth 2024-2029 (%)
Data Table on US - Year-over-year growth 2024-2029 (%)

12.3.2 Canada - Market size and forecast 2024-2029

Chart on Canada - Market size and forecast 2024-2029 ($ million)
Data Table on Canada - Market size and forecast 2024-2029 ($ million)
Chart on Canada - Year-over-year growth 2024-2029 (%)
Data Table on Canada - Year-over-year growth 2024-2029 (%)

12.3.3 Mexico - Market size and forecast 2024-2029

Chart on Mexico - Market size and forecast 2024-2029 ($ million)
Data Table on Mexico - Market size and forecast 2024-2029 ($ million)
Chart on Mexico - Year-over-year growth 2024-2029 (%)
Data Table on Mexico - Year-over-year growth 2024-2029 (%)

12.4 Europe - Market size and forecast 2024-2029

Chart on Europe - Market size and forecast 2024-2029 ($ million)
Data Table on Europe - Market size and forecast 2024-2029 ($ million)
Chart on Europe - Year-over-year growth 2024-2029 (%)
Data Table on Europe - Year-over-year growth 2024-2029 (%)
Chart on Regional Comparison - Europe
Data Table on Regional Comparison - Europe

12.4.1 Germany - Market size and forecast 2024-2029

Chart on Germany - Market size and forecast 2024-2029 ($ million)
Data Table on Germany - Market size and forecast 2024-2029 ($ million)
Chart on Germany - Year-over-year growth 2024-2029 (%)
Data Table on Germany - Year-over-year growth 2024-2029 (%)

12.4.2 France - Market size and forecast 2024-2029

Chart on France - Market size and forecast 2024-2029 ($ million)
Data Table on France - Market size and forecast 2024-2029 ($ million)
Chart on France - Year-over-year growth 2024-2029 (%)
Data Table on France - Year-over-year growth 2024-2029 (%)

12.4.3 UK - Market size and forecast 2024-2029

Chart on UK - Market size and forecast 2024-2029 ($ million)
Data Table on UK - Market size and forecast 2024-2029 ($ million)
Chart on UK - Year-over-year growth 2024-2029 (%)
Data Table on UK - Year-over-year growth 2024-2029 (%)

12.4.4 Italy - Market size and forecast 2024-2029

Chart on Italy - Market size and forecast 2024-2029 ($ million)
Data Table on Italy - Market size and forecast 2024-2029 ($ million)
Chart on Italy - Year-over-year growth 2024-2029 (%)
Data Table on Italy - Year-over-year growth 2024-2029 (%)

12.4.5 Russia - Market size and forecast 2024-2029

Chart on Russia - Market size and forecast 2024-2029 ($ million)
Data Table on Russia - Market size and forecast 2024-2029 ($ million)
Chart on Russia - Year-over-year growth 2024-2029 (%)
Data Table on Russia - Year-over-year growth 2024-2029 (%)

12.4.6 The Netherlands - Market size and forecast 2024-2029

Chart on The Netherlands - Market size and forecast 2024-2029 ($ million)
Data Table on The Netherlands - Market size and forecast 2024-2029 ($ million)
Chart on The Netherlands - Year-over-year growth 2024-2029 (%)
Data Table on The Netherlands - Year-over-year growth 2024-2029 (%)

12.4.7 Spain - Market size and forecast 2024-2029

Chart on Spain - Market size and forecast 2024-2029 ($ million)
Data Table on Spain - Market size and forecast 2024-2029 ($ million)
Chart on Spain - Year-over-year growth 2024-2029 (%)
Data Table on Spain - Year-over-year growth 2024-2029 (%)

12.5 Asia - Market size and forecast 2024-2029

Chart on Asia - Market size and forecast 2024-2029 ($ million)
Data Table on Asia - Market size and forecast 2024-2029 ($ million)
Chart on Asia - Year-over-year growth 2024-2029 (%)
Data Table on Asia - Year-over-year growth 2024-2029 (%)
Chart on Regional Comparison - Asia
Data Table on Regional Comparison - Asia

12.5.1 China - Market size and forecast 2024-2029

Chart on China - Market size and forecast 2024-2029 ($ million)
Data Table on China - Market size and forecast 2024-2029 ($ million)
Chart on China - Year-over-year growth 2024-2029 (%)
Data Table on China - Year-over-year growth 2024-2029 (%)

12.5.2 India - Market size and forecast 2024-2029

Chart on India - Market size and forecast 2024-2029 ($ million)
Data Table on India - Market size and forecast 2024-2029 ($ million)
Chart on India - Year-over-year growth 2024-2029 (%)
Data Table on India - Year-over-year growth 2024-2029 (%)

12.5.3 Japan - Market size and forecast 2024-2029

Chart on Japan - Market size and forecast 2024-2029 ($ million)
Data Table on Japan - Market size and forecast 2024-2029 ($ million)
Chart on Japan - Year-over-year growth 2024-2029 (%)
Data Table on Japan - Year-over-year growth 2024-2029 (%)

12.5.4 Singapore - Market size and forecast 2024-2029

Chart on Singapore - Market size and forecast 2024-2029 ($ million)
Data Table on Singapore - Market size and forecast 2024-2029 ($ million)
Chart on Singapore - Year-over-year growth 2024-2029 (%)
Data Table on Singapore - Year-over-year growth 2024-2029 (%)

12.5.5 Indonesia - Market size and forecast 2024-2029

Chart on Indonesia - Market size and forecast 2024-2029 ($ million)
Data Table on Indonesia - Market size and forecast 2024-2029 ($ million)
Chart on Indonesia - Year-over-year growth 2024-2029 (%)
Data Table on Indonesia - Year-over-year growth 2024-2029 (%)

12.5.6 South Korea - Market size and forecast 2024-2029

Chart on South Korea - Market size and forecast 2024-2029 ($ million)
Data Table on South Korea - Market size and forecast 2024-2029 ($ million)
Chart on South Korea - Year-over-year growth 2024-2029 (%)
Data Table on South Korea - Year-over-year growth 2024-2029 (%)

12.5.7 Thailand - Market size and forecast 2024-2029

Chart on Thailand - Market size and forecast 2024-2029 ($ million)
Data Table on Thailand - Market size and forecast 2024-2029 ($ million)
Chart on Thailand - Year-over-year growth 2024-2029 (%)
Data Table on Thailand - Year-over-year growth 2024-2029 (%)

12.6 Rest of World (ROW) - Market size and forecast 2024-2029

Chart on Rest of World (ROW) - Market size and forecast 2024-2029 ($ million)
Data Table on Rest of World (ROW) - Market size and forecast 2024-2029 ($ million)
Chart on Rest of World (ROW) - Year-over-year growth 2024-2029 (%)
Data Table on Rest of World (ROW) - Year-over-year growth 2024-2029 (%)
Chart on Regional Comparison - Rest of World (ROW)
Data Table on Regional Comparison - Rest of World (ROW)

12.6.1 Brazil - Market size and forecast 2024-2029

Chart on Brazil - Market size and forecast 2024-2029 ($ million)
Data Table on Brazil - Market size and forecast 2024-2029 ($ million)
Chart on Brazil - Year-over-year growth 2024-2029 (%)
Data Table on Brazil - Year-over-year growth 2024-2029 (%)

12.6.2 UAE - Market size and forecast 2024-2029

Chart on UAE - Market size and forecast 2024-2029 ($ million)
Data Table on UAE - Market size and forecast 2024-2029 ($ million)
Chart on UAE - Year-over-year growth 2024-2029 (%)
Data Table on UAE - Year-over-year growth 2024-2029 (%)

12.6.3 Saudi Arabia - Market size and forecast 2024-2029

Chart on Saudi Arabia - Market size and forecast 2024-2029 ($ million)
Data Table on Saudi Arabia - Market size and forecast 2024-2029 ($ million)
Chart on Saudi Arabia - Year-over-year growth 2024-2029 (%)
Data Table on Saudi Arabia - Year-over-year growth 2024-2029 (%)

12.6.4 South Africa - Market size and forecast 2024-2029

Chart on South Africa - Market size and forecast 2024-2029 ($ million)
Data Table on South Africa - Market size and forecast 2024-2029 ($ million)
Chart on South Africa - Year-over-year growth 2024-2029 (%)
Data Table on South Africa - Year-over-year growth 2024-2029 (%)

12.6.5 Australia - Market size and forecast 2024-2029

Chart on Australia - Market size and forecast 2024-2029 ($ million)
Data Table on Australia - Market size and forecast 2024-2029 ($ million)
Chart on Australia - Year-over-year growth 2024-2029 (%)
Data Table on Australia - Year-over-year growth 2024-2029 (%)

12.6.6 Turkey - Market size and forecast 2024-2029

Chart on Turkey - Market size and forecast 2024-2029 ($ million)
Data Table on Turkey - Market size and forecast 2024-2029 ($ million)
Chart on Turkey - Year-over-year growth 2024-2029 (%)
Data Table on Turkey - Year-over-year growth 2024-2029 (%)

12.7 Market opportunity by geography

Market opportunity by geography ($ million)
Data Tables on Market opportunity by geography ($ million)

13. Drivers, Challenges, and Opportunity

13.1 Market drivers

Growing consumer focus on preventative health and natural ingredients
Product innovation and expansion into new applications
Increasing scientific validation of health benefits

13.2 Market challenges

Navigating complex and divergent regulatory landscapes
Ensuring supply chain integrity, quality control, and ethical sourcing
Overcoming limited mainstream awareness and combating misinformation

13.3 Impact of drivers and challenges

Impact of drivers and challenges in 2024 and 2029

13.4 Market opportunities

Mainstream retail expansion and channel diversification
Convergence of wellness and beauty-from-within
Rise of high-potency, condition-specific formulations

14. Competitive Landscape

14.1 Overview

14.2

Overview on criticality of inputs and factors of differentiation

14.3 Landscape disruption

Overview on factors of disruption

14.4 Industry risks

Impact of key risks on business

15. Competitive Analysis

15.1 Companies profiled

Companies covered

15.2 Company ranking index

15.3 Market positioning of companies

Matrix on companies position and classification

15.4 Adapt Naturals

Adapt Naturals - Overview
Adapt Naturals - Product / Service
Adapt Naturals - Key offerings
SWOT

15.5 Bloom Nu LLC

Bloom Nu LLC - Overview
Bloom Nu LLC - Product / Service
Bloom Nu LLC - Key offerings
SWOT

15.6 Codeage LLC

Codeage LLC - Overview
Codeage LLC - Product / Service
Codeage LLC - Key offerings
SWOT

15.7 Cowboy Colostrum

Cowboy Colostrum - Overview
Cowboy Colostrum - Product / Service
Cowboy Colostrum - Key offerings
SWOT

15.8 Elm and Rye

Elm and Rye - Overview
Elm and Rye - Product / Service
Elm and Rye - Key offerings
SWOT

15.9 Equip Foods LLC

Equip Foods LLC - Overview
Equip Foods LLC - Product / Service
Equip Foods LLC - Key offerings
SWOT

15.10 Folqs s.r.o.

Folqs s.r.o. - Overview
Folqs s.r.o. - Product / Service
Folqs s.r.o. - Key offerings
SWOT

15.11 Heart and Soil

Heart and Soil - Overview
Heart and Soil - Product / Service
Heart and Soil - Key offerings
SWOT

15.12 Miracle Moo

Miracle Moo - Overview
Miracle Moo - Product / Service
Miracle Moo - Key offerings
SWOT

15.13 Nootrum

Nootrum - Overview
Nootrum - Product / Service
Nootrum - Key offerings
SWOT

15.14 NOW Health Group Inc.

NOW Health Group Inc. - Overview
NOW Health Group Inc. - Product / Service
NOW Health Group Inc. - Key offerings
SWOT

15.15 Rahal Biosciences Inc.

Rahal Biosciences Inc. - Overview
Rahal Biosciences Inc. - Product / Service
Rahal Biosciences Inc. - Key offerings
SWOT

15.16 Sovereign Laboratories

Sovereign Laboratories - Overview
Sovereign Laboratories - Product / Service
Sovereign Laboratories - Key offerings
SWOT

15.17 Transparent Labs

Transparent Labs - Overview
Transparent Labs - Product / Service
Transparent Labs - Key offerings
SWOT

15.18 WonderCow Nutrition Inc.

WonderCow Nutrition Inc. - Overview
WonderCow Nutrition Inc. - Product / Service
WonderCow Nutrition Inc. - Key offerings
SWOT

16. Appendix

16.1 Scope of the report

Market definition
Objectives
Notes and caveats

16.2 Inclusions and exclusions checklist

Inclusions checklist
Exclusions checklist

16.3 Currency conversion rates for US$

16.4 Research methodology

16.5 Data procurement

Information sources

16.6 Data validation

16.7 Validation techniques employed for market sizing

16.8 Data synthesis

16.9 360 degree market analysis

16.10 List of abbreviations

Research Methodology

Technavio presents a detailed picture of the market by way of study, synthesis, and summation of data from multiple sources. The analysts have presented the various facets of the market with a particular focus on identifying the key industry influencers. The data thus presented is comprehensive, reliable, and the result of extensive research, both primary and secondary.

INFORMATION SOURCES

Primary sources

  • Manufacturers and suppliers
  • Channel partners
  • Industry experts
  • Strategic decision makers

Secondary sources

  • Industry journals and periodicals
  • Government data
  • Financial reports of key industry players
  • Historical data
  • Press releases

DATA ANALYSIS

Data Synthesis

  • Collation of data
  • Estimation of key figures
  • Analysis of derived insights

Data Validation

  • Triangulation with data models
  • Reference against proprietary databases
  • Corroboration with industry experts

REPORT WRITING

Qualitative

  • Market drivers
  • Market challenges
  • Market trends
  • Five forces analysis

Quantitative

  • Market size and forecast
  • Market segmentation
  • Geographical insights
  • Competitive landscape

Interested in this report?

Get your sample now to see our research methodology and insights!

Download Now

Frequently Asked Questions

Bovine Colostrum market growth will increase by USD 607.3 million during 2025-2029 .

The Bovine Colostrum market is expected to grow at a CAGR of 5.6% during 2025-2029 .

Bovine Colostrum market is segmented by Product (Whole colostrum powder, Specialty colostrum powder, Whole colostrum liquid, Skimmed colostrum powder) Type (Conventional, Organic) Application (Dietary supplement, Animal nutrition, Sports nutrition, Functional food, Others)

Adapt Naturals, Bloom Nu LLC, Codeage LLC, Cowboy Colostrum, CYMBIOTIKA LLC., Double Wood Supplements, Elm and Rye, Equip Foods LLC, Fasted Athlete LLC., Folqs s.r.o., Heart and Soil, Miracle Moo, Nootrum, NOW Health Group Inc., Rahal Biosciences Inc., Sovereign Laboratories, Transparent Labs, Vital Proteins LLC, WonderCow Nutrition Inc. are a few of the key vendors in the Bovine Colostrum market.

North America will register the highest growth rate of 34.9% among the other regions. Therefore, the Bovine Colostrum market in North America is expected to garner significant business opportunities for the vendors during the forecast period.

US, Canada, Mexico, Germany, France, UK, Italy, Russia, The Netherlands, Spain, China, India, Japan, Singapore, Indonesia, South Korea, Thailand, Brazil, UAE, Saudi Arabia, South Africa, Australia, Turkey

  • Growing consumer focus on preventative health and natural ingredients is the driving factor this market.

The Bovine Colostrum market vendors should focus on grabbing business opportunities from the Product segment as it accounted for the largest market share in the base year.