Butter Market Size 2025-2029
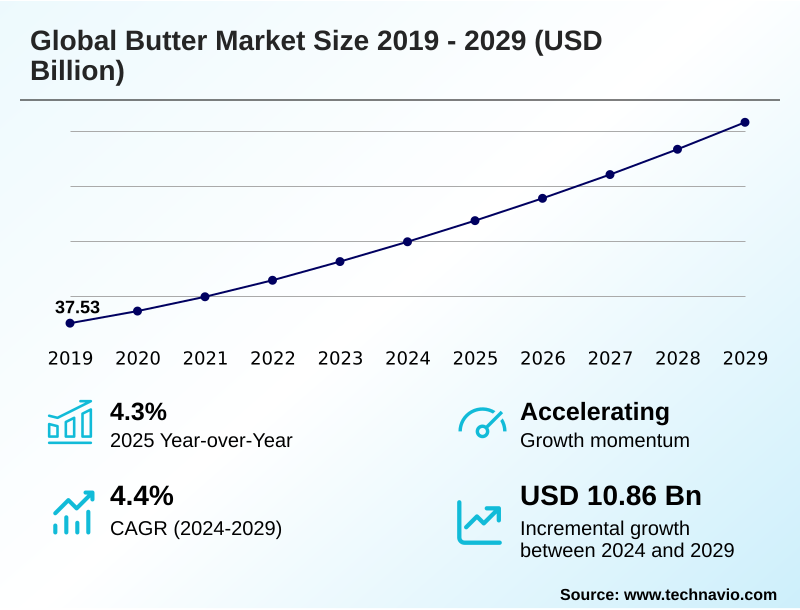
The butter market size is valued to increase by USD 10.86 billion, at a CAGR of 4.4% from 2024 to 2029. Rising consumer preference for natural fats will drive the butter market.
Major Market Trends & Insights
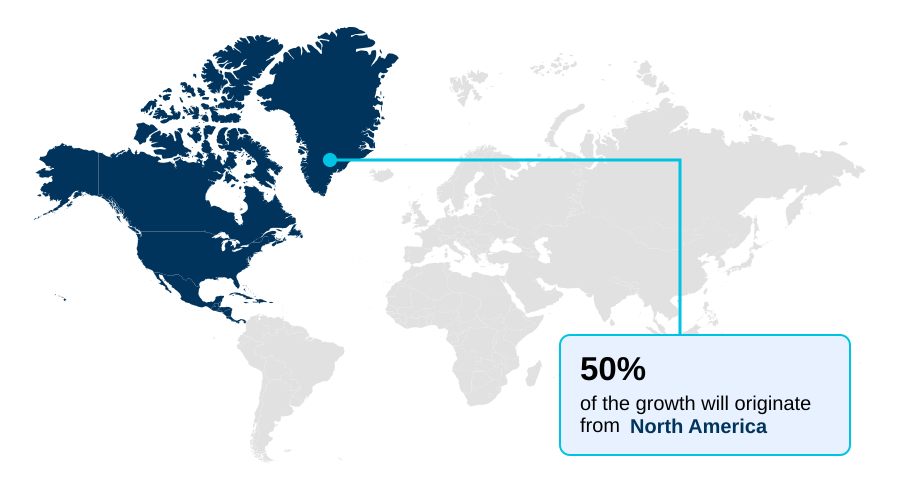
- North America dominated the market and accounted for a 50.3% growth during the forecast period.
- By Distribution Channel - Offline segment was valued at USD 37.89 billion in 2023
- By Product - Cultured butter segment accounted for the largest market revenue share in 2023
Market Size & Forecast
- Market Opportunities: USD 18.26 billion
- Market Future Opportunities: USD 10.86 billion
- CAGR from 2024 to 2029 : 4.4%
Market Summary
- The butter market is experiencing a significant transformation, driven by an evolving consumer preference for natural, minimally processed foods. This shift away from low-fat dietary trends has reinvigorated demand, positioning butter as a clean-label ingredient. The market is increasingly segmented, with growth in premium categories such as those featuring artisanal butter production and products from grass-fed dairy sourcing.
- Innovation is a key theme, with a proliferation of cultured, flavored, and lactose-free variants designed to meet specific dietary needs and culinary applications. For instance, a large-scale baking corporation must now navigate a complex sourcing environment, balancing the consistent quality required for its formulations with the price volatility of raw milk.
- This involves strategic procurement that weighs the benefits of using a high-fat butter for superior baking performance characteristics against the supply chain risks. Concurrently, the industry grapples with challenges related to dairy farm sustainability and the need for enhanced supply chain traceability to meet regulatory and consumer demands for transparency.
- The competitive landscape is dynamic, with established brands competing against private-label offerings and a rising tide of plant-based butter alternatives.
What will be the Size of the Butter Market during the forecast period?
Get Key Insights on Market Forecast (PDF) Get Free Sample
How is the Butter Market Segmented?
The butter industry research report provides comprehensive data (region-wise segment analysis), with forecasts and estimates in "USD million" for the period 2025-2029, as well as historical data from 2019-2023 for the following segments.
- Distribution channel
- Offline
- Online
- Product
- Cultured butter
- Uncultured butter
- Others
- Source
- Animal-based
- Plant-based
- Grass-fed
- Geography
- North America
- US
- Canada
- Mexico
- South America
- Brazil
- Argentina
- Colombia
- Europe
- Germany
- UK
- France
- APAC
- India
- China
- Japan
- Middle East and Africa
- Saudi Arabia
- UAE
- South Africa
- Rest of World (ROW)
- North America
By Distribution Channel Insights
The offline segment is estimated to witness significant growth during the forecast period.
The offline distribution channel remains the cornerstone of the butter market, accounting for nearly 88% of total sales volume.
This segment encompasses a diverse network of hypermarkets, supermarkets, and specialty food retailers where physical product inspection and immediate availability are key purchasing factors.
The competitive landscape is increasingly shaped by sophisticated private-label butter strategy from major retailers, which compete directly with established brands for shelf space. Effective cold chain logistics are critical to maintaining product integrity from production to point of sale.
For manufacturers, success in this channel depends on meeting retailer specifications for butter grading standards and solid fat content (SFC), which directly influence consumer perception and suitability for various culinary fat applications across both retail and foodservice environments.
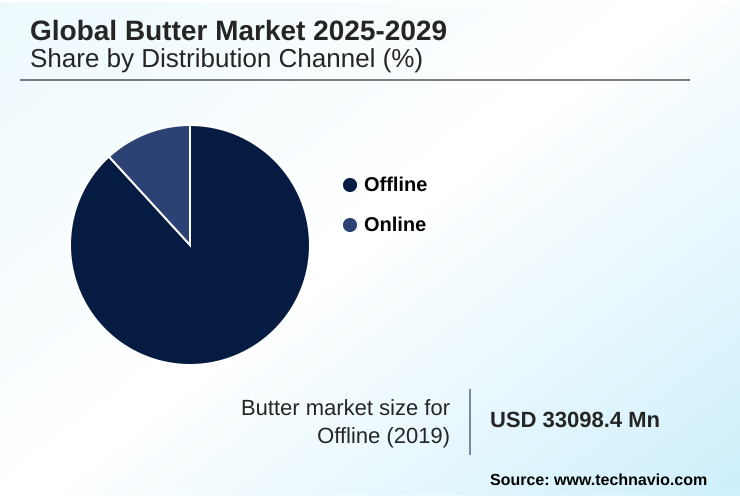
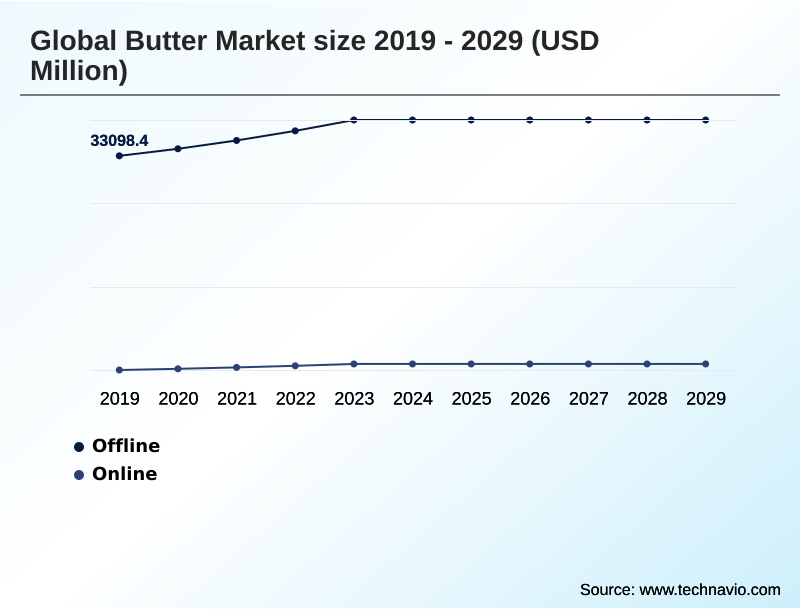
The Offline segment was valued at USD 37.89 billion in 2023 and showed a gradual increase during the forecast period.
Regional Analysis
North America is estimated to contribute 50.3% to the growth of the global market during the forecast period.Technavio’s analysts have elaborately explained the regional trends and drivers that shape the market during the forecast period.
See How Butter Market Demand is Rising in North America Get Free Sample
The geographic landscape of the butter market is led by North America, which is projected to contribute over 50% of the market's incremental growth.
This region is characterized by high per capita consumption and strong demand for premium products, including those focused on pasture-raised milk production and organic butter certification.
The market in the US, the largest country-level contributor, is driven by a consumer shift toward natural fats and clean-label ingredients. Meanwhile, the APAC region is expected to witness the fastest expansion, with a growth rate approaching 6% annually.
This is fueled by rising disposable incomes and the Westernization of diets in countries like China and India, creating significant opportunities.
A key challenge across regions is ensuring dairy farm sustainability and managing complex cold chain logistics to serve these diverse markets effectively.
Market Dynamics
Our researchers analyzed the data with 2024 as the base year, along with the key drivers, trends, and challenges. A holistic analysis of drivers will help companies refine their marketing strategies to gain a competitive advantage.
- Strategic decisions in the butter market increasingly hinge on understanding nuanced product differences and production methods. A detailed analysis of cultured vs uncultured butter for baking reveals performance variations, while the benefits of grass-fed butterfat composition appeal to health-conscious consumers.
- The impact of churning speed on butter texture is a key factor in production, as is the shelf life of salted vs unsalted butter. Consumers are learning how milkfat content affects butter quality and are seeking the nutritional profile of high-fat european butter.
- In foodservice, chefs experiment to find the best flavored compound butters for cooking, while the role of butter in laminated pastry dough remains critical. Many now know how to make clarified butter or ghee at home. The market sees a constant plant-based butter alternatives ingredient comparison. Adherence to organic butter production standards is a key differentiator.
- For manufacturers, understanding factors affecting butter spreadability from fridge and the intricacies of butter grading systems is crucial. The slow-churned butter processing advantages are now a key marketing point for creating artisanal butter with unique flavors.
- At a technical level, ensuring water-in-oil emulsion stability in spreads, perfecting the lactose-free butter manufacturing process, and implementing robust supply chain traceability in dairy products are vital. Firms adopting advanced sustainability practices in modern dairy farming report operational efficiencies over 10% higher than industry averages, as the butter packaging effect on freshness is also scrutinized.
What are the key market drivers leading to the rise in the adoption of Butter Industry?
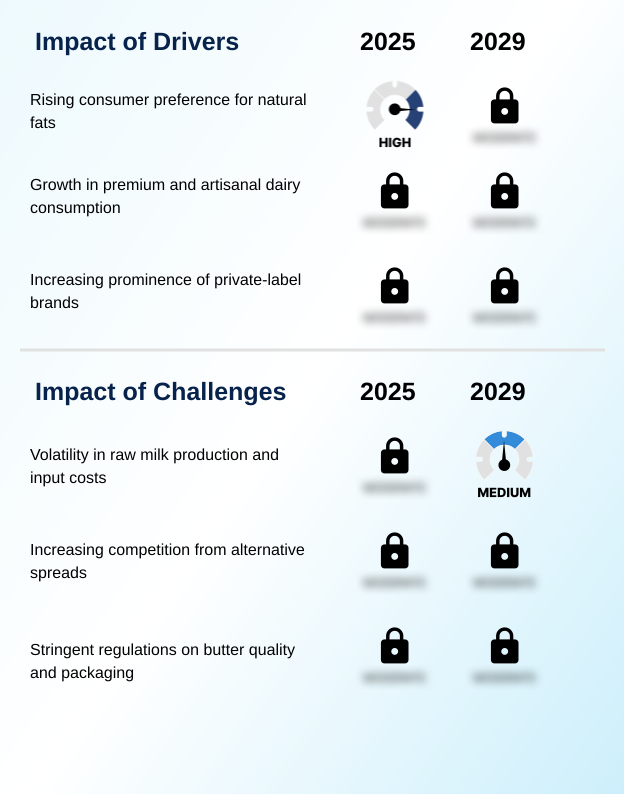
- A primary market driver is the sustained consumer shift toward natural fats, boosting demand for traditional butter over highly processed spreads.
- A primary driver is the consumer shift toward natural, minimally processed foods, which has firmly positioned butter as a preferred clean-label ingredient. This movement away from highly processed spreads is fueling demand for traditional dairy product formulation.
- Brands emphasizing attributes like grass-fed dairy sourcing are commanding price premiums of up to 25% over conventional counterparts.
- The growing interest in culinary arts and home baking further boosts the market, as consumers seek high-quality fats for their superior baking performance characteristics and flavor.
- The perception of butter as a wholesome food aligns with popular high-fat dietary trends, catalyzing a robust sector for specialty items.
- This evolving consumer mindset is redefining butter's role from a basic commodity to a premium product central to value creation.
What are the market trends shaping the Butter Industry?
- The growing emphasis on sustainability and traceability is evolving from a corporate initiative to a core market imperative, fundamentally reshaping production practices and consumer expectations.
- A defining trend reshaping the market is the imperative for sustainability and transparency. Stakeholders are increasingly demanding verifiable proof of responsible dairy farm sustainability and ethical sourcing, moving beyond mere claims. The implementation of blockchain for supply chain traceability has enabled some producers to reduce verification times by over 40%, enhancing consumer trust.
- This focus extends to packaging, where a shift to recyclable materials has been shown to improve brand perception scores by more than 15%. This trend is creating a new basis for competition, where butter flavor profile and baking performance characteristics are evaluated alongside ecological credentials.
- As a result, companies are fundamentally reassessing manufacturing processes, from the initial cream churning process to final distribution, to align with these evolving market expectations.
What challenges does the Butter Industry face during its growth?
- Volatility in raw milk production and input costs presents a primary challenge for the market, creating price instability and supply chain risks.
- The market's most significant challenge is the inherent volatility in raw milk production, which directly impacts price stability and supply reliability. Factors such as climatic events and escalating feed costs create an unpredictable environment for the buttermilk byproduct and fat inputs.
- This instability complicates inventory management for large food manufacturers, who have reported an average 5% increase in production lead times during periods of supply disruption. Consequently, managing the water-in-oil emulsion and ensuring consistent product quality becomes more difficult. Some manufacturers have employed sophisticated hedging strategies, mitigating input cost fluctuations by up to 18%.
- However, the underlying risk forces brand owners to navigate a speculative landscape and consider reformulations with plant-based butter alternatives, which carries its own consumer perception challenges.
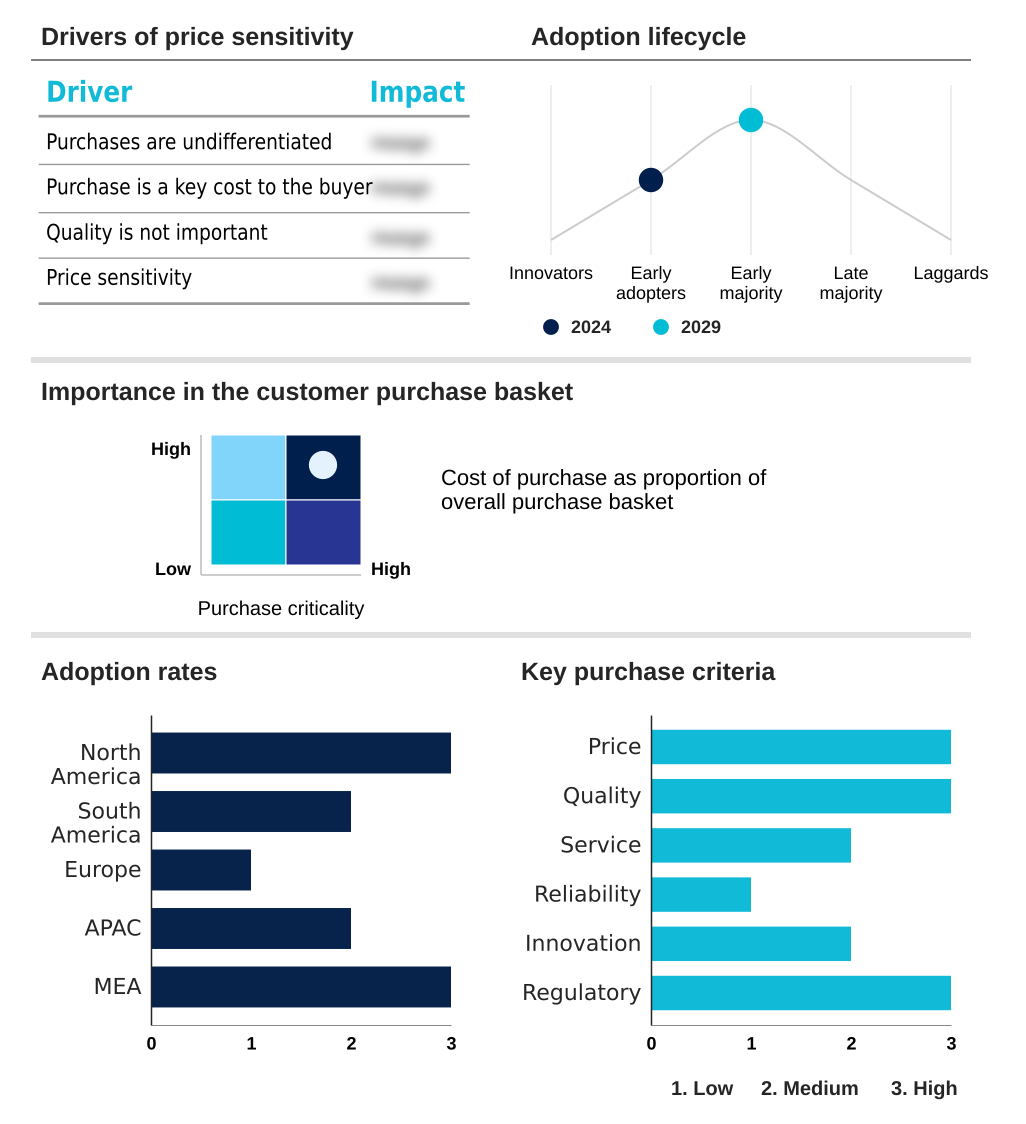
Exclusive Technavio Analysis on Customer Landscape
The butter market forecasting report includes the adoption lifecycle of the market, covering from the innovator’s stage to the laggard’s stage. It focuses on adoption rates in different regions based on penetration. Furthermore, the butter market report also includes key purchase criteria and drivers of price sensitivity to help companies evaluate and develop their market growth analysis strategies.
Customer Landscape of Butter Industry
Competitive Landscape
Companies are implementing various strategies, such as strategic alliances, butter market forecast, partnerships, mergers and acquisitions, geographical expansion, and product/service launches, to enhance their presence in the industry.
All Things Butter Ltd. - Provides a range of plant-based spreads and margarine alternatives, catering to health-conscious and dairy-free consumer segments.
The industry research and growth report includes detailed analyses of the competitive landscape of the market and information about key companies, including:
- All Things Butter Ltd.
- Arla Foods amba
- Better Butter Internet Pvt. Ltd.
- Dairy Farmers of America Inc.
- Fonterra Cooperative Group Ltd.
- Good Cow Dairy Pvt. Ltd.
- Heritage Foods Ltd.
- Lactalis International
- Land O Lakes Inc.
- Meadow Foods Ltd.
- Minerva Dairy Inc
- Nerdy Nuts LLC
- Organic Valley
- Ornua Co-operative Ltd.
- Royal Friesland Campina NV
- Savencia SA
- The Chattanooga Butter Company, LLC
- The Kraft Heinz Co
- Unilever PLC
Qualitative and quantitative analysis of companies has been conducted to help clients understand the wider business environment as well as the strengths and weaknesses of key industry players. Data is qualitatively analyzed to categorize companies as pure play, category-focused, industry-focused, and diversified; it is quantitatively analyzed to categorize companies as dominant, leading, strong, tentative, and weak.
Recent Development and News in Butter market
- In September, 2024, Fonterra Cooperative Group Ltd. announced a USD 150 million investment for a new cool store at its Whareroa site to enhance production and logistics capabilities for its dairy products.
- In January, 2025, Organic Valley launched a new line of European-style cultured butters sourced from pasture-raised cows on small family farms to meet growing consumer demand for premium, artisanal dairy products.
- In April, 2025, Lactalis International invested USD 50 million to expand its butter and cheese production facility in Uberlandia, Brazil, reinforcing its strategic growth in the South American market.
- In May, 2025, Ornua Co-operative Ltd. announced expanded distribution for its Kerrygold brand across several key European retail chains, leveraging tariff reductions from the recently implemented EU-New Zealand Free Trade Agreement.
Dive into Technavio’s robust research methodology, blending expert interviews, extensive data synthesis, and validated models for unparalleled Butter Market insights. See full methodology.
| Market Scope | |
|---|---|
| Page number | 286 |
| Base year | 2024 |
| Historic period | 2019-2023 |
| Forecast period | 2025-2029 |
| Growth momentum & CAGR | Accelerate at a CAGR of 4.4% |
| Market growth 2025-2029 | USD 10859.1 million |
| Market structure | Fragmented |
| YoY growth 2024-2025(%) | 4.3% |
| Key countries | US, Canada, Mexico, Brazil, Argentina, Colombia, Germany, UK, France, Italy, Spain, The Netherlands, India, China, Japan, South Korea, Australia, Indonesia, Saudi Arabia, UAE, South Africa, Israel and Turkey |
| Competitive landscape | Leading Companies, Market Positioning of Companies, Competitive Strategies, and Industry Risks |
Research Analyst Overview
- The butter market's evolution is governed by precise technical standards, from ensuring proper milkfat composition and pasteurization temperature control to managing the final butter crystallization. A key boardroom focus is the optimization of the cream churning process and butterfat separation to enhance yield.
- The slip melting point and solid fat content (SFC) are critical metrics influencing butter texture analysis and overall quality. Control over diacetyl concentration is essential for flavor, while the use of microbial starter cultures is rising. For industrial products like anhydrous milk fat (AMF) and butteroil manufacturing, milk fat fractionation and the ghee clarification process are vital.
- Firms that invest in technologies for lipolysis inhibition and monitor free fatty acid levels report a 15% reduction in spoilage. Maintaining a low peroxide value measurement is key, alongside adherence to butter grading standards. This focus on the water-in-oil emulsion, fat globule structure, and solid-not-fat content defines product quality, while spreadability assessment remains a core consumer-facing metric.
- The formulation of dairy products requires balancing all these technical factors for market success.
What are the Key Data Covered in this Butter Market Research and Growth Report?
-
What is the expected growth of the Butter Market between 2025 and 2029?
-
USD 10.86 billion, at a CAGR of 4.4%
-
-
What segmentation does the market report cover?
-
The report is segmented by Distribution Channel (Offline, and Online), Product (Cultured butter, Uncultured butter, and Others), Source (Animal-based, Plant-based, and Grass-fed) and Geography (North America, South America, Europe, APAC, Middle East and Africa)
-
-
Which regions are analyzed in the report?
-
North America, South America, Europe, APAC and Middle East and Africa
-
-
What are the key growth drivers and market challenges?
-
Rising consumer preference for natural fats, Volatility in raw milk production and input costs
-
-
Who are the major players in the Butter Market?
-
All Things Butter Ltd., Arla Foods amba, Better Butter Internet Pvt. Ltd., Dairy Farmers of America Inc., Fonterra Cooperative Group Ltd., Good Cow Dairy Pvt. Ltd., Heritage Foods Ltd., Lactalis International, Land O Lakes Inc., Meadow Foods Ltd., Minerva Dairy Inc, Nerdy Nuts LLC, Organic Valley, Ornua Co-operative Ltd., Royal Friesland Campina NV, Savencia SA, The Chattanooga Butter Company, LLC, The Kraft Heinz Co and Unilever PLC
-
Market Research Insights
- Market dynamics are shaped by consumer demand for products with clean-label ingredients, driving the growth of artisanal butter production and the slow-churned method. The preference for European-style butter and cultured cream fermentation is rising, differentiating from standard sweet cream butter. The choice between salted vs unsalted butter remains a key consumer decision.
- Innovations include compound butter infusion and advanced lactose-free butter processing. Demand for high-fat butter (85%+) is linked to its unique butter flavor profile and superior culinary fat application, especially its baking performance characteristics. Traceability is now paramount, with supply chain traceability and cold chain logistics improving product integrity by 30%.
- Dairy farm sustainability, organic butter certification, and adherence to food safety regulation are non-negotiable. This complex landscape includes the rise of plant-based butter alternatives and sophisticated private-label butter strategy, all managed through technologies like vacuum packaging technology, which has extended product freshness by 15%.
We can help! Our analysts can customize this butter market research report to meet your requirements.
 RIA -
RIA - 
