
Cable Conduit Systems Market Size 2025-2029
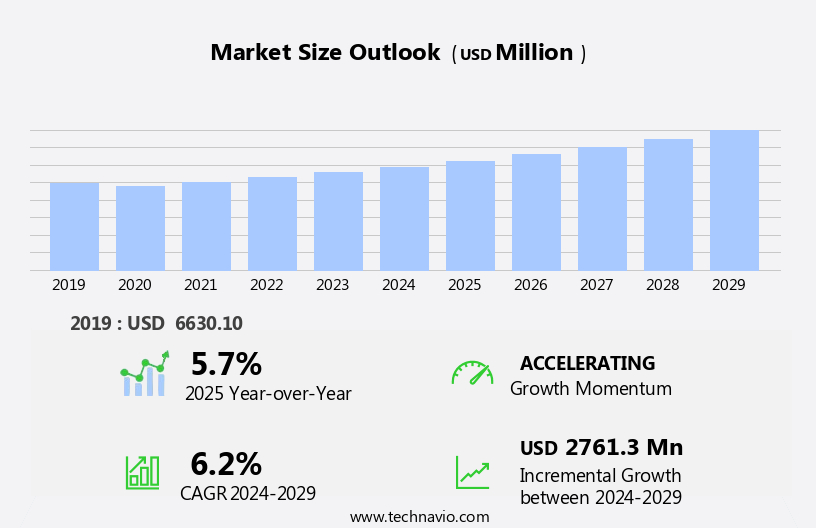
The cable conduit systems market size is forecast to increase by USD 2.76 billion at a CAGR of 6.2% between 2024 and 2029.
- The market is experiencing significant growth, driven by the rapid urbanization and infrastructure development in both emerging and developed economies. This trend is leading to increased demand for reliable and efficient cable management solutions to support the expansion of power, telecommunications, and other critical infrastructure. Additionally, the introduction of new products, such as fire-resistant and high-density conduits, is expanding the market's reach and applications. However, the market faces challenges as well. Regulatory hurdles, including stringent safety and environmental standards, impact adoption and increase the cost of production. Supply chain inconsistencies, particularly in raw materials and logistics, temper growth potential and require effective management strategies. Data Center Cables, Coaxial Cables, and Cable Raceway are integral to telecommunications and broadcasting.
- Furthermore, competition from alternative cable management solutions, such as wireless technologies and fiber optics, is intensifying. Companies seeking to capitalize on market opportunities must navigate these challenges effectively by focusing on innovation, regulatory compliance, and supply chain optimization. Strategic partnerships, mergers and acquisitions, and investments in research and development are key strategies to stay competitive and maintain market share.
What will be the Size of the Cable Conduit Systems Market during the forecast period?
- The market encompasses various aspects, including optimization, designs, applications, technicians, manufacturing, distributors, repair, fabrication, innovations, certification, simulation, solutions, installation techniques, trends, replacement, training, engineering, installers, standards, contractors, materials, wholesalers, testing, suppliers, analysis, regulations, project management, cost analysis, and design software. These elements continually evolve to meet the demands of diverse industries and infrastructure projects. Conduit optimization and design play a crucial role in maximizing efficiency and reducing costs. Innovations in conduit applications expand their usage beyond traditional electrical wiring, such as fiber optics and data communication. Conduit technicians and installers require ongoing training to stay current with the latest installation techniques and safety standards. Cable accessories, such as splitters, BNC connectors, and covers, cater to diverse needs, while repair and replacement services ensure business continuity.
- Conduit manufacturing and fabrication processes undergo constant improvement, with a focus on durability, flexibility, and cost-effectiveness. Suppliers and distributors play a vital role in ensuring the timely delivery and availability of conduit systems. Conduit repair and replacement are essential for maintaining operational efficiency and ensuring safety. Conduit certification and testing are integral to maintaining quality and compliance with industry regulations. Project management software and cost analysis tools help streamline conduit installation projects and minimize expenses. Regulations governing conduit systems evolve to address emerging technologies and safety concerns. In summary, the market is a dynamic and complex ecosystem, encompassing various aspects from optimization and design to manufacturing, installation, and maintenance. New infrastructure development and the integration of renewable energy sources, such as solar and wind, have significantly contributed to the industry's growth. Continuous innovation and adaptation are essential to meet the evolving needs of industries and infrastructure projects.
How is this Cable Conduit Systems Industry segmented?
The cable conduit systems industry research report provides comprehensive data (region-wise segment analysis), with forecasts and estimates in "USD million" for the period 2025-2029, as well as historical data from 2019-2023 for the following segments.
- Product
- Rigid non-metallic
- Rigid metallic
- Flexible non-metallic
- Flexible metallic
- End-user
- Commercial
- Manufacturing
- IT and telecommunication
- Healthcare
- Others
- Geography
- North America
- US
- Canada
- Europe
- France
- Germany
- UK
- APAC
- China
- India
- Japan
- South Korea
- South America
- Brazil
- Rest of World (ROW)
- North America
By Product Insights
The rigid non-metallic segment is estimated to witness significant growth during the forecast period. In the dynamic market, rigid non-metallic conduits have gained significant traction due to their cost-effective nature, ease of installation, and superior insulating properties. Primarily manufactured from materials like Polyvinyl Chloride (PVC), Chlorinated Polyvinyl Chloride (CPVC), and fiberglass, these conduits offer robust protection to electrical cables. Their rigidity ensures a high level of shielding, making them an excellent choice for various applications, including residential, commercial, and light industrial sectors. One of the key benefits of rigid non-metallic conduits is their resistance to corrosion. Unlike their metallic counterparts, they do not rust, making them an ideal solution for outdoor or harsh environments where exposure to moisture and chemicals is prevalent. Cable accessories, including lugs, cable ties, sleeves, and connectors, play a vital role in ensuring reliability and protection. In the renewable energy sector, Wind Energy Cables and Solar Cables are essential. Fiber Optic Cables and Cable Assemblies dominate Fiber Optic Networking, while Instrumentation Cables and Signal are crucial for industrial automation.
Ease of installation, conduit termination, and the availability of a wide range of conduit accessories, including conduit clamps, bushings, supports, seals, and adapters, contribute to the market's growth. The use of materials like aluminum and steel, along with conduit sizing and connectors, ensures fire resistance and quality assurance. Cable management solutions, such as cable trays and junction boxes, further enhance the efficiency and reliability of cable conduit systems.
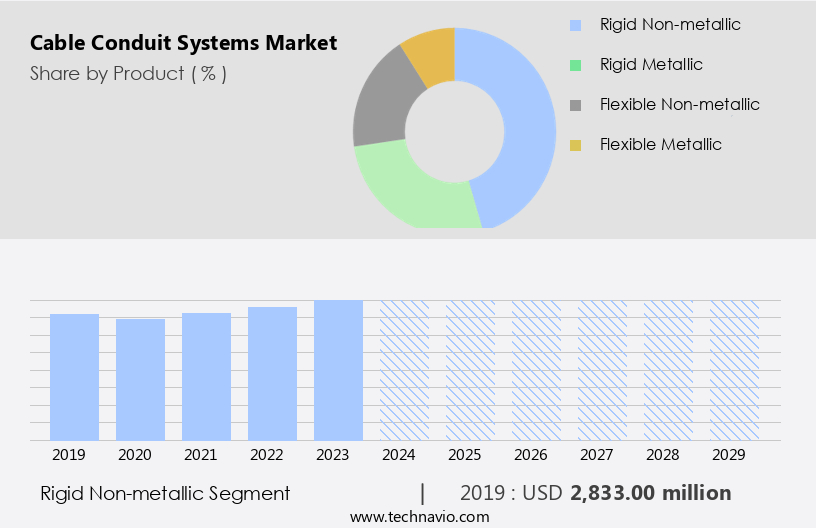
The Rigid non-metallic segment was valued at USD 2.83 billion in 2019 and showed a gradual increase during the forecast period. These conduits are extensively used in telecom infrastructure, renewable energy projects, lighting systems, and fire alarm systems. Advanced manufacturing techniques, such as conduit bending and precision machining, enable the production of custom conduit fittings, elbows, and tees, ensuring seamless cable routing. Conduit systems also adhere to green building practices and industry standards, including code compliance and performance testing. The integration of digital transformation and IoT applications in various sectors, such as HVAC systems, smart buildings, and industrial automation, has further fueled the demand for cable conduit systems. The market also caters to infrastructure projects, power distribution, and wind power installations, among others.
Regional Analysis
North America is estimated to contribute 32% to the growth of the global market during the forecast period. Technavio's analysts have elaborately explained the regional trends and drivers that shape the market during the forecast period.
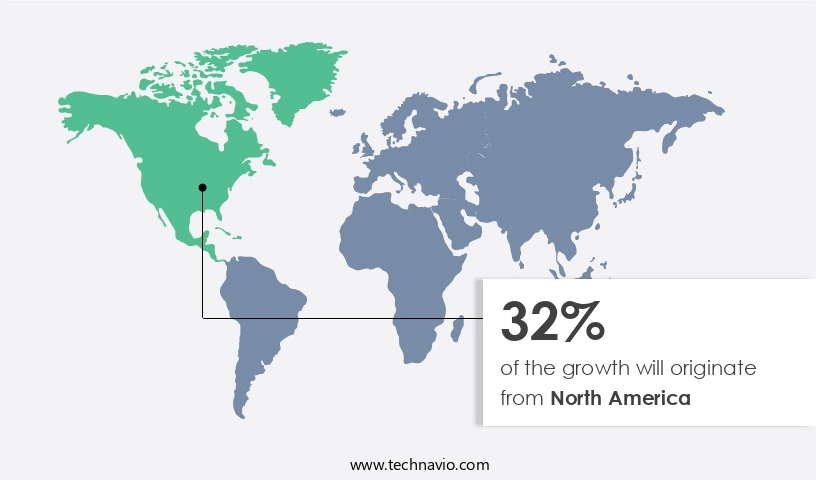
The North American market for cable conduit systems is witnessing significant growth due to the expanding construction, telecom, and renewable energy sectors. In 2023, the United States construction spending reached an impressive USD1.6 trillion, fueling the demand for advanced cable conduit systems in residential, commercial, and infrastructure projects. These developments necessitate reliable and efficient cable management solutions for safety and organization in new and existing structures. Furthermore, the Infrastructure Investment and Jobs Act allocated nearly USD75 billion for clean energy projects in the US by the end of 2023, increasing the demand for cable conduit systems in the renewable energy sector.
Advanced manufacturing techniques, such as conduit bending and precision fabrication, streamline production and improve overall quality. Green building practices, including conduit routing and performance testing, contribute to energy efficiency and environmental sustainability. Fire resistance, corrosion resistance, and code compliance are essential considerations for cable conduit systems in various applications, including lighting systems, telecom infrastructure, and fire alarm systems. Cable tray systems, conduit clamps, and conduit hangers facilitate installation and maintenance, while conduit fittings, elbows, and connectors ensure seamless cable connections. The integration of digital transformation, data communication, and IoT applications in buildings and industrial automation further propels the demand for advanced cable conduit systems.
Market Dynamics
Our researchers analyzed the data with 2024 as the base year, along with the key drivers, trends, and challenges. A holistic analysis of drivers will help companies refine their marketing strategies to gain a competitive advantage.
What are the Cable Conduit Systems market drivers leading to the rise in the adoption of Industry?
- The primary catalyst for market growth is the rapid urbanization and infrastructure development, which necessitates constant advancements in various sectors. The market is experiencing steady growth due to the increasing demand for infrastructure development. With approximately 55 percent of the global population living in urban areas as of 2023, and this figure projected to reach 68 percent by 2050, the need for extensive infrastructure development is imperative. This shift towards urbanization drives the demand for residential, commercial, and industrial buildings, all requiring reliable electrical and communication networks. Cable conduit systems are essential for ensuring the safety, organization, and efficiency of these networks. Moreover, the infrastructure sector is witnessing significant investment, with the Infrastructure Investment and Jobs Act (IIJA) allocating USD1 trillion for various infrastructure projects in the US alone.
- This investment will further boost the demand for cable conduit systems in various applications, including wind power, security systems, industrial automation, and building construction. Ease of installation, durability, and flexibility are key advantages of cable conduit systems. They offer solutions for conduit installation, termination, and connections through the use of conduit adapters, tees, and couplings. The versatility of these systems makes them suitable for various applications, from residential construction to large-scale industrial projects. In summary, The market is poised for growth due to the increasing demand for infrastructure development, driven by urbanization and significant investment in infrastructure projects. The market offers various solutions for conduit installation, termination, and connections, making them a crucial component of electrical and communication networks.
What are the Cable Conduit Systems market trends shaping the Industry?
- The introduction of new products is a current market trend. Professionals anticipate continued innovation and product development in various industries. The market is experiencing innovation with the introduction of advanced solutions to cater to diverse industries. On July 26, 2023, Franklin Electric launched the CableTight System, a watertight and flexible electrical conduit system designed for harsh underground conditions. Engineered from high-density polyethylene (HDPE), this system features continuous conduit runs and press-fit connectors, enabling quick, precise, and leak-free installations, eliminating the need for tools. The CableTight System is available in three-quarter inch and one-inch sizes and comes in pre-loaded reels of one thousand and one thousand five hundred feet. By eliminating potential leak points that are common in traditional PVC systems, which require joints every ten feet, this seamless conduit solution ensures improved reliability for various applications, including lighting systems, telecom infrastructure, renewable energy, fire alarm systems, and cable management.
- The conduit boxes, conduit bonding, conduit routing, conduit fittings, and conduit elbows are integral components of this system, adhering to green building practices and advanced manufacturing standards.
How does Cable Conduit Systems market faces challenges face during its growth?
- The cable management industry faces significant competition from alternative solutions, posing a significant challenge to its growth. The market experiences competition from alternative cable management solutions, including cable trays, raceways, and under-floor systems. These alternatives offer advantages such as flexibility in installation, ease of maintenance, and cost-effectiveness, particularly in large-scale commercial and industrial settings. For instance, cable trays provide an open, accessible method for organizing and supporting cables, enabling quick installation and modifications. This makes them suitable for environments where cables need frequent adjustments or re-routing, such as data centers and manufacturing facilities. Code compliance remains a crucial factor in the market. Conduit accessories, such as conduit grounding, conduit bushings, conduit seals, and conduit supports, ensure compliance with electrical codes and regulations.
- Flexible conduit and galvanized or steel conduit offer corrosion resistance, ensuring the longevity and reliability of the cable conduit systems. Performance testing and installation time are essential considerations in the market, with conduit hangers and pull boxes contributing to efficient installation processes. Overall, the market continues to evolve, adapting to the changing needs of various industries and construction sectors.
Exclusive Customer Landscape
The cable conduit systems market forecasting report includes the adoption lifecycle of the market, covering from the innovator's stage to the laggard's stage. It focuses on adoption rates in different regions based on penetration. Furthermore, the cable conduit systems market report also includes key purchase criteria and drivers of price sensitivity to help companies evaluate and develop their market growth analysis strategies.

Customer Landscape
Key Companies & Market Insights
Companies are implementing various strategies, such as strategic alliances, cable conduit systems market forecast, partnerships, mergers and acquisitions, geographical expansion, and product/service launches, to enhance their presence in the industry.
ABB Ltd. - This company specializes in providing cable conduit systems, encompassing flexible metallic and non-metallic options, expert systems, and rigid conduit variants.
The industry research and growth report includes detailed analyses of the competitive landscape of the market and information about key companies, including:
- ABB Ltd.
- Aliaxis Holdings SA
- Atkore Inc.
- B.E.C. Conduits Pvt. Ltd.
- Champion Fiberglass Inc.
- Dura-Line
- Eaton Corp. plc
- Electri-Flex Co.
- Franklin Electric Co. Inc.
- Hubbell Inc.
- igus GmbH
- Lapp Holding SE
- Legrand SA
- nVent Electric Plc
- Panasonic Holdings Corp.
- Prime Conduit Inc.
- Robroy Industries Inc.
- Schneider Electric SE
- Southwire Co. LLC
Qualitative and quantitative analysis of companies has been conducted to help clients understand the wider business environment as well as the strengths and weaknesses of key industry players. Data is qualitatively analyzed to categorize companies as pure play, category-focused, industry-focused, and diversified; it is quantitatively analyzed to categorize companies as dominant, leading, strong, tentative, and weak.
Recent Development and News in Cable Conduit Systems Market
- In February 2024, Prysmian Group, a leading player in the cable industry, introduced its new high-performance, low-loss, and compact XLPE-insulated cable, named "Dragon Aluminum," for power transmission applications (Prysmian Group Press Release, 2024). This innovative product launch is expected to cater to the increasing demand for energy-efficient and reliable power transmission solutions.
- In July 2025, TE Connectivity, a global technology and manufacturing leader, announced a strategic partnership with Schneider Electric to jointly develop and offer integrated power distribution solutions, including cable conduit systems, for data centers and industrial applications (TE Connectivity Press Release, 2025). This collaboration aims to enhance their market presence and provide comprehensive solutions to their clients.
- In November 2024, Nexans, a leading cable manufacturer, completed the acquisition of Molex's Low Voltage Cabling & Connectivity business, expanding its portfolio in the building and infrastructure segment (Nexans Press Release, 2024). This acquisition will enable Nexans to strengthen its position in the market and offer a broader range of products and services to its customers.
- In March 2025, the European Union passed the new Construction Products Regulation (CPR), which sets stricter safety and performance requirements for cable conduit systems (European Commission, 2025). This regulation aims to improve the safety, sustainability, and interoperability of construction products, including cable conduit systems, in the European market.
Research Analyst Overview
The market exhibits a dynamic and evolving landscape, with various sectors integrating these systems to meet their unique requirements. Rigid conduit finds extensive applications in telecom infrastructure and electrical wiring, ensuring reliable transmission of data and power. Lighting systems rely on conduit for protection and efficient cable management. In the realm of renewable energy, conduit systems are essential for solar installations and wind power projects, ensuring code compliance and performance. Fire alarm systems and conduit boxes are integral components of safety infrastructure, with conduit bending and routing playing a crucial role in their installation. Advanced manufacturing processes and green building practices have led to the adoption of conduit fittings, elbows, and junction boxes, enhancing the overall efficiency and sustainability of construction projects.
Underground conduit and conduit bonding are essential for infrastructure projects, providing corrosion resistance and electrical grounding. Conduit clamps and conduit supports ensure ease of installation and proper conduit termination. In the realm of digital transformation, conduit systems have become indispensable for data communication in HVAC systems, smart buildings, and industrial automation. The ongoing unfolding of market activities reveals a continuous focus on quality assurance, material specifications, and industry standards. The integration of conduit accessories, such as conduit adapters and conduit tees, streamlines installation time and enhances the overall functionality of conduit systems. The market's evolution is further highlighted by the increasing adoption of flexible conduit, conduit grounding, and conduit hangers, catering to diverse applications and environmental impact considerations.
In commercial and residential construction, conduit systems have become a cornerstone of electrical wiring and cable management, ensuring safety, reliability, and efficiency. The integration of conduit systems in various sectors underscores their versatility and adaptability to the ever-evolving technological landscape. The Cable Conduit Systems Market is evolving with advancements in conduit materials and innovative conduit designs, ensuring durability and efficiency. Strict conduit standards and conduit regulations guide industry practices, supported by rigorous conduit testing. Optimized conduit installation techniques enhance performance, while regular conduit maintenance and timely conduit replacement ensure system reliability. Detailed conduit cost analysis aids informed decision-making in conduit project management. Emerging conduit trends and breakthrough conduit innovations drive better conduit solutions for diverse applications. Cutting-edge conduit design software, along with conduit simulation and conduit analysis, boosts precision in conduit engineering and conduit fabrication. Reliable conduit distributors play a crucial role in market expansion, fostering the adoption of advanced conduit systems across industries.
Dive into Technavio's strong research methodology, blending expert interviews, extensive data synthesis, and validated models for unparalleled Cable Conduit Systems Market insights. See full methodology.
|
Market Scope |
|
|
Report Coverage |
Details |
|
Page number |
219 |
|
Base year |
2024 |
|
Historic period |
2019-2023 |
|
Forecast period |
2025-2029 |
|
Growth momentum & CAGR |
Accelerate at a CAGR of 6.2% |
|
Market growth 2025-2029 |
USD 2.76 billion |
|
Market structure |
Fragmented |
|
YoY growth 2024-2025(%) |
5.7 |
|
Key countries |
US, China, Germany, India, UK, Canada, Japan, Brazil, France, and South Korea |
|
Competitive landscape |
Leading Companies, Market Positioning of Companies, Competitive Strategies, and Industry Risks |
What are the Key Data Covered in this Cable Conduit Systems Market Research and Growth Report?
- CAGR of the Cable Conduit Systems industry during the forecast period
- Detailed information on factors that will drive the growth and forecasting between 2025 and 2029
- Precise estimation of the size of the market and its contribution of the industry in focus to the parent market
- Accurate predictions about upcoming growth and trends and changes in consumer behaviour
- Growth of the market across North America, APAC, Europe, Middle East and Africa, and South America
- Thorough analysis of the market's competitive landscape and detailed information about companies
- Comprehensive analysis of factors that will challenge the cable conduit systems market growth of industry companies
We can help! Our analysts can customize this cable conduit systems market research report to meet your requirements.
 RIA -
RIA - 
