
Canine Atopic Dermatitis Market Size 2024-2028
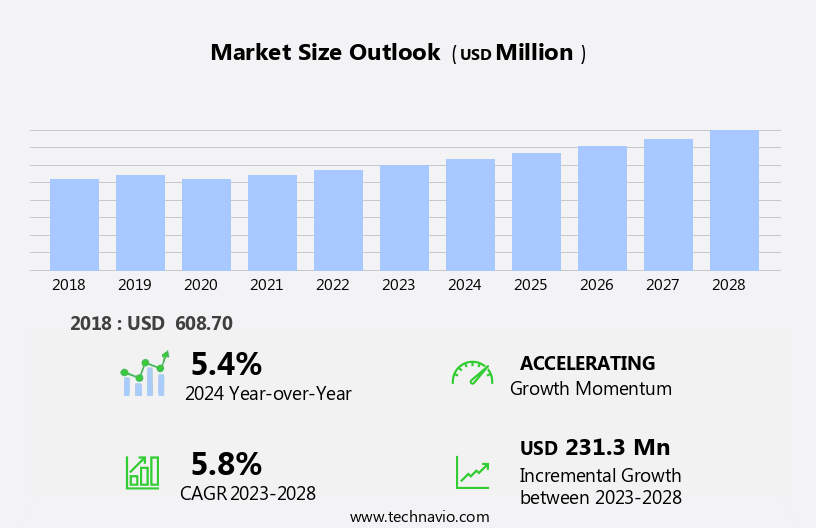
The canine atopic dermatitis market size is forecast to increase by USD 231.3 million at a CAGR of 5.8% between 2023 and 2028.
- The market is experiencing significant growth, driven by the increasing trend of pet humanization and the rising number of pet owners seeking to alleviate their dogs' skin conditions. This market is expected to continue its upward trajectory due to the increasing awareness of canine health and the availability of advanced treatment options. However, market expansion is not without challenges. Merger and acquisition activities among market players are intensifying, leading to increased competition and potential consolidation. Furthermore, stringent global regulatory requirements pose significant hurdles for market entry and product approval, necessitating substantial investments in research and development.
- Companies seeking to capitalize on market opportunities must navigate these challenges effectively, focusing on innovative product development, strategic partnerships, and regulatory compliance to stay competitive in this dynamic market.
What will be the Size of the Canine Atopic Dermatitis Market during the forecast period?
- Canine atopic dermatis, a common skin condition in dogs, is characterized by itchy, inflamed skin caused by an overreaction of the immune system to environmental allergens. Veterinary practitioners often prescribe various treatments, including glucocorticoids and immunosuppressants, for managing the symptoms. However, the market for veterinary pharmaceuticals in this space is evolving, with new treatment options emerging. Monoclonal antibodies, such as IgE antibodies and Cytopoint (lokivetmab), are gaining popularity due to their targeted approach. Topical treatments, e-commerce platforms, and off-label uses of drugs like oclacitinib maleate (Apoquel) are also contributing to the market's growth. Other innovative therapies, like stem cell therapy and platelet-rich plasma (PRP), are being explored in regenerative medicines.
- Pet ownership continues to rise, leading to increased demand for effective dog allergy treatments, and pet insurance coverage for veterinary care is becoming more common. Environmental allergens remain a significant challenge, but ongoing research into the condition's genetic abnormalities offers hope for future advancements.
How is this Canine Atopic Dermatitis Industry segmented?
The canine atopic dermatitis industry research report provides comprehensive data (region-wise segment analysis), with forecasts and estimates in "USD million" for the period 2024-2028, as well as historical data from 2018-2022 for the following segments.
- Product
- Antihistamines
- Glucocorticoids
- Progestational compounds
- Others
- Geography
- North America
- US
- Canada
- Europe
- France
- Germany
- Italy
- UK
- Middle East and Africa
- APAC
- China
- India
- Japan
- South Korea
- South America
- Rest of World (ROW)
- North America
By Product Insights
The antihistamines segment is estimated to witness significant growth during the forecast period.
Antihistamines, a common treatment for allergies in both humans and animals, are integral to veterinary care. These drugs inhibit histamine type 1 (H1) receptors found in smooth muscles of the bronchi, gastrointestinal tract, uterus, and large blood vessels. Primarily used to alleviate symptoms of allergic reactions such as itching, runny nose, and urticaria in dogs, antihistamines can also address skin allergies. However, their usage is not without challenges. Side effects like sedation, impaired motor function, dry mouth and throat, dizziness, blurred vision, constipation, and urinary retention may hinder their adoption. In the realm of veterinary pharmaceuticals, antihistamines are one of several treatment options.
Canine atopic dermatitis, a chronic pruritic skin condition, is a significant health issue for dogs. Allergens, such as environmental and genetic abnormalities, can trigger this condition. Veterinary practitioners may prescribe antihistamines for symptomatic relief, but targeted therapies like monoclonal antibodies, stem cell therapy, and regenerative medicines are increasingly gaining popularity due to their potential for treatment efficacy. Pet humanization, the trend of treating pets as family members, has led to an increase in pet healthcare expenditure. Telemedicine and e-commerce platforms have made veterinary care more accessible, enabling pet owners to purchase antihistamines and other veterinary drugs conveniently. Pet insurance and personalized medicine, like platelet-rich plasma (PRP) therapy, are other emerging trends in the veterinary industry.
Molecular diagnostics and clinical studies play a crucial role in understanding the underlying causes of allergic reactions and developing new treatment options. Immunosuppressants and oral administration of treatments are also gaining traction in veterinary medicine. In the context of pet ownership, the focus is on optimizing treatment and ensuring animal welfare. The use of big data analytics and artificial intelligence in veterinary care is another area of growth, offering opportunities for improving treatment efficacy and diagnostic techniques. Functional foods and nutraceuticals are alternative treatment methods gaining popularity in the pet healthcare market. They can help strengthen the immune system and provide relief from allergic reactions.
Injectable treatments, topical treatments, and oral administration are various methods for administering these treatments. Veterinary hospitals and veterinary practitioners play a vital role in the diagnosis and treatment of allergies in dogs. They may recommend antihistamines, immunosuppressants, or targeted therapies based on the severity of the condition and the individual pet's needs. Allergy testing, including IgE antibodies, is essential for accurate diagnosis and effective treatment. In conclusion, antihistamines are an essential component of veterinary pharmaceuticals for treating allergies in dogs. However, their side effects limit their widespread adoption. The veterinary industry is evolving, with a focus on personalized medicine, emerging treatment options, and improved diagnostic techniques.
Pet humanization, telemedicine, and e-commerce are transforming the way veterinary care is delivered, making treatments more accessible to pet owners. The use of big data analytics and artificial intelligence is also revolutionizing veterinary medicine, offering opportunities for improved treatment efficacy and animal welfare.
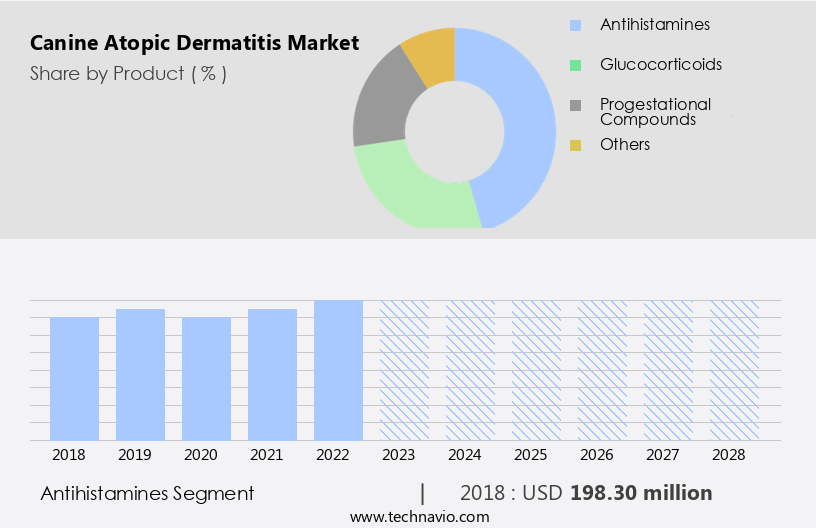
Get a glance at the market report of share of various segments Request Free Sample
The Antihistamines segment was valued at USD 198.30 million in 2018 and showed a gradual increase during the forecast period.
Regional Analysis
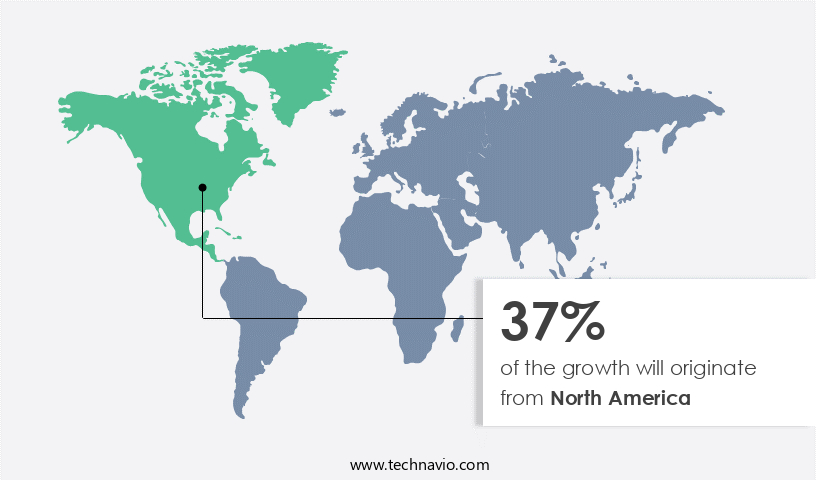
North America is estimated to contribute 37% to the growth of the global market during the forecast period.Technavio’s analysts have elaborately explained the regional trends and drivers that shape the market during the forecast period.
For more insights on the market size of various regions, Request Free Sample
In North America, home to over 85 million pet-owning households, the pet healthcare market is experiencing significant growth. This region, which includes the US, Canada, and Mexico, is a global leader in pet ownership. Elderly population growth and the trend of pet humanization are primary factors fueling this expansion. Pet owners increasingly view their animals as family members, leading to increased spending on their health and wellbeing. Veterinary dermatology, a key segment of the market, addresses conditions like Canine Atopic Dermatitis, which affects up to 10% of dogs. Allergens, both environmental and genetic, are common causes of itchy skin and skin lesions in pets.
Immunosuppressants, such as Glucocorticoids and targeted therapies, are often used to treat allergic reactions. However, there is a growing interest in alternative treatment options, including natural remedies, functional foods, and regenerative medicines like stem cell therapy. Telemedicine and e-commerce platforms have made veterinary care more accessible, enabling remote consultations and home-based treatments. Digital innovations, such as big data analytics and artificial intelligence, are improving treatment efficacy and optimization. Veterinary hospitals and practitioners offer a range of treatments, from oral administration and topical applications to injectable therapies and microbiota-based treatments. Pet insurance and personalized medicine, like Platelet-rich Plasma (PRP) and personalized nutrition, are becoming increasingly popular.
Off-label drugs and diagnostic techniques, such as molecular diagnostics and allergy testing, are also gaining traction. Gallant Therapeutics and Digitalis Ventures are among the companies contributing to the development of innovative veterinary pharmaceuticals. The pet healthcare market in North America is a dynamic and evolving landscape, driven by the needs and preferences of pet owners, advancements in veterinary care, and the growing recognition of pets as valued family members.
Market Dynamics
Our researchers analyzed the data with 2023 as the base year, along with the key drivers, trends, and challenges. A holistic analysis of drivers will help companies refine their marketing strategies to gain a competitive advantage.
What are the key market drivers leading to the rise in the adoption of Canine Atopic Dermatitis Industry?
- Increase in pet humanization is the key driver of the market.
- The pet care industry is witnessing notable growth due to the increasing trend of pets being considered as family members. Pet owners' focus on ensuring their pets' well-being is leading to a significant demand for high-quality healthcare products and veterinary services. According to the Centers for Disease Control and Prevention (CDC), approximately 40 million households in the US own a cat as a pet. This number underscores the increasing pet population and the subsequent demand for superior pet care solutions. In response to this trend, pet care product manufacturers are prioritizing the use of premium ingredients and stringent manufacturing standards, ensuring parity with those used for human products.
- This commitment to quality is a key market dynamic, as pet owners seek to provide their pets with the best possible care. The expanding pet care market is a testament to the deep bond between pets and their owners and the lengths to which they will go to ensure their pets' health and longevity.
What are the market trends shaping the Canine Atopic Dermatitis Industry?
- Increase in merger and acquisition is the upcoming market trend.
- The market is experiencing notable activities as key players forge strategic collaborations to strengthen their market position. Merck and Co., Inc. Completed the acquisition of Vaki in December 2019, while Elanco Animal Health Inc. Separated from Eli Lilly and Co. In March 2019. In the same year, Virbac Group acquired certain parasiticide development projects from Elanco and obtained global rights to Itrafungol and Clomicalm. In 2020, the European Commission approved Elanco Animal Health Inc.'s application for marketing authorization of Cytopoint, a canine atopic dermatitis treatment. These strategic moves reflect the competitive landscape's dynamic nature, with companies continually seeking innovative solutions and expanding their product offerings to cater to the growing demand for effective treatments for canine atopic dermatitis.
What challenges does the Canine Atopic Dermatitis Industry face during its growth?
- Stringent global regulatory requirements is a key challenge affecting the industry growth.
- The market is subject to stringent regulatory requirements, which can impact market growth. Regulatory agencies have intensified their focus on ensuring the safety and efficacy of animal drugs, including those used to treat canine atopic dermatitis. This scrutiny can present challenges for market participants, as new drugs must undergo rigorous approval processes before being imported from one country to another. Additionally, the FDA conducts field examinations and reanalyzes drug samples to ensure compliance with applicable standards and label requirements.
- These regulations aim to protect animal health and maintain consumer trust, but they can add complexity and cost to market operations. Adherence to these regulations is essential for market success.
Exclusive Customer Landscape
The canine atopic dermatitis market forecasting report includes the adoption lifecycle of the market, covering from the innovator’s stage to the laggard’s stage. It focuses on adoption rates in different regions based on penetration. Furthermore, the canine atopic dermatitis market report also includes key purchase criteria and drivers of price sensitivity to help companies evaluate and develop their market growth analysis strategies.
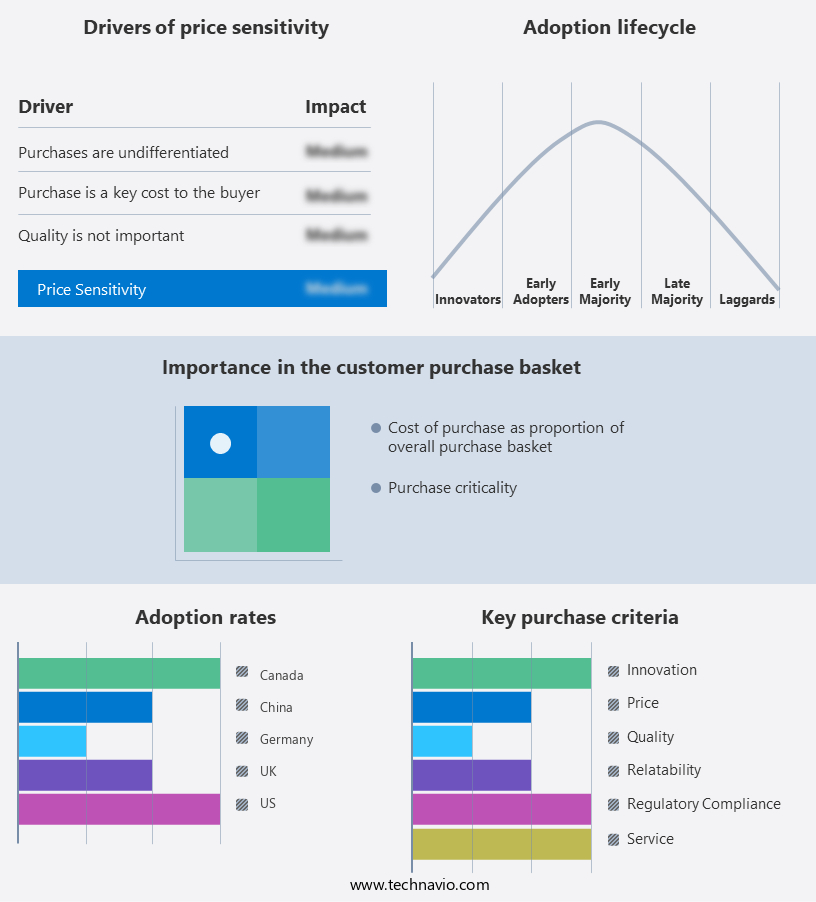
Customer Landscape
Key Companies & Market Insights
Companies are implementing various strategies, such as strategic alliances, canine atopic dermatitis market forecast, partnerships, mergers and acquisitions, geographical expansion, and product/service launches, to enhance their presence in the industry.
AB Science SA - The biotech firm introduces allergy relief solutions for canine atopic dermatitis under the brand name Bioceltix. These innovative offerings focus on eliminating allergens that trigger sensitization in dogs, enhancing their overall well-being. By utilizing advanced technologies, Bioceltix addresses the root cause of this common skin condition, ensuring effective treatment and improved quality of life for affected animals.
The industry research and growth report includes detailed analyses of the competitive landscape of the market and information about key companies, including:
- AB Science SA
- Bimeda Holdings Ltd.
- Bioceltix Spolka Akcyjna
- Bioiberica S.A.U.
- Boehringer Ingelheim International GmbH
- Ceva Sante Animale
- Dechra Pharmaceuticals Plc
- Elanco Animal Health Inc.
- Merck and Co. Inc.
- Novartis AG
- Toray Industries Inc.
- Vetoquinol UK Ltd.
- Vimian Group AB
- Virbac Group
- Zoetis Inc.
Qualitative and quantitative analysis of companies has been conducted to help clients understand the wider business environment as well as the strengths and weaknesses of key industry players. Data is qualitatively analyzed to categorize companies as pure play, category-focused, industry-focused, and diversified; it is quantitatively analyzed to categorize companies as dominant, leading, strong, tentative, and weak.
Research Analyst Overview
Canine Atopic Dermatitis: A Growing Market Driven by Pet Humanization and Advanced Treatment Options Canine atopic dermatitis, a chronic inflammatory skin condition in dogs, is a significant health issue that continues to gain attention in the veterinary community. This condition, characterized by itchy skin and various skin lesions, is often triggered by environmental allergens. The increasing awareness of pet humanization and the advancement of veterinary healthcare have led to a growing market for canine atopic dermatitis treatments. Pet healthcare expenditure has seen a steady increase as pet owners prioritize their pets' well-being. According to market dynamics, retail distribution channels, including e-commerce platforms and veterinary hospitals, have expanded their offerings to cater to the demand for canine atopic dermatitis treatments.
This expansion includes a wide range of treatment options, from oral administration of immunosuppressants and targeted therapies to topical treatments and injectable medications. Veterinary dermatology has seen significant advancements in recent years, with the emergence of molecular diagnostics and personalized medicine. These diagnostic techniques allow for a more accurate identification of allergens and genetic abnormalities, enabling veterinary practitioners to optimize treatments for individual dogs. Telemedicine has also played a role in the accessibility of veterinary care, allowing for remote consultations and home-based treatment plans for canine atopic dermatitis. The market for canine atopic dermatitis treatments is diverse, with various treatment modalities available.
Oral administration of immunosuppressants, such as glucocorticoids, remains a common treatment option. However, the development of targeted therapies, including monoclonal antibodies and antihistamines, has shown promising results in improving treatment efficacy. Functional foods and nutraceuticals have gained popularity as natural treatment options for canine atopic dermatitis. These alternatives offer a more holistic approach to managing the condition, addressing the underlying causes and promoting overall pet health. The integration of artificial intelligence and big data analytics in veterinary pharmaceuticals has also led to the development of personalized treatment plans based on individual pet data. The market for canine atopic dermatitis treatments is expected to continue growing, driven by the increasing trend of pet humanization and the advancement of veterinary healthcare.
As research and development efforts continue, new treatment options, such as regenerative medicines like stem cell therapy, are emerging, offering even more effective solutions for managing this condition in dogs. In the veterinary community, there is a growing emphasis on animal welfare and optimizing treatments for canine atopic dermatitis. Clinical studies and ongoing research aim to improve our understanding of the condition and develop more effective, long-term treatment strategies. With the continued support of pet owners and the veterinary industry, the market for canine atopic dermatitis treatments is poised for significant growth.
|
Market Scope |
|
|
Report Coverage |
Details |
|
Page number |
160 |
|
Base year |
2023 |
|
Historic period |
2018-2022 |
|
Forecast period |
2024-2028 |
|
Growth momentum & CAGR |
Accelerate at a CAGR of 5.8% |
|
Market growth 2024-2028 |
USD 231.3 million |
|
Market structure |
Fragmented |
|
YoY growth 2023-2024(%) |
5.4 |
|
Key countries |
US, Canada, China, Germany, UK, Japan, France, India, Italy, and South Korea |
|
Competitive landscape |
Leading Companies, Market Positioning of Companies, Competitive Strategies, and Industry Risks |
What are the Key Data Covered in this Canine Atopic Dermatitis Market Research and Growth Report?
- CAGR of the Canine Atopic Dermatitis industry during the forecast period
- Detailed information on factors that will drive the growth and forecasting between 2024 and 2028
- Precise estimation of the size of the market and its contribution of the industry in focus to the parent market
- Accurate predictions about upcoming growth and trends and changes in consumer behaviour
- Growth of the market across North America, Europe, Asia, and Rest of World (ROW)
- Thorough analysis of the market’s competitive landscape and detailed information about companies
- Comprehensive analysis of factors that will challenge the canine atopic dermatitis market growth of industry companies
We can help! Our analysts can customize this canine atopic dermatitis market research report to meet your requirements.
 RIA -
RIA - 
