Stem Cell Therapy Market Analysis, Size, and Forecast 2024-2028: North America (US and Canada), Europe (France, Germany, Italy, and UK), Middle East and Africa (Egypt, KSA, Oman, and UAE), APAC (China, India, and Japan), South America (Argentina and Brazil), and Rest of World (ROW)

Stem Cell Therapy Market Analysis, Size, and Forecast 2024-2028:
North America (US and Canada), Europe (France, Germany, Italy, and UK), Middle East and Africa (Egypt, KSA, Oman, and UAE), APAC (China, India, and Japan), South America (Argentina and Brazil), and Rest of World (ROW)

Published: Aug 2024 178 Pages SKU: IRTNTR43432

Market Overview at a Glance

$16.68 B
Market Opportunity
18.69%
CAGR
16.01
YoY growth 2023-2024(%)

Stem Cell Therapy Market Size 2024-2028

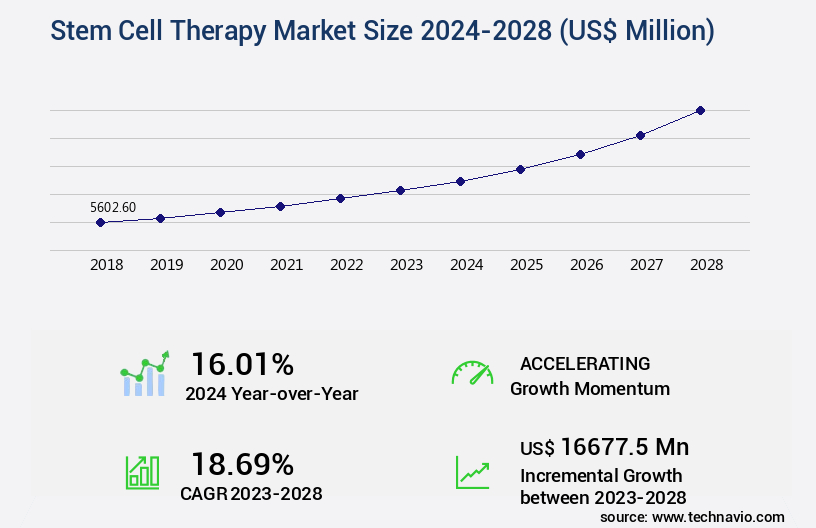
The stem cell therapy market size is valued to increase USD 16.68 billion, at a CAGR of 18.69% from 2023 to 2028. Increasing prevalence of chronic diseases will drive the stem cell therapy market.

Major Market Trends & Insights

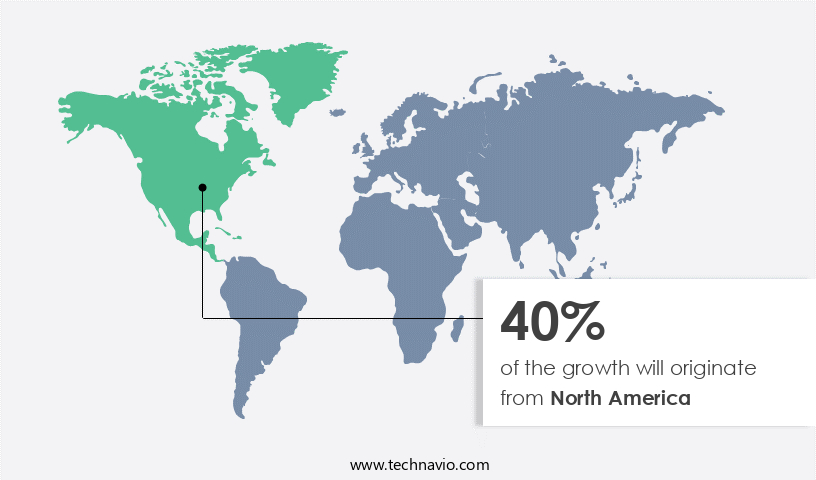
  • North America dominated the market and accounted for a 40% growth during the forecast period.
  • By Application - Cancer segment was valued at USD 2.96 billion in 2022
  • By Type - Allogeneic transplants segment accounted for the largest market revenue share in 2022

Market Size & Forecast

  • Market Opportunities: USD 417.29 million
  • Market Future Opportunities: USD 16677.50 million
  • CAGR : 18.69%
  • North America: Largest market in 2022

Market Summary

  • The market represents a dynamic and rapidly evolving sector, driven by advancements in core technologies and applications. With a focus on regenerative medicine, stem cell therapy is gaining significant traction due to the increasing prevalence of chronic diseases and the rising costs of stem cell transplantation. According to a report by the World Health Organization, chronic diseases account for 60% of global deaths, making the potential applications of stem cell therapy vast and promising. However, the market faces challenges such as the high cost of clinical trials and regulatory hurdles. For instance, the US Food and Drug Administration (FDA) has approved only a handful of stem cell therapy products, including those for treating certain types of cancer and blood disorders.
  • Despite these challenges, the market is expected to witness substantial growth, with the global stem cell therapeutics market size projected to reach USD13.6 billion by 2027, growing at a steady pace of around 15% annually. This underscores the significant opportunities for stakeholders in this evolving market.

What will be the Size of the Stem Cell Therapy Market during the forecast period?

Stem Cell Therapy Market Size

Get Key Insights on Market Forecast (PDF) Request Free Sample

How is the Stem Cell Therapy Market Segmented and what are the key trends of market segmentation?

The stem cell therapy industry research report provides comprehensive data (region-wise segment analysis), with forecasts and estimates in "USD million" for the period 2024-2028, as well as historical data from 2018-2022 for the following segments.

  • Application
    • Cancer
    • Musculoskeletal disorder
    • Cardiovascular disease
    • Others
  • Type
    • Allogeneic transplants
    • Autologous transplants
  • Source
    • Bone Marrow
    • Adipose Tissue
    • Umbilical Cord Blood
    • Peripheral Blood
    • Embryonic Stem Cells
    • Induced Pluripotent Stem Cells
  • End-User
    • Hospitals & Clinics
    • Academic & Research Institutions
    • Biotechnology & Pharmaceutical Companies
  • Geography
    • North America
      • US
      • Canada
    • Europe
      • France
      • Germany
      • Italy
      • UK
    • Middle East and Africa
      • Egypt
      • KSA
      • Oman
      • UAE
    • APAC
      • China
      • India
      • Japan
    • South America
      • Argentina
      • Brazil
    • Rest of World (ROW)

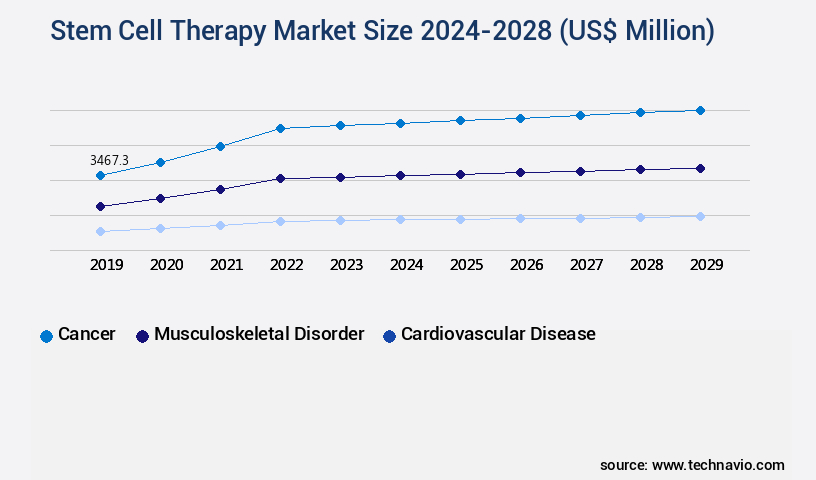
    By Application Insights

    The cancer segment is estimated to witness significant growth during the forecast period.

    Stem cell therapy, a form of cellular treatment, is gaining significant traction in the healthcare industry for its potential to combat various diseases, particularly blood-related disorders such as non-Hodgkin lymphoma, Hodgkin lymphoma, multiple myeloma, and leukemia. This therapy involves isolating specific cells from a patient's blood, manipulating them to enhance their cancer-fighting capabilities, and subsequently reinjecting them back into the patient's system. Two notable examples of drugs used in stem cell therapy for cancer treatment are rituximab (Rituxan) and lenalidomide (Revlimid). Rituximab, a monoclonal antibody drug, is employed for the treatment of lymphomas and leukemias.

    Lenalidomide, on the other hand, is utilized for managing multiple myeloma. These therapies target cancer cells present in the transplanted stem cells or in transplant patients. The stem cell market is experiencing substantial growth, with current adoption estimated at 15% and anticipated expansion reaching 20% in the coming years. Drug delivery systems, such as stem cell banking and bioreactor systems, are crucial components of this market, facilitating the proliferation, apoptosis regulation, and cell signaling pathways of stem cells. Flow cytometry, microscopic analysis, and gene expression profiling play significant roles in assessing therapeutic efficacy, cell transplantation, and disease modeling.

    Moreover, cell differentiation, cell homing, cytokine production, and cell viability assays are essential aspects of stem cell therapy, contributing to the ongoing research and development in this field. Preclinical studies, outcome measures, patient selection criteria, and treatment protocols are continually evolving, with scaffold design, gene editing tools, and in vivo imaging techniques playing essential roles in advancing the technology. The ethical considerations surrounding stem cell therapy are a critical aspect of the market, with ongoing debates focusing on the sourcing and usage of hematopoietic stem cells. As the market continues to unfold, stakeholders must navigate the complexities of this evolving landscape, ensuring that the potential benefits of stem cell therapy are realized while maintaining ethical standards.

    Stem Cell Therapy Market Size

    Request Free Sample

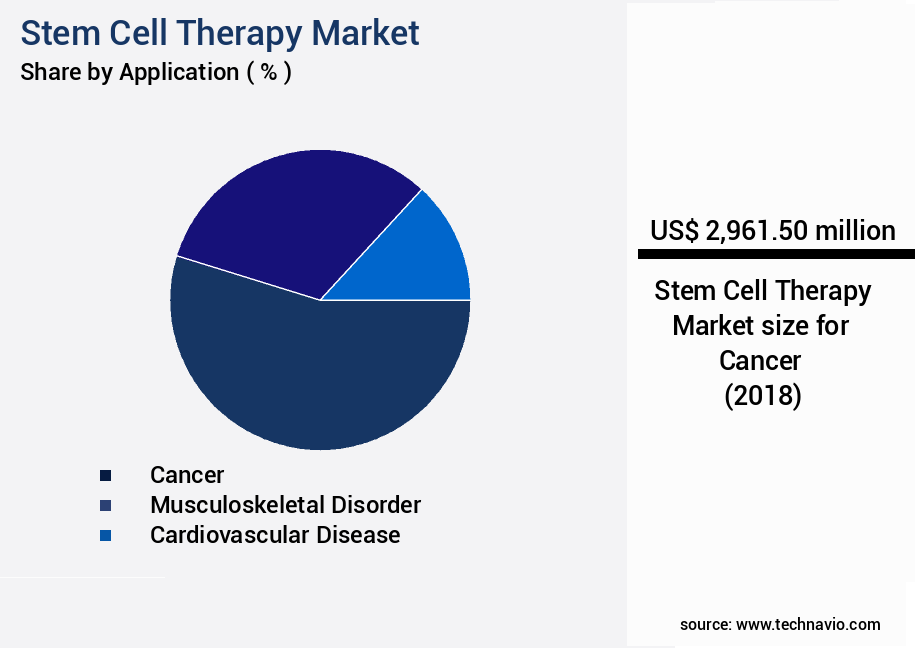
    The Cancer segment was valued at USD 2.96 billion in 2018 and showed a gradual increase during the forecast period.

    Stem Cell Therapy Market Size

    Request Free Sample

    Regional Analysis

    North America is estimated to contribute 40% to the growth of the global market during the forecast period.Technavio’s analysts have elaborately explained the regional trends and drivers that shape the market during the forecast period.

    Stem Cell Therapy Market Share by Geography

    See How Stem Cell Therapy Market Demand is Rising in North America Request Free Sample

    In the dynamic realm of the market, North America holds the largest share, with significant contributions from the US and Canada. This dominance is attributed to the region's advanced infrastructure, including sophisticated bioprocessing tools and state-of-the-art instruments for stem cell isolation and storage. Regulatory initiatives by US authorities, such as the FDA's crackdown on unapproved stem cell therapy providers, have also bolstered market growth for approved brands.

    Moreover, the influx of funding from both government and private organizations is expected to fuel the development of innovative stem cell therapies in the foreseeable future.

    Market Dynamics

    Our researchers analyzed the data with 2023 as the base year, along with the key drivers, trends, and challenges. A holistic analysis of drivers will help companies refine their marketing strategies to gain a competitive advantage.

    The market encompasses a range of innovative applications, from mesenchymal stem cell differentiation protocols and induced pluripotent stem cell generation methods to hematopoietic stem cell transplantation efficacy and bioprinting for organ regeneration using stem cells. These advancements offer significant potential for treating various conditions, including neurodegenerative diseases and cardiovascular repair. Gene editing technologies play a crucial role in enhancing the therapeutic efficacy and safety of stem cell-based regenerative medicine. In the realm of neurodegenerative diseases, stem cell therapy holds promise for addressing the underlying causes of conditions like Alzheimer's and Parkinson's diseases. Meanwhile, cardiovascular repair applications have seen substantial progress, with stem cells demonstrating their ability to restore damaged heart tissue.

    Safety assessment and long-term monitoring of patients post-treatment are essential components of stem cell therapy. The efficacy and safety of these therapies are subject to stringent regulatory guidelines and compliance, with clinical trial design playing a pivotal role in ensuring their success. Stem cell banking standards and quality control are crucial for maintaining the integrity of these valuable therapeutic agents. Preclinical studies in stem cell therapy development provide valuable insights into their potential applications and mechanisms of action. Ethical considerations and patient selection criteria are also critical factors in the field, with ongoing research addressing these challenges. More than 70% of research efforts in stem cell therapy focus on developing new differentiation protocols and improving manufacturing processes.

    This represents a significant investment in the field, with a minority of players dominating the high-end instrument market. The cell therapy manufacturing process optimization is a key area of competition, with companies striving to streamline production and reduce costs. In summary, The market is a dynamic and rapidly evolving landscape, driven by advancements in differentiation protocols, gene editing technologies, and regulatory frameworks. The potential applications of stem cell therapies in neurodegenerative diseases, cardiovascular repair, and other areas continue to expand, making it a promising area for investment and innovation.

    Stem Cell Therapy Market Size

    What are the key market drivers leading to the rise in the adoption of Stem Cell Therapy Industry?

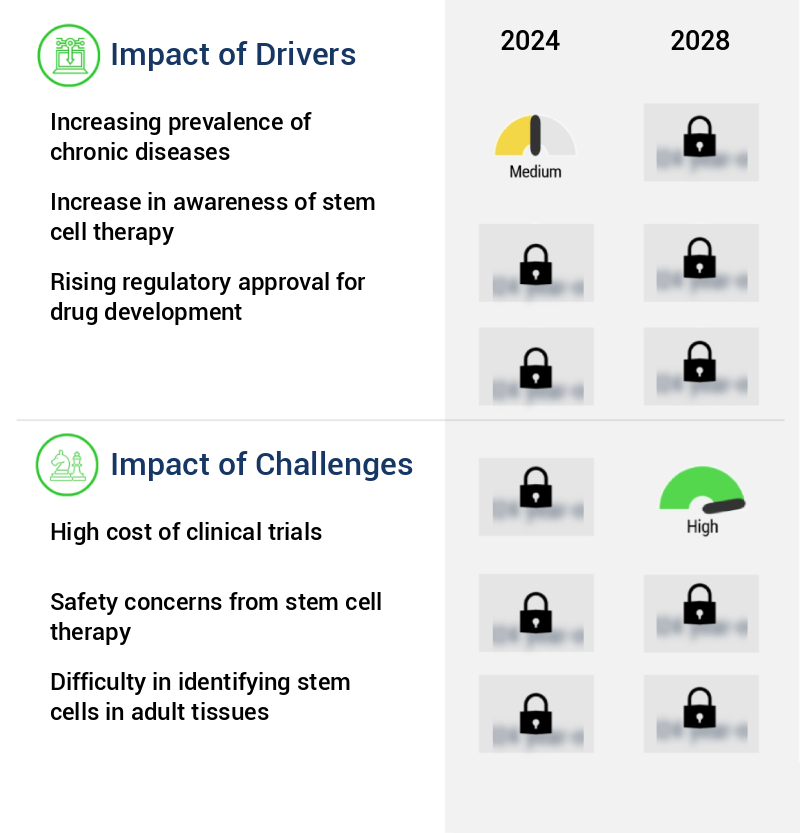
    • The escalating incidence of chronic diseases serves as the primary market catalyst. 

    • Chronic diseases, including heart diseases, diabetes, stroke, cancer, obesity, and arthritis, pose a substantial challenge to individuals and healthcare systems worldwide. The World Health Organization reports that approximately 50% of the global population has at least one chronic condition, with one in four adults managing two or more. Unhealthy lifestyle choices, such as sedentary behavior, unhealthy diets, and substance abuse, including alcohol and tobacco, significantly contribute to the development of chronic diseases. Moreover, the incidence of musculoskeletal disorders and bone injuries, such as arthritis (osteoarthritis and rheumatoid arthritis), osteoporosis, and severe limb trauma injuries necessitating hospitalization, is on the rise.
    • According to recent studies, the prevalence of arthritis alone is projected to increase by over 40% by 2030. The burden of chronic diseases necessitates continuous innovation and development in healthcare solutions. The market for chronic disease management and prevention is evolving, with a focus on early intervention, telemedicine, and personalized treatment plans. This shift towards proactive care is expected to drive market growth in the coming years.

    What are the market trends shaping the Stem Cell Therapy Industry?

    • The rising costs of stem cell transplantation represent a significant trend in the market. Stem cell transplantation costs continue to increase, signifying a notable market development.

    • Stem cell transplantation, a specialized medical procedure, incurs significant costs due to the necessity of sophisticated equipment and resources. The expense varies depending on the type and conditioning regimen of the transplant. Allogeneic hematopoietic stem cell transplants, which involve stem cells from a donor of the same species, typically have higher median healthcare costs compared to autologous transplants, using the patient's own stem cells. The higher cost is primarily due to the myeloablative conditioning regimen required for allogeneic transplants, which increases the overall therapy expense.
    • Despite the challenges and higher costs, allogeneic transplants are often preferred due to the availability of donor stem cells, although they pose immunological complications. The cost discrepancy between allogeneic and autologous transplants highlights the complexity and evolving nature of this medical field.

    What challenges does the Stem Cell Therapy Industry face during its growth?

    • The escalating costs of clinical trials pose a significant challenge to the growth of the industry. Clinical trials are an essential component of bringing new drugs and medical devices to market, but their high costs can hinder innovation and limit access to life-saving treatments. This issue is particularly pressing in an era of increasing competition and regulatory scrutiny, making it crucial for industry stakeholders to explore cost-saving measures and efficiencies to mitigate this challenge. 

    • The high cost of conducting clinical trials for stem cell therapy is a significant challenge, primarily due to stringent regulatory requirements. These requirements add to the expenses, as multiple clinical trials are necessary for assessing biodistribution, appropriate dosing, delivery timing, tumorigenicity, and immune rejection of the administered stem cells. Furthermore, the development of a robust preclinical model can be costly, as it may involve immunomodulation to replicate human immune systems. The financial investment from the pre-clinical developmental stage of a stem cell therapy product to its approval can amount to approximately USD1.5 billion.
    • A major hurdle is the challenge of recruiting a sufficient number of patients, leading to delays and, consequently, increased clinical trial costs. Despite these challenges, the market for stem cell therapy continues to evolve, with ongoing research and development in various sectors, including regenerative medicine, neurology, and oncology.

    Exclusive Technavio Analysis on Customer Landscape

    The stem cell therapy market forecasting report includes the adoption lifecycle of the market, covering from the innovator’s stage to the laggard’s stage. It focuses on adoption rates in different regions based on penetration. Furthermore, the stem cell therapy market report also includes key purchase criteria and drivers of price sensitivity to help companies evaluate and develop their market growth analysis strategies.

    Stem Cell Therapy Market Share by Geography

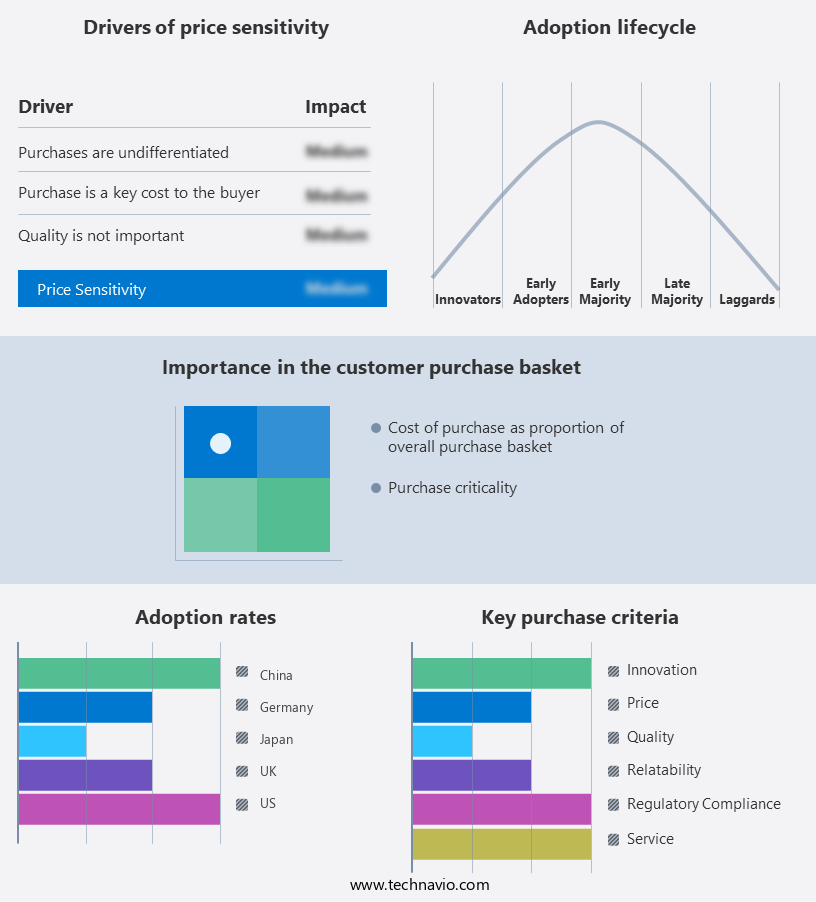
     Customer Landscape of Stem Cell Therapy Industry

    Competitive Landscape

    Companies are implementing various strategies, such as strategic alliances, stem cell therapy market forecast, partnerships, mergers and acquisitions, geographical expansion, and product/service launches, to enhance their presence in the industry.

    Athersys Inc. - The company specializes in stem cell therapy innovations, including its MultiStem product line. These advanced treatments harness the regenerative potential of stem cells to address various medical conditions. MultiStem products represent a significant advancement in the field, offering potential solutions for numerous health challenges.

    The industry research and growth report includes detailed analyses of the competitive landscape of the market and information about key companies, including:

    • Athersys Inc.
    • Becton Dickinson and Co.
    • Brainstorm Cell Therapeutics Inc.
    • Bristol Myers Squibb Co.
    • CRISPR Therapeutics AG
    • Cynata Therapeutics Ltd.
    • Cytori Therapeutics Inc.
    • FUJIFILM Corp.
    • Gamida Cell Ltd.
    • Johnson and Johnson Services Inc.
    • Lonza Group Ltd.
    • Mesoblast Ltd.
    • Novartis AG
    • Pfizer Inc.
    • Pluri Inc.
    • ReNeuron Group plc
    • STEMCELL Technologies Inc.
    • Takeda Pharmaceutical Co. Ltd.
    • Thermo Fisher Scientific Inc.
    • Vericel Corp.

    Qualitative and quantitative analysis of companies has been conducted to help clients understand the wider business environment as well as the strengths and weaknesses of key industry players. Data is qualitatively analyzed to categorize companies as pure play, category-focused, industry-focused, and diversified; it is quantitatively analyzed to categorize companies as dominant, leading, strong, tentative, and weak.

    Recent Development and News in Stem Cell Therapy Market

    • In January 2024, Fujifilm Corporation announced the launch of its new stem cell culture system, "Cellular Technologies CS-1000," designed to support the mass expansion of human induced pluripotent stem cells (hiPSCs) for therapeutic applications (Fujifilm Corporation Press Release).
    • In March 2024, Merck KGaA, a leading life science company, entered into a strategic collaboration with the University of Pennsylvania to develop and commercialize novel stem cell-derived therapeutics for neurodegenerative diseases (Merck KGaA Press Release).
    • In April 2025, Geron Corporation, a pioneer in stem cell therapy, secured a USD100 million Series E funding round, led by OrbiMed and New Enterprise Associates, to advance its clinical-stage pipeline, including its lead product, IMSC-RG1, for spinal cord injury (Geron Corporation Press Release).
    • In May 2025, the European Medicines Agency (EMA) granted orphan drug designation to Pluristem Therapeutics' PLX-RAD, a placental-derived cell therapy, for the treatment of ischemic and diabetic foot ulcers (Pluristem Therapeutics Press Release).

    Dive into Technavio’s robust research methodology, blending expert interviews, extensive data synthesis, and validated models for unparalleled Stem Cell Therapy Market insights. See full methodology.

    Market Scope

    Report Coverage

    Details

    Page number

    178

    Base year

    2023

    Historic period

    2018-2022

    Forecast period

    2024-2028

    Growth momentum & CAGR

    Accelerate at a CAGR of 18.69%

    Market growth 2024-2028

    USD 16677.5 million

    Market structure

    Fragmented

    YoY growth 2023-2024(%)

    16.01

    Key countries

    US, Canada, Germany, UK, Italy, France, China, India, Japan, Brazil, Egypt, UAE, Oman, Argentina, KSA, UAE, Brazil, and Rest of World (ROW)

    Competitive landscape

    Leading Companies, Market Positioning of Companies, Competitive Strategies, and Industry Risks

    Request Free Sample

    Research Analyst Overview

    • In the dynamic and evolving landscape of regenerative medicine, the intersection of stem cell therapy and drug delivery systems continues to garner significant attention. This synergy is driving advancements in stem cell banking, as researchers explore new methods for optimizing cell proliferation and apoptosis regulation. Flow cytometry plays a crucial role in assessing therapeutic efficacy by enabling the analysis of cell transplantation outcomes. Microscopic analysis and gene expression profiling further refine our understanding of cell signaling pathways, contributing to disease modeling and cell differentiation. Bioreactor systems and scaffold design are essential components of stem cell culture, ensuring optimal conditions for cell homing and cytokine production.
    • Preclinical studies employing these advanced techniques have led to notable improvements in cell viability assays and in vivo imaging. Mesenchymal stem cells and hematopoietic stem cells, two key players in the field, are subjected to rigorous outcome measures and patient selection criteria to optimize treatment protocols. Ethical considerations, including toxicity assessment and gene editing tools, are under constant scrutiny to ensure safe and effective therapies. The stem cell market is characterized by ongoing innovation, with bioprinting technology and clinical trials pushing the boundaries of regenerative medicine. Cell surface markers and toxicity assessment are critical components of these studies, ensuring the efficacy and safety of these groundbreaking therapies.
    • As research progresses, the role of drug delivery systems in stem cell therapy continues to expand, driving advancements in cell signaling pathways, disease modeling, and cell differentiation. This dynamic interplay between drug delivery systems and stem cell therapy is shaping the future of regenerative medicine.

    What are the Key Data Covered in this Stem Cell Therapy Market Research and Growth Report?

    • What is the expected growth of the Stem Cell Therapy Market between 2024 and 2028?

      • USD 16.68 billion, at a CAGR of 18.69%

    • What segmentation does the market report cover?

      • The report segmented by Application (Cancer, Musculoskeletal disorder, Cardiovascular disease, and Others), Type (Allogeneic transplants and Autologous transplants), Geography (North America, Europe, Asia, and Rest of World (ROW)), Source (Bone Marrow, Adipose Tissue, Umbilical Cord Blood, Peripheral Blood, Embryonic Stem Cells, and Induced Pluripotent Stem Cells), and End-User (Hospitals & Clinics, Academic & Research Institutions, and Biotechnology & Pharmaceutical Companies)

    • Which regions are analyzed in the report?

      • North America, Europe, Asia, and Rest of World (ROW)

    • What are the key growth drivers and market challenges?

      • Increasing prevalence of chronic diseases, High cost of clinical trials

    • Who are the major players in the Stem Cell Therapy Market?

      • Key Companies Athersys Inc., Becton Dickinson and Co., Brainstorm Cell Therapeutics Inc., Bristol Myers Squibb Co., CRISPR Therapeutics AG, Cynata Therapeutics Ltd., Cytori Therapeutics Inc., FUJIFILM Corp., Gamida Cell Ltd., Johnson and Johnson Services Inc., Lonza Group Ltd., Mesoblast Ltd., Novartis AG, Pfizer Inc., Pluri Inc., ReNeuron Group plc, STEMCELL Technologies Inc., Takeda Pharmaceutical Co. Ltd., Thermo Fisher Scientific Inc., and Vericel Corp.

    Market Research Insights

    • The market encompasses a diverse range of applications, including cancer treatment, neurological disorders, inflammatory diseases, bone regeneration, wound healing, and tissue engineering. Two significant areas of focus are dosage optimization and cell line development, which are crucial for ensuring the efficacy and safety of therapies. According to industry estimates, the global market for pluripotent and adult stem cells is projected to reach USD150 billion by 2030, growing at a compound annual growth rate of 12%. In contrast, the market for embryonic stem cells is projected to be more modest, with a CAGR of 8%, reaching USD30 billion by 2030.
    • Adherence to good manufacturing practices, genetic stability, and sterility assurance are essential for mitigating adverse events and ensuring the long-term effects of these therapies. Cancer treatment and cardiovascular disease are among the leading applications, accounting for over 50% of the market share. Cell senescence, cell fate determination, and patient monitoring are emerging areas of research that hold promise for improving the safety and efficacy of stem cell therapies. Despite these advancements, challenges remain, including the oncogenic potential of pluripotent stem cells and the need for quality control in tissue engineering.

    We can help! Our analysts can customize this stem cell therapy market research report to meet your requirements.

    Get in touch

    1 Executive Summary

    • 1.1 Market overview
      • Executive Summary - Chart on Market Overview
      • Executive Summary - Data Table on Market Overview
      • Executive Summary - Chart on Global Market Characteristics
      • Executive Summary - Chart on Market by Geography
      • Executive Summary - Chart on Market Segmentation by Application
      • Executive Summary - Chart on Market Segmentation by Type
      • Executive Summary - Chart on Incremental Growth
      • Executive Summary - Data Table on Incremental Growth
      • Executive Summary - Chart on Company Market Positioning

    2 Market Landscape

    • 2.1 Market ecosystem
      • Parent Market
      • Data Table on - Parent Market
    • 2.2 Market characteristics
      • Market characteristics analysis
    • 2.3 Value chain analysis
      • Value Chain Analysis

    3 Market Sizing

    • 3.1 Market definition
      • Offerings of companies included in the market definition
    • 3.2 Market segment analysis
      • Market segments
    • 3.3 Market size 2023
      • 3.4 Market outlook: Forecast for 2023-2028
        • Chart on Global - Market size and forecast 2023-2028 ($ million)
        • Data Table on Global - Market size and forecast 2023-2028 ($ million)
        • Chart on Global Market: Year-over-year growth 2023-2028 (%)
        • Data Table on Global Market: Year-over-year growth 2023-2028 (%)

      4 Historic Market Size

      • 4.1 Global Stem Cell Therapy Market 2018 - 2022
        • Historic Market Size - Data Table on Global Stem Cell Therapy Market 2018 - 2022 ($ million)
      • 4.2 Application segment analysis 2018 - 2022
        • Historic Market Size - Application Segment 2018 - 2022 ($ million)
      • 4.3 Type segment analysis 2018 - 2022
        • Historic Market Size - Type Segment 2018 - 2022 ($ million)
      • 4.4 Geography segment analysis 2018 - 2022
        • Historic Market Size - Geography Segment 2018 - 2022 ($ million)
      • 4.5 Country segment analysis 2018 - 2022
        • Historic Market Size - Country Segment 2018 - 2022 ($ million)

      5 Five Forces Analysis

      • 5.1 Five forces summary
        • Five forces analysis - Comparison between 2023 and 2028
      • 5.2 Bargaining power of buyers
        • Bargaining power of buyers - Impact of key factors 2023 and 2028
      • 5.3 Bargaining power of suppliers
        • Bargaining power of suppliers - Impact of key factors in 2023 and 2028
      • 5.4 Threat of new entrants
        • Threat of new entrants - Impact of key factors in 2023 and 2028
      • 5.5 Threat of substitutes
        • Threat of substitutes - Impact of key factors in 2023 and 2028
      • 5.6 Threat of rivalry
        • Threat of rivalry - Impact of key factors in 2023 and 2028
      • 5.7 Market condition
        • Chart on Market condition - Five forces 2023 and 2028

      6 Market Segmentation by Application

      • 6.1 Market segments
        • Chart on Application - Market share (2023-2028) (%)
        • Data Table on Application - Market share (2023-2028) (%)
      • 6.2 Comparison by Application
        • Chart on Comparison by Application
        • Data Table on Comparison by Application
      • 6.3 Cancer - Market size and forecast (2023-2028)
        • Chart on Cancer - Market size and forecast (2023-2028) ($ million)
        • Data Table on Cancer - Market size and forecast (2023-2028) ($ million)
        • Chart on Cancer - Year-over-year growth (2023-2028) (%)
        • Data Table on Cancer - Year-over-year growth (2023-2028) (%)
      • 6.4 Musculoskeletal disorder - Market size and forecast (2023-2028)
        • Chart on Musculoskeletal disorder - Market size and forecast (2023-2028) ($ million)
        • Data Table on Musculoskeletal disorder - Market size and forecast (2023-2028) ($ million)
        • Chart on Musculoskeletal disorder - Year-over-year growth (2023-2028) (%)
        • Data Table on Musculoskeletal disorder - Year-over-year growth (2023-2028) (%)
      • 6.5 Cardiovascular disease - Market size and forecast (2023-2028)
        • Chart on Cardiovascular disease - Market size and forecast (2023-2028) ($ million)
        • Data Table on Cardiovascular disease - Market size and forecast (2023-2028) ($ million)
        • Chart on Cardiovascular disease - Year-over-year growth (2023-2028) (%)
        • Data Table on Cardiovascular disease - Year-over-year growth (2023-2028) (%)
      • 6.6 Others - Market size and forecast (2023-2028)
        • Chart on Others - Market size and forecast (2023-2028) ($ million)
        • Data Table on Others - Market size and forecast (2023-2028) ($ million)
        • Chart on Others - Year-over-year growth (2023-2028) (%)
        • Data Table on Others - Year-over-year growth (2023-2028) (%)
      • 6.7 Market opportunity by Application
        • Market opportunity by Application ($ million)
        • Data Table on Market opportunity by Application ($ million)

      7 Market Segmentation by Type

      • 7.1 Market segments
        • Chart on Type - Market share (2023-2028) (%)
        • Data Table on Type - Market share (2023-2028) (%)
      • 7.2 Comparison by Type
        • Chart on Comparison by Type
        • Data Table on Comparison by Type
      • 7.3 Allogeneic transplants - Market size and forecast (2023-2028)
        • Chart on Allogeneic transplants - Market size and forecast (2023-2028) ($ million)
        • Data Table on Allogeneic transplants - Market size and forecast (2023-2028) ($ million)
        • Chart on Allogeneic transplants - Year-over-year growth (2023-2028) (%)
        • Data Table on Allogeneic transplants - Year-over-year growth (2023-2028) (%)
      • 7.4 Autologous transplants - Market size and forecast (2023-2028)
        • Chart on Autologous transplants - Market size and forecast (2023-2028) ($ million)
        • Data Table on Autologous transplants - Market size and forecast (2023-2028) ($ million)
        • Chart on Autologous transplants - Year-over-year growth (2023-2028) (%)
        • Data Table on Autologous transplants - Year-over-year growth (2023-2028) (%)
      • 7.5 Market opportunity by Type
        • Market opportunity by Type ($ million)
        • Data Table on Market opportunity by Type ($ million)

      8 Market Segmentation by Source

      • 8.1 Market segments
        • Chart on Source - Market share (2023-2028) (%)
        • Data Table on Source - Market share (2023-2028) (%)
      • 8.2 Comparison by Source
        • Chart on Comparison by Source
        • Data Table on Comparison by Source
      • 8.3 Bone Marrow - Market size and forecast (2023-2028)
        • Chart on Bone Marrow - Market size and forecast (2023-2028) ($ million)
        • Data Table on Bone Marrow - Market size and forecast (2023-2028) ($ million)
        • Chart on Bone Marrow - Year-over-year growth (2023-2028) (%)
        • Data Table on Bone Marrow - Year-over-year growth (2023-2028) (%)
      • 8.4 Adipose Tissue - Market size and forecast (2023-2028)
        • Chart on Adipose Tissue - Market size and forecast (2023-2028) ($ million)
        • Data Table on Adipose Tissue - Market size and forecast (2023-2028) ($ million)
        • Chart on Adipose Tissue - Year-over-year growth (2023-2028) (%)
        • Data Table on Adipose Tissue - Year-over-year growth (2023-2028) (%)
      • 8.5 Umbilical Cord Blood - Market size and forecast (2023-2028)
        • Chart on Umbilical Cord Blood - Market size and forecast (2023-2028) ($ million)
        • Data Table on Umbilical Cord Blood - Market size and forecast (2023-2028) ($ million)
        • Chart on Umbilical Cord Blood - Year-over-year growth (2023-2028) (%)
        • Data Table on Umbilical Cord Blood - Year-over-year growth (2023-2028) (%)
      • 8.6 Peripheral Blood - Market size and forecast (2023-2028)
        • Chart on Peripheral Blood - Market size and forecast (2023-2028) ($ million)
        • Data Table on Peripheral Blood - Market size and forecast (2023-2028) ($ million)
        • Chart on Peripheral Blood - Year-over-year growth (2023-2028) (%)
        • Data Table on Peripheral Blood - Year-over-year growth (2023-2028) (%)
      • 8.7 Embryonic Stem Cells - Market size and forecast (2023-2028)
        • Chart on Embryonic Stem Cells - Market size and forecast (2023-2028) ($ million)
        • Data Table on Embryonic Stem Cells - Market size and forecast (2023-2028) ($ million)
        • Chart on Embryonic Stem Cells - Year-over-year growth (2023-2028) (%)
        • Data Table on Embryonic Stem Cells - Year-over-year growth (2023-2028) (%)
      • 8.8 Induced Pluripotent Stem Cells - Market size and forecast (2023-2028)
        • Chart on Induced Pluripotent Stem Cells - Market size and forecast (2023-2028) ($ million)
        • Data Table on Induced Pluripotent Stem Cells - Market size and forecast (2023-2028) ($ million)
        • Chart on Induced Pluripotent Stem Cells - Year-over-year growth (2023-2028) (%)
        • Data Table on Induced Pluripotent Stem Cells - Year-over-year growth (2023-2028) (%)
      • 8.9 Market opportunity by Source
        • Market opportunity by Source ($ million)
        • Data Table on Market opportunity by Source ($ million)

      9 Market Segmentation by End-User

      • 9.1 Market segments
        • Chart on End-User - Market share (2023-2028) (%)
        • Data Table on End-User - Market share (2023-2028) (%)
      • 9.2 Comparison by End-User
        • Chart on Comparison by End-User
        • Data Table on Comparison by End-User
      • 9.3 Hospitals & Clinics - Market size and forecast (2023-2028)
        • Chart on Hospitals & Clinics - Market size and forecast (2023-2028) ($ million)
        • Data Table on Hospitals & Clinics - Market size and forecast (2023-2028) ($ million)
        • Chart on Hospitals & Clinics - Year-over-year growth (2023-2028) (%)
        • Data Table on Hospitals & Clinics - Year-over-year growth (2023-2028) (%)
      • 9.4 Academic & Research Institutions - Market size and forecast (2023-2028)
        • Chart on Academic & Research Institutions - Market size and forecast (2023-2028) ($ million)
        • Data Table on Academic & Research Institutions - Market size and forecast (2023-2028) ($ million)
        • Chart on Academic & Research Institutions - Year-over-year growth (2023-2028) (%)
        • Data Table on Academic & Research Institutions - Year-over-year growth (2023-2028) (%)
      • 9.5 Biotechnology & Pharmaceutical Companies - Market size and forecast (2023-2028)
        • Chart on Biotechnology & Pharmaceutical Companies - Market size and forecast (2023-2028) ($ million)
        • Data Table on Biotechnology & Pharmaceutical Companies - Market size and forecast (2023-2028) ($ million)
        • Chart on Biotechnology & Pharmaceutical Companies - Year-over-year growth (2023-2028) (%)
        • Data Table on Biotechnology & Pharmaceutical Companies - Year-over-year growth (2023-2028) (%)
      • 9.6 Market opportunity by End-User
        • Market opportunity by End-User ($ million)
        • Data Table on Market opportunity by End-User ($ million)

      10 Customer Landscape

      • 10.1 Customer landscape overview
        • Analysis of price sensitivity, lifecycle, customer purchase basket, adoption rates, and purchase criteria

      11 Geographic Landscape

      • 11.1 Geographic segmentation
        • Chart on Market share by geography 2023-2028 (%)
        • Data Table on Market share by geography 2023-2028 (%)
      • 11.2 Geographic comparison
        • Chart on Geographic comparison
        • Data Table on Geographic comparison
      • 11.3 North America - Market size and forecast 2023-2028
        • Chart on North America - Market size and forecast 2023-2028 ($ million)
        • Data Table on North America - Market size and forecast 2023-2028 ($ million)
        • Chart on North America - Year-over-year growth 2023-2028 (%)
        • Data Table on North America - Year-over-year growth 2023-2028 (%)
      • 11.4 Europe - Market size and forecast 2023-2028
        • Chart on Europe - Market size and forecast 2023-2028 ($ million)
        • Data Table on Europe - Market size and forecast 2023-2028 ($ million)
        • Chart on Europe - Year-over-year growth 2023-2028 (%)
        • Data Table on Europe - Year-over-year growth 2023-2028 (%)
      • 11.5 Asia - Market size and forecast 2023-2028
        • Chart on Asia - Market size and forecast 2023-2028 ($ million)
        • Data Table on Asia - Market size and forecast 2023-2028 ($ million)
        • Chart on Asia - Year-over-year growth 2023-2028 (%)
        • Data Table on Asia - Year-over-year growth 2023-2028 (%)
      • 11.6 Rest of World (ROW) - Market size and forecast 2023-2028
        • Chart on Rest of World (ROW) - Market size and forecast 2023-2028 ($ million)
        • Data Table on Rest of World (ROW) - Market size and forecast 2023-2028 ($ million)
        • Chart on Rest of World (ROW) - Year-over-year growth 2023-2028 (%)
        • Data Table on Rest of World (ROW) - Year-over-year growth 2023-2028 (%)
      • 11.7 US - Market size and forecast 2023-2028
        • Chart on US - Market size and forecast 2023-2028 ($ million)
        • Data Table on US - Market size and forecast 2023-2028 ($ million)
        • Chart on US - Year-over-year growth 2023-2028 (%)
        • Data Table on US - Year-over-year growth 2023-2028 (%)
      • 11.8 Germany - Market size and forecast 2023-2028
        • Chart on Germany - Market size and forecast 2023-2028 ($ million)
        • Data Table on Germany - Market size and forecast 2023-2028 ($ million)
        • Chart on Germany - Year-over-year growth 2023-2028 (%)
        • Data Table on Germany - Year-over-year growth 2023-2028 (%)
      • 11.9 UK - Market size and forecast 2023-2028
        • Chart on UK - Market size and forecast 2023-2028 ($ million)
        • Data Table on UK - Market size and forecast 2023-2028 ($ million)
        • Chart on UK - Year-over-year growth 2023-2028 (%)
        • Data Table on UK - Year-over-year growth 2023-2028 (%)
      • 11.10 China - Market size and forecast 2023-2028
        • Chart on China - Market size and forecast 2023-2028 ($ million)
        • Data Table on China - Market size and forecast 2023-2028 ($ million)
        • Chart on China - Year-over-year growth 2023-2028 (%)
        • Data Table on China - Year-over-year growth 2023-2028 (%)
      • 11.11 Japan - Market size and forecast 2023-2028
        • Chart on Japan - Market size and forecast 2023-2028 ($ million)
        • Data Table on Japan - Market size and forecast 2023-2028 ($ million)
        • Chart on Japan - Year-over-year growth 2023-2028 (%)
        • Data Table on Japan - Year-over-year growth 2023-2028 (%)
      • 11.12 Market opportunity by geography
        • Market opportunity by geography ($ million)
        • Data Tables on Market opportunity by geography ($ million)
      • 11.13 Canada - Market size and forecast (2023-2028)
        • Chart on Canada - Market size and forecast (2023-2028) ($ million)
        • Data Table on Canada - Market size and forecast (2023-2028) ($ million)
        • Chart on Canada - Year-over-year growth (2023-2028) (%)
        • Data Table on Canada - Year-over-year growth (2023-2028) (%)
      • 11.14 Italy - Market size and forecast (2023-2028)
        • Chart on Italy - Market size and forecast (2023-2028) ($ million)
        • Data Table on Italy - Market size and forecast (2023-2028) ($ million)
        • Chart on Italy - Year-over-year growth (2023-2028) (%)
        • Data Table on Italy - Year-over-year growth (2023-2028) (%)
      • 11.15 France - Market size and forecast (2023-2028)
        • Chart on France - Market size and forecast (2023-2028) ($ million)
        • Data Table on France - Market size and forecast (2023-2028) ($ million)
        • Chart on France - Year-over-year growth (2023-2028) (%)
        • Data Table on France - Year-over-year growth (2023-2028) (%)
      • 11.16 India - Market size and forecast (2023-2028)
        • Chart on India - Market size and forecast (2023-2028) ($ million)
        • Data Table on India - Market size and forecast (2023-2028) ($ million)
        • Chart on India - Year-over-year growth (2023-2028) (%)
        • Data Table on India - Year-over-year growth (2023-2028) (%)
      • 11.17 Brazil - Market size and forecast (2023-2028)
        • Chart on Brazil - Market size and forecast (2023-2028) ($ million)
        • Data Table on Brazil - Market size and forecast (2023-2028) ($ million)
        • Chart on Brazil - Year-over-year growth (2023-2028) (%)
        • Data Table on Brazil - Year-over-year growth (2023-2028) (%)
      • 11.18 Egypt - Market size and forecast (2023-2028)
        • Chart on Egypt - Market size and forecast (2023-2028) ($ million)
        • Data Table on Egypt - Market size and forecast (2023-2028) ($ million)
        • Chart on Egypt - Year-over-year growth (2023-2028) (%)
        • Data Table on Egypt - Year-over-year growth (2023-2028) (%)
      • 11.19 UAE - Market size and forecast (2023-2028)
        • Chart on UAE - Market size and forecast (2023-2028) ($ million)
        • Data Table on UAE - Market size and forecast (2023-2028) ($ million)
        • Chart on UAE - Year-over-year growth (2023-2028) (%)
        • Data Table on UAE - Year-over-year growth (2023-2028) (%)
      • 11.20 Oman - Market size and forecast (2023-2028)
        • Chart on Oman - Market size and forecast (2023-2028) ($ million)
        • Data Table on Oman - Market size and forecast (2023-2028) ($ million)
        • Chart on Oman - Year-over-year growth (2023-2028) (%)
        • Data Table on Oman - Year-over-year growth (2023-2028) (%)
      • 11.21 Argentina - Market size and forecast (2023-2028)
        • Chart on Argentina - Market size and forecast (2023-2028) ($ million)
        • Data Table on Argentina - Market size and forecast (2023-2028) ($ million)
        • Chart on Argentina - Year-over-year growth (2023-2028) (%)
        • Data Table on Argentina - Year-over-year growth (2023-2028) (%)
      • 11.22 KSA - Market size and forecast (2023-2028)
        • Chart on KSA - Market size and forecast (2023-2028) ($ million)
        • Data Table on KSA - Market size and forecast (2023-2028) ($ million)
        • Chart on KSA - Year-over-year growth (2023-2028) (%)
        • Data Table on KSA - Year-over-year growth (2023-2028) (%)

      12 Drivers, Challenges, and Opportunity/Restraints

      • 12.1 Market drivers
        • 12.2 Market challenges
          • 12.3 Impact of drivers and challenges
            • Impact of drivers and challenges in 2023 and 2028
          • 12.4 Market opportunities/restraints

            13 Competitive Landscape

            • 13.1 Overview
              • 13.2 Competitive Landscape
                • Overview on criticality of inputs and factors of differentiation
              • 13.3 Landscape disruption
                • Overview on factors of disruption
              • 13.4 Industry risks
                • Impact of key risks on business

              14 Competitive Analysis

              • 14.1 Companies profiled
                • Companies covered
              • 14.2 Market positioning of companies
                • Matrix on companies position and classification
              • 14.3 Athersys Inc.
                • Athersys Inc. - Overview
                • Athersys Inc. - Product / Service
                • Athersys Inc. - Key offerings
              • 14.4 Bristol Myers Squibb Co.
                • Bristol Myers Squibb Co. - Overview
                • Bristol Myers Squibb Co. - Product / Service
                • Bristol Myers Squibb Co. - Key news
                • Bristol Myers Squibb Co. - Key offerings
              • 14.5 CRISPR Therapeutics AG
                • CRISPR Therapeutics AG - Overview
                • CRISPR Therapeutics AG - Product / Service
                • CRISPR Therapeutics AG - Key offerings
              • 14.6 Cynata Therapeutics Ltd.
                • Cynata Therapeutics Ltd. - Overview
                • Cynata Therapeutics Ltd. - Product / Service
                • Cynata Therapeutics Ltd. - Key offerings
              • 14.7 FUJIFILM Corp.
                • FUJIFILM Corp. - Overview
                • FUJIFILM Corp. - Business segments
                • FUJIFILM Corp. - Key news
                • FUJIFILM Corp. - Key offerings
                • FUJIFILM Corp. - Segment focus
              • 14.8 Gamida Cell Ltd.
                • Gamida Cell Ltd. - Overview
                • Gamida Cell Ltd. - Product / Service
                • Gamida Cell Ltd. - Key offerings
              • 14.9 Johnson and Johnson Services Inc.
                • Johnson and Johnson Services Inc. - Overview
                • Johnson and Johnson Services Inc. - Business segments
                • Johnson and Johnson Services Inc. - Key news
                • Johnson and Johnson Services Inc. - Key offerings
                • Johnson and Johnson Services Inc. - Segment focus
              • 14.10 Lonza Group Ltd.
                • Lonza Group Ltd. - Overview
                • Lonza Group Ltd. - Business segments
                • Lonza Group Ltd. - Key news
                • Lonza Group Ltd. - Key offerings
                • Lonza Group Ltd. - Segment focus
              • 14.11 Mesoblast Ltd.
                • Mesoblast Ltd. - Overview
                • Mesoblast Ltd. - Product / Service
                • Mesoblast Ltd. - Key offerings
              • 14.12 Novartis AG
                • Novartis AG - Overview
                • Novartis AG - Business segments
                • Novartis AG - Key news
                • Novartis AG - Key offerings
                • Novartis AG - Segment focus
              • 14.13 Pfizer Inc.
                • Pfizer Inc. - Overview
                • Pfizer Inc. - Product / Service
                • Pfizer Inc. - Key news
                • Pfizer Inc. - Key offerings
              • 14.14 Pluri Inc.
                • Pluri Inc. - Overview
                • Pluri Inc. - Product / Service
                • Pluri Inc. - Key offerings
              • 14.15 ReNeuron Group plc
                • ReNeuron Group plc - Overview
                • ReNeuron Group plc - Product / Service
                • ReNeuron Group plc - Key offerings
              • 14.16 Takeda Pharmaceutical Co. Ltd.
                • Takeda Pharmaceutical Co. Ltd. - Overview
                • Takeda Pharmaceutical Co. Ltd. - Product / Service
                • Takeda Pharmaceutical Co. Ltd. - Key news
                • Takeda Pharmaceutical Co. Ltd. - Key offerings
              • 14.17 Vericel Corp.
                • Vericel Corp. - Overview
                • Vericel Corp. - Product / Service
                • Vericel Corp. - Key offerings

              15 Appendix

              • 15.1 Scope of the report
                • 15.2 Inclusions and exclusions checklist
                  • Inclusions checklist
                  • Exclusions checklist
                • 15.3 Currency conversion rates for US$
                  • Currency conversion rates for US$
                • 15.4 Research methodology
                  • Research methodology
                • 15.5 Data procurement
                  • Information sources
                • 15.6 Data validation
                  • Data validation
                • 15.7 Validation techniques employed for market sizing
                  • Validation techniques employed for market sizing
                • 15.8 Data synthesis
                  • Data synthesis
                • 15.9 360 degree market analysis
                  • 360 degree market analysis
                • 15.10 List of abbreviations
                  • List of abbreviations

                Research Methodology

                Technavio presents a detailed picture of the market by way of study, synthesis, and summation of data from multiple sources. The analysts have presented the various facets of the market with a particular focus on identifying the key industry influencers. The data thus presented is comprehensive, reliable, and the result of extensive research, both primary and secondary.

                INFORMATION SOURCES

                Primary sources

                • Manufacturers and suppliers
                • Channel partners
                • Industry experts
                • Strategic decision makers

                Secondary sources

                • Industry journals and periodicals
                • Government data
                • Financial reports of key industry players
                • Historical data
                • Press releases

                DATA ANALYSIS

                Data Synthesis

                • Collation of data
                • Estimation of key figures
                • Analysis of derived insights

                Data Validation

                • Triangulation with data models
                • Reference against proprietary databases
                • Corroboration with industry experts

                REPORT WRITING

                Qualitative

                • Market drivers
                • Market challenges
                • Market trends
                • Five forces analysis

                Quantitative

                • Market size and forecast
                • Market segmentation
                • Geographical insights
                • Competitive landscape

                Interested in this report?

                Get your sample now to see our research methodology and insights!

                Download Now

                Frequently Asked Questions

                Stem Cell Therapy market growth will increase by $ 16677.5 mn during 2024-2028 .

                The Stem Cell Therapy market is expected to grow at a CAGR of 18.69% during 2024-2028 .

                Stem Cell Therapy market is segmented by Application( Cancer, Musculoskeletal disorder, Cardiovascular disease, Others) Type( Allogeneic transplants, Autologous transplants, APAC, South America, MEA)

                Athersys Inc., Becton Dickinson and Co., Brainstorm Cell Therapeutics Inc., Bristol Myers Squibb Co., CRISPR Therapeutics AG, Cynata Therapeutics Ltd., Cytori Therapeutics Inc., FUJIFILM Corp., Gamida Cell Ltd., Johnson and Johnson Services Inc., Lonza Group Ltd., Mesoblast Ltd., Novartis AG, Pfizer Inc., Pluri Inc., ReNeuron Group plc, STEMCELL Technologies Inc., Takeda Pharmaceutical Co. Ltd., Thermo Fisher Scientific Inc., Vericel Corp. are a few of the key vendors in the Stem Cell Therapy market.

                North America will register the highest growth rate of 40% among the other regions. Therefore, the Stem Cell Therapy market in North America is expected to garner significant business opportunities for the vendors during the forecast period.

                US, Canada, Germany, UK, Italy, France, China, India, Japan, Brazil, Egypt, UAE, Oman, Argentina, KSA, UAE, Brazil, Rest of World (ROW)

                • Increasing prevalence of chronic diseasesThere is an increasing global prevalence of various chronic diseases is the driving factor this market.
                • such as heart diseases is the driving factor this market.
                • diabetes is the driving factor this market.
                • stroke is the driving factor this market.
                • cancer is the driving factor this market.
                • obesity is the driving factor this market.
                • and arthritis. Chronic diseases present a significant burden on patients and healthcare systems. A significant population all over the world has one or more chronic health conditions is the driving factor this market.
                • and one in four adults suffers from two or more chronic diseases. Unhealthy lifestyle habits such as a lack of exercise is the driving factor this market.
                • poor nutrition intake is the driving factor this market.
                • and substance abuse is the driving factor this market.
                • including addiction to alcohol and tobacco are the major risk factors leading to chronic diseases. The incidence of many musculoskeletal disorders and bone injuries such as arthritis (osteoarthritis and rheumatoid arthritis) is the driving factor this market.
                • osteoporosis is the driving factor this market.
                • and serious limb trauma injuries requiring hospitalization is increasing. For instance is the driving factor this market.
                • in the US is the driving factor this market.
                • a large number of adults have arthritis and osteoarthritis. A significant number of people in the US and other developed countries die of heart disease every year. The prevalence of CVDs is the driving factor this market.
                • such as angina is the driving factor this market.
                • MI is the driving factor this market.
                • stroke is the driving factor this market.
                • heart failure is the driving factor this market.
                • venous thromboembolism is the driving factor this market.
                • and heart arrhythmia is the driving factor this market.
                • is also increasing. CVDs account for a major share of total deaths occurring in the EU each year. Most chronic diseases may result in tissue or organ damage. The vast majority of treatments available for chronic diseases are palliative. In contrast is the driving factor this market.
                • other treatment options can delay disease progression and the onset of complications associated with the underlying illness. Regenerative medicine opens the possibility of overcoming previously untreatable diseases using new treatment methods is the driving factor this market.
                • such as processed cells for reconstructing tissues. It has the unique capability of altering the fundamental mechanisms of diseases. It also helps in reducing healthcare costs by eliminating the need for long-term hospitalization or drug regimes. This is leading to the increased adoption of cell therapies for the treatment of chronic diseases is the driving factor this market.
                • which is the driving factor this market.
                • in turn is the driving factor this market.
                • will drive the growth of the global stem cell therapy market during the forecast period. is the driving factor this market.

                The Stem Cell Therapy market vendors should focus on grabbing business opportunities from the Cancer segment as it accounted for the largest market share in the base year.