India Captive Power Generation Market Analysis, Size, and Forecast 2025-2029

India Captive Power Generation Market Analysis, Size, and Forecast 2025-2029

Published: Mar 2025 207 Pages SKU: IRTNTR72538

Market Overview at a Glance

$8.76 B
Market Opportunity
7.9%
CAGR
7.2
YoY growth 2024-2025(%)

India Captive Power Generation Market Size 2025-2029 

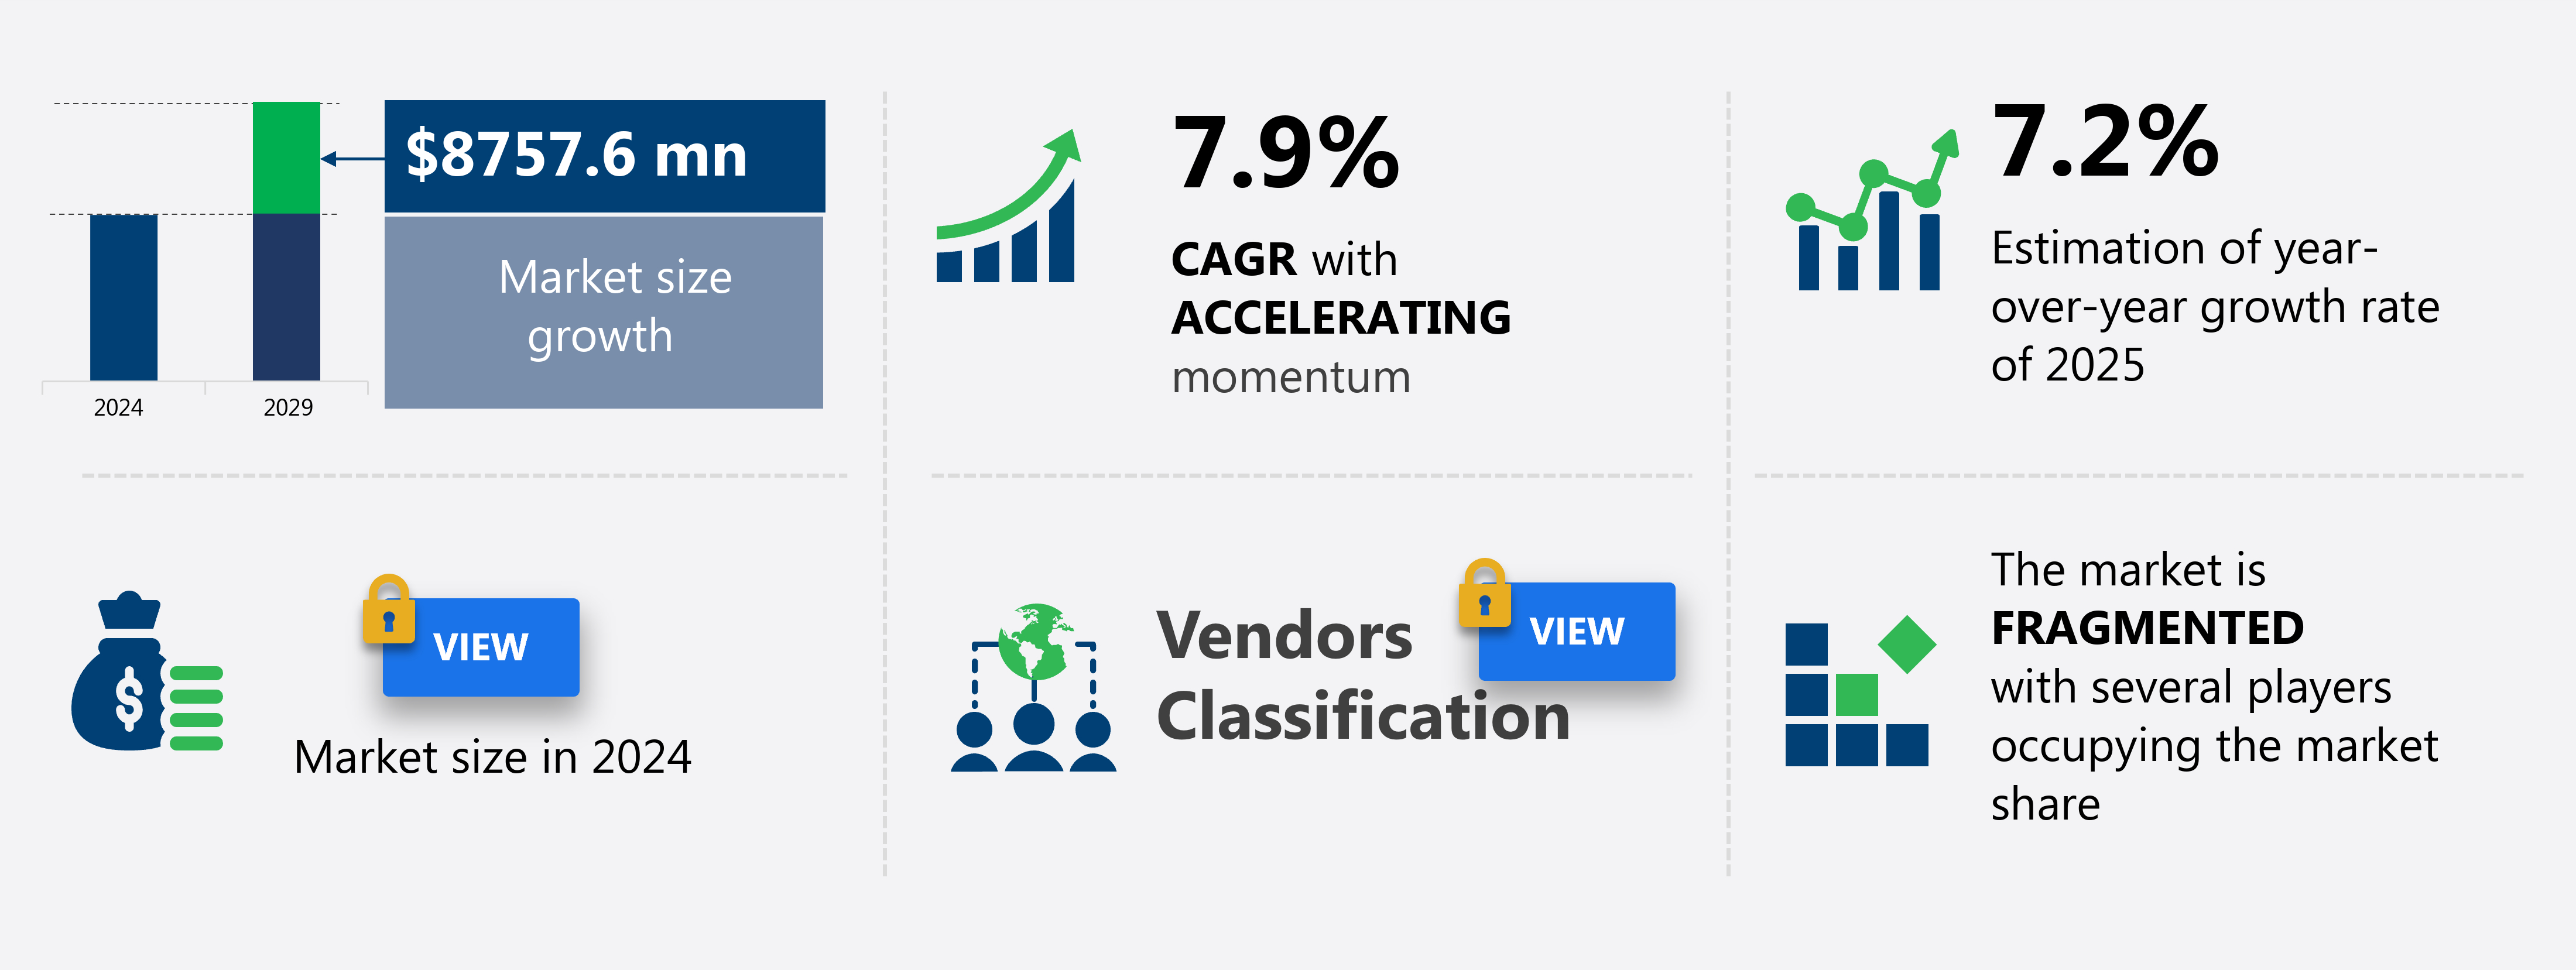
The india captive power generation market size is forecast to increase by USD 8.76 billion at a CAGR of 7.9% between 2024 and 2029.

  • The market presents significant opportunities for investors and businesses seeking to mitigate rising power costs and ensure energy security. Key drivers include high industrial power tariffs, which have increased by an average of 8-10% annually over the past decade, making captive power generation an attractive alternative for energy-intensive industries. Additionally, the increasing adoption of cogeneration plants, which produce both power and heat, is gaining traction due to their efficiency and cost savings. However, challenges persist, with the shortage of coal being a major concern for captive power generators, as coal remains the primary fuel source for most plants in India.
  • Navigating this complex market landscape requires a deep of regulatory policies, fuel availability, and technological advancements. Companies seeking to capitalize on market opportunities and navigate challenges effectively should consider strategic partnerships, diversification of fuel sources, and investments in renewable energy solutions.

What will be the size of the India Captive Power Generation Market during the forecast period?


Captive Power Generation Market in India Size

 Request Free Sample


  • The market is experiencing significant growth, driven by the country's emphasis on energy independence and the integration of renewable energy sources. Microgrid development, fueled by advances in power electronics and automation technologies, is a key trend in the market. Artificial intelligence (AI) and machine learning (ML) are increasingly being adopted for peak shaving, power system stability, and performance optimization. The circular economy is also influencing the market, with a focus on lifecycle cost analysis and energy conservation. Decentralized power, including hybrid power systems and distributed generation solutions, are gaining popularity due to grid modernization efforts. Big data analytics and cloud computing are enabling more efficient energy management and demand response.
  • Renewable energy development and integration are major factors, with energy audit services and contractual energy services playing crucial roles. Harmonics mitigation, load shedding, and asset management are other areas of focus. The market encompasses various power generation technologies, including gas-based power plants, coal-based power plants, and renewable energy sources. Digital twins and energy consulting are also essential components of the evolving landscape. Overall, the Indian captive power generation market is dynamic and forward-thinking, with a strong emphasis on innovation and sustainability.

How is this market segmented?

The market research report provides comprehensive data (region-wise segment analysis), with forecasts and estimates in "USD million" for the period 2025-2029, as well as historical data from 2019-2023 for the following segments.
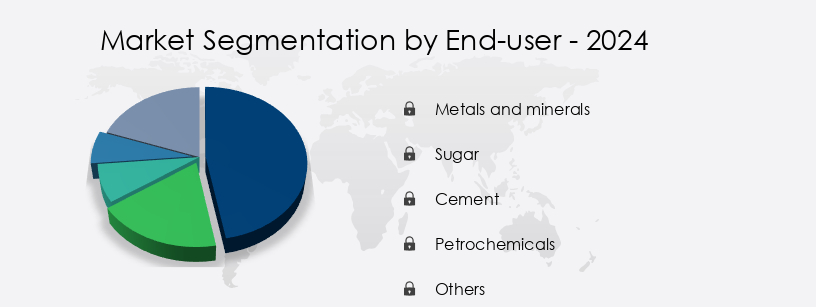
  • End-user
    • Metals and minerals
    • Sugar
    • Cement
    • Petrochemicals
    • Others
  • Fuel Type
    • Coal
    • Diesel
    • Gas
    • Renewables
  • Ownership
    • Multiple
    • Single
  • Technology
    • Reciprocating engine
    • Diesel generators
    • Combined heat and power (CHP)
    • Gas turbine
    • Steam turbine
  • Connectivity
    • On-Grid
    • Off-Grid
  • Geography
    • India

By End-user Insights

The metals and minerals segment is estimated to witness significant growth during the forecast period.

The metals and minerals industry is a significant consumer of energy due to the energy-intensive processes involved, such as mining, chemical extraction, beneficiation, and recycling. Processes like smelting, leaching, and electrowinning require substantial power for their operation, leading to high energy consumption and grid instability due to load variation. Consequently, the metals and minerals end-user segment relies heavily on captive power generation. Energy efficiency, fuel optimization, and emissions reduction are critical concerns for this sector. Renewable energy sources, including solar, wind, and biomass power, are increasingly being adopted for captive power generation due to their environmental benefits and cost savings.

Energy management software, IoT integration, and smart grid technologies are essential tools for optimizing power quality and ensuring grid integration. Industrial power generation solutions, such as steam turbines, gas turbines, diesel generators, and reciprocating engines, are commonly used for captive power generation in the metals and minerals industry. Government incentives, EPC services, and power management systems are also vital in facilitating the adoption of captive power generation. Energy storage solutions, such as battery energy storage, are increasingly being integrated into captive power generation systems to ensure power availability and reliability. Data centers and commercial buildings are also significant consumers of energy and are adopting captive power generation for energy efficiency and cost savings.

Process optimization and net metering are essential strategies for managing energy usage and costs in captive power generation systems.


Captive Power Generation Market in India Share by End-user

Get a glance at the market report of share of various segments Request Free Sample


The Metals and minerals segment was valued at  USD 5683.20 million in 2019 and showed a gradual increase during the forecast period.

Market Dynamics

Our researchers analyzed the data with 2024 as the base year, along with the key drivers, trends, and challenges. A holistic analysis of drivers will help companies refine their marketing strategies to gain a competitive advantage.

What are the key market drivers leading to the rise in adoption of India Captive Power Generation Market?

  • High industrial power tariffs is the key driver of the market. 

  • Electricity is an essential input for various industries, particularly in manufacturing, where it significantly impacts the process value chain and final products. High electricity tariffs can negatively affect industries that rely heavily on electricity, increasing competition with international manufacturers and ultimately passing on price increments to consumers. This results in higher prices for manufactured commodities. For energy-intensive applications, such as metal smelting or steel manufacturing, high industrial power tariffs lead to increased operational expenditure due to high costs of operation.
  • As per , the high electricity costs pose a significant challenge for businesses in India, with the manufacturing sector being the most affected. This trend is expected to continue, necessitating the need for cost-effective power generation solutions.

What are the market trends shaping the India Captive Power Generation Market?

  • Increasing adoption of cogeneration plants is the upcoming trend in the market. 

  • Cogeneration plants, also referred to as combined heat and power (CHP) or distributed generation, are facilities that generate two or more forms of energy from a single fuel source. These plants offer higher efficiency rates compared to traditional single-generation plants. The primary advantage of cogeneration plants lies in their ability to produce additional energy using the waste heat from various components, such as manufacturing plant exhausts, to generate electricity and heat for power plants. This recycling of waste heat leads to increased energy production and reduced fuel consumption, resulting in improved efficiency and decreased operational expenses.
  • Heat is a crucial element in several industries, including fertilizer and textile manufacturing, making efficient heat utilization essential. Cogeneration plants effectively address this requirement by generating electricity and heat concurrently, thereby optimizing energy usage and minimizing fuel consumption. This approach not only enhances overall efficiency but also reduces operational costs for businesses.

What challenges does India Captive Power Generation Market face during the growth?

  • Shortage of coal for captive power generation is a key challenge affecting the market growth. 

  • The market primarily depends on coal as the primary fuel source, accounting for a significant portion of fuel usage in this sector. However, coal scarcity has become a pressing issue for captive power plant owners due to government priorities to supply coal to utility power plants. This coal shortage negatively affects captive power plant operations and poses a threat to the production of various end-products such as steel, cement, aluminum, and fertilizers.
  • Consequently, captive power plants are operating below their full capacity, impacting the overall output of manufacturing facilities. This situation highlights the need for alternative fuel sources and efficient coal management strategies to mitigate the impact of coal scarcity on captive power generation in India.

Exclusive India Captive Power Generation Market Customer Landscape

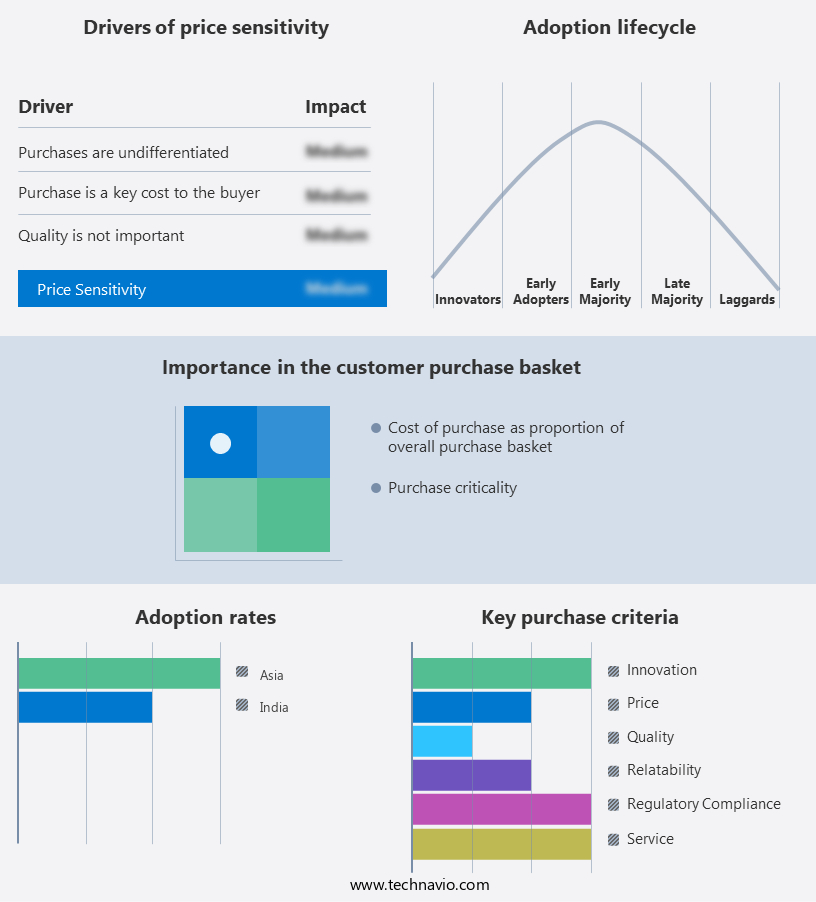
The market forecasting report includes the adoption lifecycle of the market, covering from the innovator’s stage to the laggard’s stage. It focuses on adoption rates in different regions based on penetration. Furthermore, the report also includes key purchase criteria and drivers of price sensitivity to help companies evaluate and develop their market growth analysis strategies.


Captive Power Generation Market in India Share by Geography

 Customer Landscape

Key Companies & Market Insights

Companies are implementing various strategies, such as strategic alliances, market forecast partnerships, mergers and acquisitions, geographical expansion, and product/service launches, to enhance their presence in the market.

The market research and growth report includes detailed analyses of the competitive landscape of the market and information about key companies, including:

  • Ambuja Cements Ltd.
  • Bharat Heavy Electricals Ltd.
  • Dalmia Bharat Group
  • DCM Shriram Ltd.
  • Ducon Infratechnologies Ltd.
  • Essar
  • General Electric Co.
  • Hindalco Industries Ltd.
  • Infosys Ltd.
  • Jakson Group
  • Jindal Steel and Power Ltd.
  • Larsen and Toubro Ltd.
  • Lloyds Metals and Energy Ltd.
  • National Aluminium Co. Ltd.
  • Reliance Industries Ltd.
  • Tata Power Co. Ltd.
  • Thermax Ltd.
  • UltraTech Cement Ltd.
  • Vedanta Ltd.
  • Visa Steel Ltd.

Qualitative and quantitative analysis of companies has been conducted to help clients understand the wider business environment as well as the strengths and weaknesses of key market players. Data is qualitatively analyzed to categorize companies as pure play, category-focused, industry-focused, and diversified; it is quantitatively analyzed to categorize companies as dominant, leading, strong, tentative, and weak.

Research Analyst Overview

The market has experienced significant growth in recent years, driven by various factors including the increasing demand for energy efficiency, emissions reduction, and the integration of renewable energy sources. Project development in the industrial sector has been a key focus area, with energy management software and IoT integration playing crucial roles in optimizing power quality and energy efficiency. Industrial power generation continues to be a significant contributor to carbon footprints, making the adoption of green energy solutions increasingly important. Biomass power, solar power, and wind power have emerged as popular alternatives to traditional fossil fuel-based power generation.

Reciprocating engines and steam turbines have been widely used in captive power plants to generate electricity on-site, while gas turbines and diesel generators provide backup power and grid support. Fuel optimization has become a critical aspect of power generation, with companies focusing on reducing emissions and improving efficiency. Process optimization and grid integration have also gained importance, with smart grid technologies enabling better energy management and demand response. Metals and mining companies, data centers, and commercial buildings are among the major consumers of captive power, and net metering and energy services have emerged as key solutions for managing their energy needs.

The Indian government has introduced various incentives to promote the adoption of renewable energy and distributed generation. EPC services have gained popularity in the implementation of captive power projects, while power management systems have become essential for optimizing energy usage and ensuring power quality. Energy audits have become a crucial tool for identifying energy savings opportunities and reducing operational costs. Battery energy storage has emerged as a key enabler for renewable energy integration and grid stability. Industrial automation and IoT integration have also played a significant role in optimizing power generation and distribution. The evolving market dynamics have led to increased competition and innovation, with companies focusing on developing advanced technologies and solutions to meet the growing demand for reliable and efficient power generation.

Market Scope

Report Coverage

Details

Page number

207

Base year

2024

Historic period

2019-2023

Forecast period

2025-2029

Growth momentum & CAGR

Accelerate at a CAGR of 7.9%

Market growth 2025-2029

USD 8757.6 million

Market structure

Fragmented

YoY growth 2024-2025(%)

7.2

Competitive landscape

Leading Companies, Market Positioning of Companies, Competitive Strategies, and Industry Risks

Request Free Sample

What are the Key Data Covered in this Market Research Report?

  • CAGR of the market during the forecast period
  • Detailed information on factors that will drive the market growth and forecasting between 2025 and 2029
  • Precise estimation of the size of the market  and its contribution of the market in focus to the parent market
  • Accurate predictions about upcoming market growth and trends and changes in consumer behaviour
  • Growth of the market across India
  • Thorough analysis of the market’s competitive landscape and detailed information about companies
  • Comprehensive analysis of factors that will challenge the growth of market companies

We can help! Our analysts can customize this market research report to meet your requirements Get in touch


1 Executive Summary

  • 1.1 Market overview
    • Executive Summary - Chart on Market Overview
    • Executive Summary - Data Table on Market Overview
    • Executive Summary - Chart on Country Market Characteristics
    • Executive Summary - Chart on Market Segmentation by End-user
    • Executive Summary - Chart on Market Segmentation by Fuel Type
    • Executive Summary - Chart on Market Segmentation by Ownership
    • Executive Summary - Chart on Market Segmentation by Technology
    • Executive Summary - Chart on Company Market Positioning

2 Technavio Analysis

  • 2.1 Analysis of price sensitivity, lifecycle, customer purchase basket, adoption rates, and purchase criteria
    • Analysis of price sensitivity, lifecycle, customer purchase basket, adoption rates, and purchase criteria
  • 2.2 Criticality of inputs and Factors of differentiation
    • Overview on criticality of inputs and factors of differentiation
  • 2.3 Factors of disruption
    • Overview on factors of disruption
  • 2.4 Impact of drivers and challenges
    • Impact of drivers and challenges in 2024 and 2029

3 Market Landscape

  • 3.1 Market ecosystem
    • Parent Market
    • Data Table on - Parent Market
  • 3.2 Market characteristics
    • Market characteristics analysis
  • 3.3 Value chain analysis
    • Value chain analysis

4 Market Sizing

  • 4.1 Market definition
    • Offerings of companies included in the market definition
  • 4.2 Market segment analysis
    • Market segments
  • 4.3 Market size 2024
    • 4.4 Market outlook: Forecast for 2024-2029
      • Chart on India - Market size and forecast 2024-2029 ($ million)
      • Data Table on India - Market size and forecast 2024-2029 ($ million)
      • Chart on India: Year-over-year growth 2024-2029 (%)
      • Data Table on India: Year-over-year growth 2024-2029 (%)

    5 Historic Market Size

    • 5.1 Captive Power Generation Market in India 2019 - 2023
      • Historic Market Size - Data Table on Captive Power Generation Market in India 2019 - 2023 ($ million)
    • 5.2 End-user segment analysis 2019 - 2023
      • Historic Market Size - End-user Segment 2019 - 2023 ($ million)
    • 5.3 Fuel Type segment analysis 2019 - 2023
      • Historic Market Size - Fuel Type Segment 2019 - 2023 ($ million)
    • 5.4 Ownership segment analysis 2019 - 2023
      • Historic Market Size - Ownership Segment 2019 - 2023 ($ million)
    • 5.5 Technology segment analysis 2019 - 2023
      • Historic Market Size - Technology Segment 2019 - 2023 ($ million)

    6 Qualitative Analysis

    • 6.1 Impact of AI on Captive Power Generation Market in India

      7 Five Forces Analysis

      • 7.1 Five forces summary
        • Five forces analysis - Comparison between 2024 and 2029
      • 7.2 Bargaining power of buyers
        • Bargaining power of buyers - Impact of key factors 2024 and 2029
      • 7.3 Bargaining power of suppliers
        • Bargaining power of suppliers - Impact of key factors in 2024 and 2029
      • 7.4 Threat of new entrants
        • Threat of new entrants - Impact of key factors in 2024 and 2029
      • 7.5 Threat of substitutes
        • Threat of substitutes - Impact of key factors in 2024 and 2029
      • 7.6 Threat of rivalry
        • Threat of rivalry - Impact of key factors in 2024 and 2029
      • 7.7 Market condition
        • Chart on Market condition - Five forces 2024 and 2029

      8 Market Segmentation by End-user

      • 8.1 Market segments
        • Chart on End-user - Market share (2024-2029) (%)
        • Data Table on End-user - Market share (2024-2029) (%)
      • 8.2 Comparison by End-user
        • Chart on Comparison by End-user
        • Data Table on Comparison by End-user
      • 8.3 Metals and minerals - Market size and forecast (2024-2029)
        • Chart on Metals and minerals - Market size and forecast (2024-2029) ($ million)
        • Data Table on Metals and minerals - Market size and forecast (2024-2029) ($ million)
        • Chart on Metals and minerals - Year-over-year growth (2024-2029) (%)
        • Data Table on Metals and minerals - Year-over-year growth (2024-2029) (%)
      • 8.4 Sugar - Market size and forecast (2024-2029)
        • Chart on Sugar - Market size and forecast (2024-2029) ($ million)
        • Data Table on Sugar - Market size and forecast (2024-2029) ($ million)
        • Chart on Sugar - Year-over-year growth (2024-2029) (%)
        • Data Table on Sugar - Year-over-year growth (2024-2029) (%)
      • 8.5 Cement - Market size and forecast (2024-2029)
        • Chart on Cement - Market size and forecast (2024-2029) ($ million)
        • Data Table on Cement - Market size and forecast (2024-2029) ($ million)
        • Chart on Cement - Year-over-year growth (2024-2029) (%)
        • Data Table on Cement - Year-over-year growth (2024-2029) (%)
      • 8.6 Petrochemicals - Market size and forecast (2024-2029)
        • Chart on Petrochemicals - Market size and forecast (2024-2029) ($ million)
        • Data Table on Petrochemicals - Market size and forecast (2024-2029) ($ million)
        • Chart on Petrochemicals - Year-over-year growth (2024-2029) (%)
        • Data Table on Petrochemicals - Year-over-year growth (2024-2029) (%)
      • 8.7 Others - Market size and forecast (2024-2029)
        • Chart on Others - Market size and forecast (2024-2029) ($ million)
        • Data Table on Others - Market size and forecast (2024-2029) ($ million)
        • Chart on Others - Year-over-year growth (2024-2029) (%)
        • Data Table on Others - Year-over-year growth (2024-2029) (%)
      • 8.8 Market opportunity by End-user
        • Market opportunity by End-user ($ million)
        • Data Table on Market opportunity by End-user ($ million)

      9 Market Segmentation by Fuel Type

      • 9.1 Market segments
        • Chart on Fuel Type - Market share (2024-2029) (%)
        • Data Table on Fuel Type - Market share (2024-2029) (%)
      • 9.2 Comparison by Fuel Type
        • Chart on Comparison by Fuel Type
        • Data Table on Comparison by Fuel Type
      • 9.3 Coal - Market size and forecast (2024-2029)
        • Chart on Coal - Market size and forecast (2024-2029) ($ million)
        • Data Table on Coal - Market size and forecast (2024-2029) ($ million)
        • Chart on Coal - Year-over-year growth (2024-2029) (%)
        • Data Table on Coal - Year-over-year growth (2024-2029) (%)
      • 9.4 Diesel - Market size and forecast (2024-2029)
        • Chart on Diesel - Market size and forecast (2024-2029) ($ million)
        • Data Table on Diesel - Market size and forecast (2024-2029) ($ million)
        • Chart on Diesel - Year-over-year growth (2024-2029) (%)
        • Data Table on Diesel - Year-over-year growth (2024-2029) (%)
      • 9.5 Gas - Market size and forecast (2024-2029)
        • Chart on Gas - Market size and forecast (2024-2029) ($ million)
        • Data Table on Gas - Market size and forecast (2024-2029) ($ million)
        • Chart on Gas - Year-over-year growth (2024-2029) (%)
        • Data Table on Gas - Year-over-year growth (2024-2029) (%)
      • 9.6 Renewables - Market size and forecast (2024-2029)
        • Chart on Renewables - Market size and forecast (2024-2029) ($ million)
        • Data Table on Renewables - Market size and forecast (2024-2029) ($ million)
        • Chart on Renewables - Year-over-year growth (2024-2029) (%)
        • Data Table on Renewables - Year-over-year growth (2024-2029) (%)
      • 9.7 Market opportunity by Fuel Type
        • Market opportunity by Fuel Type ($ million)
        • Data Table on Market opportunity by Fuel Type ($ million)

      10 Market Segmentation by Ownership

      • 10.1 Market segments
        • Chart on Ownership - Market share (2024-2029) (%)
        • Data Table on Ownership - Market share (2024-2029) (%)
      • 10.2 Comparison by Ownership
        • Chart on Comparison by Ownership
        • Data Table on Comparison by Ownership
      • 10.3 Multiple - Market size and forecast (2024-2029)
        • Chart on Multiple - Market size and forecast (2024-2029) ($ million)
        • Data Table on Multiple - Market size and forecast (2024-2029) ($ million)
        • Chart on Multiple - Year-over-year growth (2024-2029) (%)
        • Data Table on Multiple - Year-over-year growth (2024-2029) (%)
      • 10.4 Single - Market size and forecast (2024-2029)
        • Chart on Single - Market size and forecast (2024-2029) ($ million)
        • Data Table on Single - Market size and forecast (2024-2029) ($ million)
        • Chart on Single - Year-over-year growth (2024-2029) (%)
        • Data Table on Single - Year-over-year growth (2024-2029) (%)
      • 10.5 Market opportunity by Ownership
        • Market opportunity by Ownership ($ million)
        • Data Table on Market opportunity by Ownership ($ million)

      11 Market Segmentation by Technology

      • 11.1 Market segments
        • Chart on Technology - Market share (2024-2029) (%)
        • Data Table on Technology - Market share (2024-2029) (%)
      • 11.2 Comparison by Technology
        • Chart on Comparison by Technology
        • Data Table on Comparison by Technology
      • 11.3 Reciprocating engine - Market size and forecast (2024-2029)
        • Chart on Reciprocating engine - Market size and forecast (2024-2029) ($ million)
        • Data Table on Reciprocating engine - Market size and forecast (2024-2029) ($ million)
        • Chart on Reciprocating engine - Year-over-year growth (2024-2029) (%)
        • Data Table on Reciprocating engine - Year-over-year growth (2024-2029) (%)
      • 11.4 Diesel generators - Market size and forecast (2024-2029)
        • Chart on Diesel generators - Market size and forecast (2024-2029) ($ million)
        • Data Table on Diesel generators - Market size and forecast (2024-2029) ($ million)
        • Chart on Diesel generators - Year-over-year growth (2024-2029) (%)
        • Data Table on Diesel generators - Year-over-year growth (2024-2029) (%)
      • 11.5 Combined heat and power (CHP) - Market size and forecast (2024-2029)
        • Chart on Combined heat and power (CHP) - Market size and forecast (2024-2029) ($ million)
        • Data Table on Combined heat and power (CHP) - Market size and forecast (2024-2029) ($ million)
        • Chart on Combined heat and power (CHP) - Year-over-year growth (2024-2029) (%)
        • Data Table on Combined heat and power (CHP) - Year-over-year growth (2024-2029) (%)
      • 11.6 Gas turbine - Market size and forecast (2024-2029)
        • Chart on Gas turbine - Market size and forecast (2024-2029) ($ million)
        • Data Table on Gas turbine - Market size and forecast (2024-2029) ($ million)
        • Chart on Gas turbine - Year-over-year growth (2024-2029) (%)
        • Data Table on Gas turbine - Year-over-year growth (2024-2029) (%)
      • 11.7 Steam turbine - Market size and forecast (2024-2029)
        • Chart on Steam turbine - Market size and forecast (2024-2029) ($ million)
        • Data Table on Steam turbine - Market size and forecast (2024-2029) ($ million)
        • Chart on Steam turbine - Year-over-year growth (2024-2029) (%)
        • Data Table on Steam turbine - Year-over-year growth (2024-2029) (%)
      • 11.8 Market opportunity by Technology
        • Market opportunity by Technology ($ million)
        • Data Table on Market opportunity by Technology ($ million)

      12 Market Segmentation by Connectivity

      • 12.1 Market segments
        • Chart on Connectivity - Market share (2024-2029) (%)
        • Data Table on Connectivity - Market share (2024-2029) (%)
      • 12.2 Comparison by Connectivity
        • Chart on Comparison by Connectivity
        • Data Table on Comparison by Connectivity
      • 12.3 On-Grid - Market size and forecast (2024-2029)
        • Chart on On-Grid - Market size and forecast (2024-2029) ($ million)
        • Data Table on On-Grid - Market size and forecast (2024-2029) ($ million)
        • Chart on On-Grid - Year-over-year growth (2024-2029) (%)
        • Data Table on On-Grid - Year-over-year growth (2024-2029) (%)
      • 12.4 Off-Grid - Market size and forecast (2024-2029)
        • Chart on Off-Grid - Market size and forecast (2024-2029) ($ million)
        • Data Table on Off-Grid - Market size and forecast (2024-2029) ($ million)
        • Chart on Off-Grid - Year-over-year growth (2024-2029) (%)
        • Data Table on Off-Grid - Year-over-year growth (2024-2029) (%)
      • 12.5 Market opportunity by Connectivity
        • Market opportunity by Connectivity ($ million)
        • Data Table on Market opportunity by Connectivity ($ million)

      13 Customer Landscape

      • 13.1 Customer landscape overview
        • Analysis of price sensitivity, lifecycle, customer purchase basket, adoption rates, and purchase criteria

      14 Drivers, Challenges, and Opportunity/Restraints

      • 14.1 Market drivers
        • 14.2 Market challenges
          • 14.3 Impact of drivers and challenges
            • Impact of drivers and challenges in 2024 and 2029
          • 14.4 Market opportunities/restraints

            15 Competitive Landscape

            • 15.1 Overview
              • 15.2 Competitive Landscape
                • Overview on criticality of inputs and factors of differentiation
              • 15.3 Landscape disruption
                • Overview on factors of disruption
              • 15.4 Industry risks
                • Impact of key risks on business

              16 Competitive Analysis

              • 16.1 Companies profiled
                • Companies covered
              • 16.2 Company ranking index
                • Company ranking index
              • 16.3 Market positioning of companies
                • Matrix on companies position and classification
              • 16.4 Ambuja Cements Ltd.
                • Ambuja Cements Ltd. - Overview
                • Ambuja Cements Ltd. - Product / Service
                • Ambuja Cements Ltd. - Key offerings
                • SWOT
              • 16.5 Bharat Heavy Electricals Ltd.
                • Bharat Heavy Electricals Ltd. - Overview
                • Bharat Heavy Electricals Ltd. - Business segments
                • Bharat Heavy Electricals Ltd. - Key news
                • Bharat Heavy Electricals Ltd. - Key offerings
                • Bharat Heavy Electricals Ltd. - Segment focus
                • SWOT
              • 16.6 Dalmia Bharat Group
                • Dalmia Bharat Group - Overview
                • Dalmia Bharat Group - Product / Service
                • Dalmia Bharat Group - Key offerings
                • SWOT
              • 16.7 DCM Shriram Ltd.
                • DCM Shriram Ltd. - Overview
                • DCM Shriram Ltd. - Product / Service
                • DCM Shriram Ltd. - Key offerings
                • SWOT
              • 16.8 Ducon Infratechnologies Ltd.
                • Ducon Infratechnologies Ltd. - Overview
                • Ducon Infratechnologies Ltd. - Product / Service
                • Ducon Infratechnologies Ltd. - Key offerings
                • SWOT
              • 16.9 Essar
                • Essar - Overview
                • Essar - Product / Service
                • Essar - Key offerings
                • SWOT
              • 16.10 General Electric Co.
                • General Electric Co. - Overview
                • General Electric Co. - Business segments
                • General Electric Co. - Key news
                • General Electric Co. - Key offerings
                • General Electric Co. - Segment focus
                • SWOT
              • 16.11 Hindalco Industries Ltd.
                • Hindalco Industries Ltd. - Overview
                • Hindalco Industries Ltd. - Business segments
                • Hindalco Industries Ltd. - Key offerings
                • Hindalco Industries Ltd. - Segment focus
                • SWOT
              • 16.12 Infosys Ltd.
                • Infosys Ltd. - Overview
                • Infosys Ltd. - Business segments
                • Infosys Ltd. - Key news
                • Infosys Ltd. - Key offerings
                • Infosys Ltd. - Segment focus
                • SWOT
              • 16.13 Jakson Group
                • Jakson Group - Overview
                • Jakson Group - Product / Service
                • Jakson Group - Key offerings
                • SWOT
              • 16.14 Jindal Steel and Power Ltd.
                • Jindal Steel and Power Ltd. - Overview
                • Jindal Steel and Power Ltd. - Business segments
                • Jindal Steel and Power Ltd. - Key offerings
                • Jindal Steel and Power Ltd. - Segment focus
                • SWOT
              • 16.15 Larsen and Toubro Ltd.
                • Larsen and Toubro Ltd. - Overview
                • Larsen and Toubro Ltd. - Business segments
                • Larsen and Toubro Ltd. - Key news
                • Larsen and Toubro Ltd. - Key offerings
                • Larsen and Toubro Ltd. - Segment focus
                • SWOT
              • 16.16 Lloyds Metals and Energy Ltd.
                • Lloyds Metals and Energy Ltd. - Overview
                • Lloyds Metals and Energy Ltd. - Product / Service
                • Lloyds Metals and Energy Ltd. - Key offerings
                • SWOT
              • 16.17 National Aluminium Co. Ltd.
                • National Aluminium Co. Ltd. - Overview
                • National Aluminium Co. Ltd. - Business segments
                • National Aluminium Co. Ltd. - Key offerings
                • National Aluminium Co. Ltd. - Segment focus
                • SWOT
              • 16.18 Reliance Industries Ltd.
                • Reliance Industries Ltd. - Overview
                • Reliance Industries Ltd. - Business segments
                • Reliance Industries Ltd. - Key news
                • Reliance Industries Ltd. - Key offerings
                • Reliance Industries Ltd. - Segment focus
                • SWOT

              17 Appendix

              • 17.1 Scope of the report
                • 17.2 Inclusions and exclusions checklist
                  • Inclusions checklist
                  • Exclusions checklist
                • 17.3 Currency conversion rates for US$
                  • Currency conversion rates for US$
                • 17.4 Research methodology
                  • Research methodology
                • 17.5 Data procurement
                  • Information sources
                • 17.6 Data validation
                  • Data validation
                • 17.7 Validation techniques employed for market sizing
                  • Validation techniques employed for market sizing
                • 17.8 Data synthesis
                  • Data synthesis
                • 17.9 360 degree market analysis
                  • 360 degree market analysis
                • 17.10 List of abbreviations
                  • List of abbreviations

                Research Methodology

                Technavio presents a detailed picture of the market by way of study, synthesis, and summation of data from multiple sources. The analysts have presented the various facets of the market with a particular focus on identifying the key industry influencers. The data thus presented is comprehensive, reliable, and the result of extensive research, both primary and secondary.

                INFORMATION SOURCES

                Primary sources

                • Manufacturers and suppliers
                • Channel partners
                • Industry experts
                • Strategic decision makers

                Secondary sources

                • Industry journals and periodicals
                • Government data
                • Financial reports of key industry players
                • Historical data
                • Press releases

                DATA ANALYSIS

                Data Synthesis

                • Collation of data
                • Estimation of key figures
                • Analysis of derived insights

                Data Validation

                • Triangulation with data models
                • Reference against proprietary databases
                • Corroboration with industry experts

                REPORT WRITING

                Qualitative

                • Market drivers
                • Market challenges
                • Market trends
                • Five forces analysis

                Quantitative

                • Market size and forecast
                • Market segmentation
                • Geographical insights
                • Competitive landscape

                Interested in this report?

                Get your sample now to see our research methodology and insights!

                Download Now

                Frequently Asked Questions

                Captive Power Generation market growth will increase by $ 8757.6 mn during 2025-2029 .

                The Captive Power Generation market is expected to grow at a CAGR of 7.9% during 2025-2029 .

                Captive Power Generation market is segmented by End-user( Metals and minerals, Sugar, Cement, Petrochemicals, Others) Fuel Type( Coal, Diesel, Gas, Renewables) Ownership( Multiple, Single)

                Ambuja Cements Ltd., Bharat Heavy Electricals Ltd., Dalmia Bharat Group, DCM Shriram Ltd., Ducon Infratechnologies Ltd., Essar, General Electric Co., Hindalco Industries Ltd., Infosys Ltd., Jakson Group, Jindal Steel and Power Ltd., Larsen and Toubro Ltd., Lloyds Metals and Energy Ltd., National Aluminium Co. Ltd., Reliance Industries Ltd., Tata Power Co. Ltd., Thermax Ltd., UltraTech Cement Ltd., Vedanta Ltd., Visa Steel Ltd. are a few of the key vendors in the Captive Power Generation market.

                APAC will register the highest growth rate of 100% among the other regions. Therefore, the Captive Power Generation market in APAC is expected to garner significant business opportunities for the vendors during the forecast period.

                India

                • High industrial power tariffsElectricity is a critical input in every industry is the driving factor this market.
                • especially in the manufacturing industry. Electricity costs have a substantial effect across the process value chain of the manufacturers and their final products. The high-cost tariffs generally have a negative impact on all the industries that rely on electricity inputs as they increase the competition between domestic manufacturers and international manufacturers. Additionally is the driving factor this market.
                • it results in passing on the price increment to the end-users is the driving factor this market.
                • thereby resulting in hiked prices of the manufactured commodities. For applications such as metal smelting or steel manufacturing that require blast furnaces or energy-intensive processes is the driving factor this market.
                • the high industrial power tariffs result in high costs of operation is the driving factor this market.
                • thereby increasing the overall operational expenditure (OPEX) of the companies. However is the driving factor this market.
                • the power tariffs continue to rise for industrial applications. For instance is the driving factor this market.
                • in November 2022 is the driving factor this market.
                • the Goa Chambers of Commerce and Industry is the driving factor this market.
                • Goa Pharmaceutical Manufacturers Association is the driving factor this market.
                • and Goa State Industries Association complained to the state government about inflated power bills and erratic power supply. Further is the driving factor this market.
                • in June 2023 is the driving factor this market.
                • the state government of Goa recommended to hike the power tariffs for industrial users by 6% is the driving factor this market.
                • which has created high tension among the industrial consumers.The manufacturing sector has emerged as one of the fastest-growing sectors in India with the assistance of initiatives such as Make in India. Owing to the energy-extensive nature of the sector and the high industrial power tariffs is the driving factor this market.
                • several organizations have turned toward installing their own power plants for captive consumption instead of relying on the grid. This results in lowering the OPEX as well as in providing a reliable power supply for continuous operations. Moreover is the driving factor this market.
                • it eliminates the dependency on the grid and industrial power tariffs. As a result is the driving factor this market.
                • several companies in energy-intensive sectors is the driving factor this market.
                • such as steel manufacturing is the driving factor this market.
                • cement manufacturing is the driving factor this market.
                • aluminum manufacturing is the driving factor this market.
                • and petrochemicals is the driving factor this market.
                • have installed captive power plants to cater to their domestic needs. Thus is the driving factor this market.
                • the high industrial power tariffs in India are expected to drive the growth of the captive power generation market in India during the forecast period. is the driving factor this market.

                The Captive Power Generation market vendors should focus on grabbing business opportunities from the Metals and minerals segment as it accounted for the largest market share in the base year.