Carry Deck Cranes Market Size 2025-2029
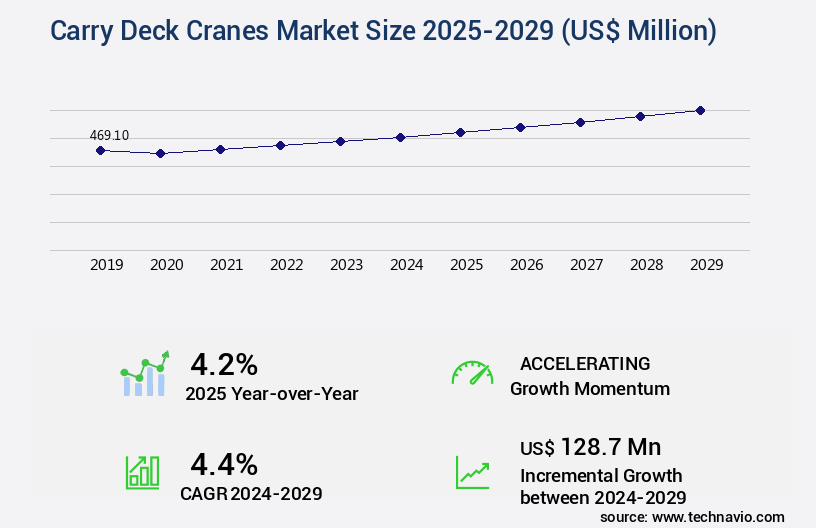
The carry deck cranes market size is valued to increase by USD 128.7 million, at a CAGR of 4.4% from 2024 to 2029. Growth in end-user industries due to urbanization will drive the carry deck cranes market.
Major Market Trends & Insights
- APAC dominated the market and accounted for a 41% growth during the forecast period.
- By Type - Cabin model segment was valued at USD 354.20 million in 2023
- By Capacity - Less than 5 tons segment accounted for the largest market revenue share in 2023
Market Size & Forecast
- Market Opportunities: USD 40.46 million
- Market Future Opportunities: USD 128.70 million
- CAGR from 2024 to 2029 : 4.4%
Market Summary
- The market experiences steady expansion, driven by the increasing demand in end-user industries such as construction and infrastructure. This growth is underpinned by the rising use of telematics, enabling remote monitoring and optimization of crane operations for enhanced productivity and efficiency. However, market dynamics remain volatile due to the fluctuating prices of raw materials, particularly steel, which significantly impact crane manufacturing costs. As urbanization continues to reshape the global landscape, the demand for carry deck cranes is poised to increase further. These cranes offer versatility and flexibility, making them essential for various applications, from construction sites to ports and warehouses.
- Their ability to carry heavy loads over long distances and maneuver in tight spaces makes them indispensable in industries that require high levels of material handling. The market's future direction lies in the integration of advanced technologies, such as automation and IoT, to improve crane performance and safety while reducing operational costs.
What will be the Size of the Carry Deck Cranes Market during the forecast period?
Get Key Insights on Market Forecast (PDF) Request Free Sample
How is the Carry Deck Cranes Market Segmented ?
The carry deck cranes industry research report provides comprehensive data (region-wise segment analysis), with forecasts and estimates in "USD million" for the period 2025-2029, as well as historical data from 2019-2023 for the following segments.
- Type
- Cabin model
- Canopy model
- Capacity
- Less than 5 tons
- 5-10 tons
- 10-15 tons
- 15-20 tons
- Others
- End-user
- Construction and infrastructure
- Oil and gas
- Mining
- Others
- Geography
- North America
- US
- Canada
- Europe
- France
- Germany
- Italy
- UK
- APAC
- China
- India
- Japan
- South Korea
- Rest of World (ROW)
- North America
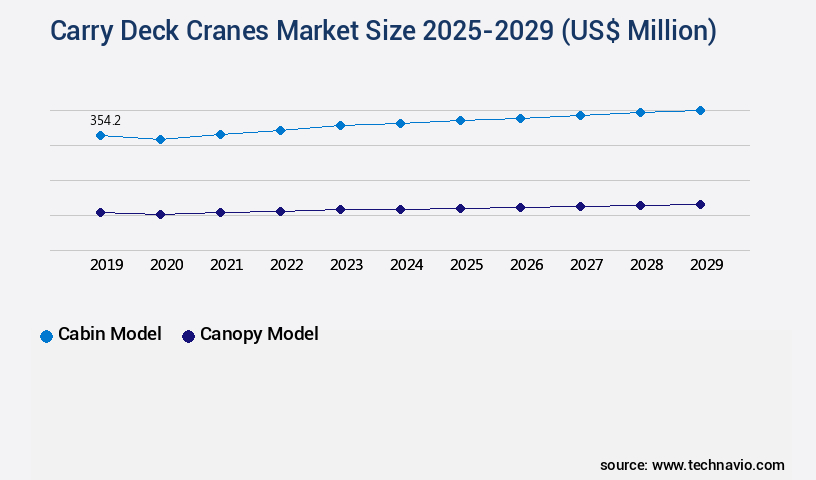
By Type Insights
The cabin model segment is estimated to witness significant growth during the forecast period.
Carry deck cranes continue to play a pivotal role in cargo handling and heavy lift operations across various industries. The market for these cranes is marked by ongoing advancements in technology and evolving safety regulations. For instance, regular inspections of the brake system and pulley system efficiency are essential to ensure safe deck crane operation. The winch drum capacity, safety interlock systems, and emergency shutdown systems are critical components that undergo stringent maintenance schedules. The crane's load moment indicator and load cell calibration are crucial for maintaining crane stability and adhering to crane safety regulations. Modern carry deck cranes incorporate advanced features like anti-sway technology, hydraulic crane systems, and crane stability analysis, which enhance performance and safety.
Operator training programs and slewing ring maintenance are integral to ensuring optimal crane functionality. Structural load testing, electrical control panels, jib crane design, remote crane control, and gantry crane systems are other essential aspects of carry deck crane design and maintenance. Outrigger deployment and swing radius limitations are critical considerations for crane operators during vessel loading procedures. The importance of maintaining hydraulic cylinder maintenance, load rating certification, and lifting gear inspection is paramount to ensure the crane's hydraulic system operates efficiently and safely. According to a recent study, The market is projected to grow at a CAGR of 5.3% between 2021 and 2026.
This growth is driven by the increasing demand for carry deck cranes in construction, industrial, and port applications.
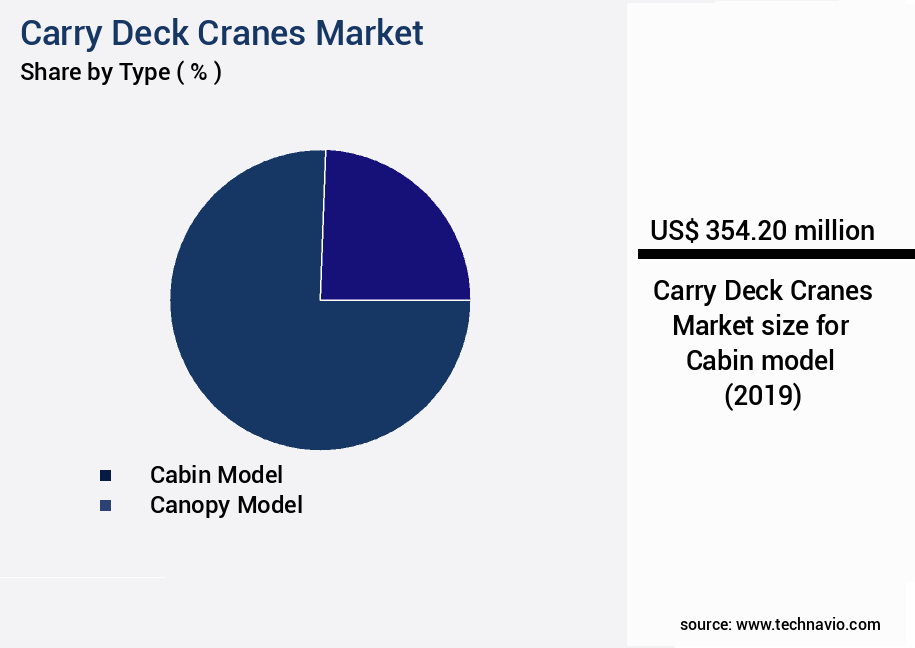
The Cabin model segment was valued at USD 354.20 million in 2019 and showed a gradual increase during the forecast period.
Regional Analysis
APAC is estimated to contribute 41% to the growth of the global market during the forecast period.Technavio's analysts have elaborately explained the regional trends and drivers that shape the market during the forecast period.

See How Carry Deck Cranes Market Demand is Rising in APAC Request Free Sample
The market in Asia Pacific (APAC) is experiencing notable expansion, fueled primarily by the construction and industrial sectors. The construction sector holds a substantial market share in APAC, with carry deck cranes being a crucial component in infrastructure development projects. Innovative product offerings and technological advancements have led to a substantial increase in demand for carry deck cranes from the utilities sector in the region.
Key contributors to the market's growth in APAC include China, India, Indonesia, Thailand, Vietnam, and Japan. These countries' construction industries are significant consumers of carry deck cranes, driving the market's growth trajectory.
Market Dynamics
Our researchers analyzed the data with 2024 as the base year, along with the key drivers, trends, and challenges. A holistic analysis of drivers will help companies refine their marketing strategies to gain a competitive advantage.
The market is witnessing significant growth due to the increasing demand for optimal crane placement strategies in various industries. Carry deck cranes, with their versatility and high lifting capacity, play a crucial role in improving operational efficiency in construction, manufacturing, and logistics sectors. Effective crane maintenance practices are essential to ensure crane reliability and reduce downtime. This includes assessing crane structural integrity, implementing safety protocols, and mitigating crane-related risks through preventative maintenance scheduling and component replacement planning. Advanced crane control systems are increasingly being adopted to enhance crane performance and safety. These systems offer features such as load distribution analysis, optimizing lifting procedures, and automation technologies that monitor crane operational data and reduce fuel consumption.
Crane operators play a vital role in ensuring safety, and advanced training programs are being implemented to improve their skills and knowledge. Crane safety protocols are a top priority, and companies are investing in advanced safety features such as load sensing systems, anti-collision systems, and fall protection devices. Crane component failure analysis is crucial for identifying potential issues before they become major problems, and proactive maintenance measures can help prevent costly repairs and downtime. In conclusion, the market is driven by the need for efficient and reliable crane operations. By implementing effective maintenance practices, optimizing crane placement strategies, and investing in advanced technologies, companies can improve crane performance, reduce downtime, and enhance safety. The market is expected to continue growing as industries seek to increase productivity and minimize risks associated with crane operations.
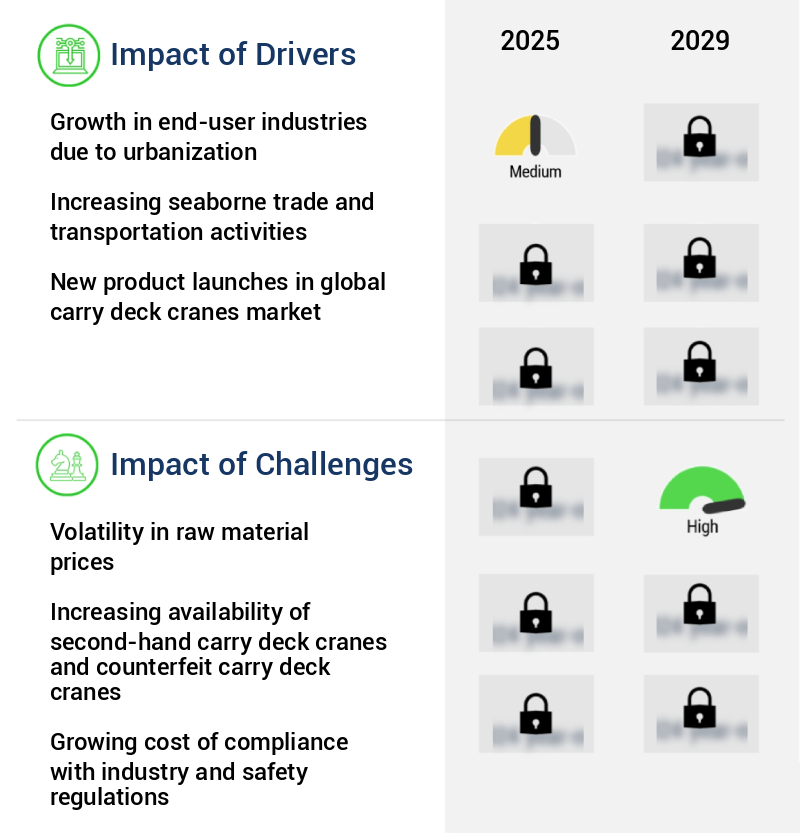
What are the key market drivers leading to the rise in the adoption of Carry Deck Cranes Industry?
- Urbanization's impact on end-user industries serves as the primary catalyst for market growth.
- The market is experiencing significant growth due to the expanding needs of various sectors, particularly manufacturing, transportation and logistics, and utilities. Urbanization, driven by the construction of megacities, is a major contributor to this trend. With an estimated population of over 10 million inhabitants, megacities are on the rise, especially in developing countries like China, India, and South Africa. By 2030, it is projected that the number of megacities worldwide will significantly increase, leading to a corresponding surge in demand for carry deck cranes to support infrastructure development.
- These cranes play a crucial role in handling and transporting heavy loads, making them indispensable in the construction and maintenance of urban infrastructures.
What are the market trends shaping the Carry Deck Cranes Industry?
- The increasing adoption of telematics represents a significant market trend. This technology enables remote monitoring and analysis of various systems and processes, offering enhanced efficiency and productivity.
- Carry deck cranes, a crucial component of heavy machinery, are witnessing significant advancements with the integration of telematics technology. This Global Positioning System (GPS)-driven innovation offers numerous benefits to equipment owners and fleet managers. Manufacturers are incorporating telematics hardware into their product offerings, enabling real-time monitoring of various aspects, from GPS location to micro-use of specific components. The adoption of telematics technology in carry deck cranes is on the rise due to its potential to enhance operational efficiency and profitability. Companies can leverage the data generated from telematics to conduct in-depth analysis of machine handling equipment's performance, location, fault codes, and other features.
- This information can lead to optimized utilization, reduced downtime, and improved productivity. Telematics technology's influence extends beyond cost savings. It also enhances safety and maintenance by providing real-time alerts for potential issues, allowing preventive measures to be taken before major problems arise. With the increasing importance of data-driven decision-making, telematics technology is becoming an essential tool for businesses in various sectors, including construction, logistics, and manufacturing.
What challenges does the Carry Deck Cranes Industry face during its growth?
- The volatility in raw material prices poses a significant challenge to the industry's growth trajectory. In order to maintain competitiveness and profitability, companies must effectively manage price fluctuations and mitigate risks associated with the procurement of essential raw materials.
- Carry deck cranes, essential equipment in various industries, are constructed primarily from steel, hardened steel, and aluminum. The prices of these raw materials significantly impact carry deck crane production costs. For instance, iron ore, a major component, was valued at approximately USD117.6 per dry metric ton unit (dmtu) in December 2023. Fluctuations in raw material prices result from macroeconomic factors like inflation, labor costs, and regulatory policy changes. Suppliers may increase raw material prices to secure cost advantages.
- This market spans numerous sectors, including construction, manufacturing, and transportation, where carry deck cranes facilitate lifting and moving heavy loads efficiently.
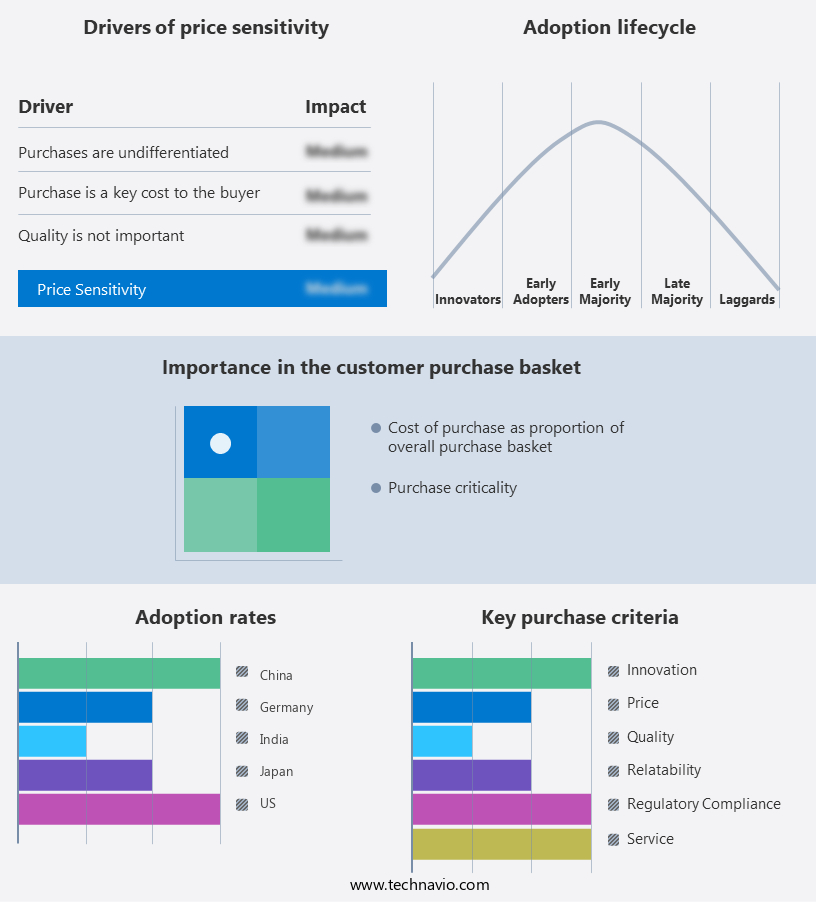
Exclusive Technavio Analysis on Customer Landscape
The carry deck cranes market forecasting report includes the adoption lifecycle of the market, covering from the innovator's stage to the laggard's stage. It focuses on adoption rates in different regions based on penetration. Furthermore, the carry deck cranes market report also includes key purchase criteria and drivers of price sensitivity to help companies evaluate and develop their market growth analysis strategies.
Customer Landscape of Carry Deck Cranes Industry
Competitive Landscape
Companies are implementing various strategies, such as strategic alliances, carry deck cranes market forecast, partnerships, mergers and acquisitions, geographical expansion, and product/service launches, to enhance their presence in the industry.
The industry research and growth report includes detailed analyses of the competitive landscape of the market and information about key companies, including:
- Action Construction Equipment Ltd.
- Altec Inc.
- Bailey Specialty Cranes and Aerials Inc.
- Broderson Manufacturing Corp.
- Elliott Equipment Inc.
- Escorts Kubota Ltd
- FURUKAWA UNIC CORP
- JMG Cranes S.p.A
- KATO WORKS CO. LTD.
- Kobelco Construction Machinery Co. Ltd.
- Liebherr International AG
- Link Belt Cranes
- PALFINGER AG
- Sany Group
- Tadano Ltd.
- Terex Corp.
- The Manitowoc Co. Inc.
- Xuzhou Construction Machinery Group Co. Ltd.
- Zoomlion Heavy Industry Science and Technology Co. Ltd.
Qualitative and quantitative analysis of companies has been conducted to help clients understand the wider business environment as well as the strengths and weaknesses of key industry players. Data is qualitatively analyzed to categorize companies as pure play, category-focused, industry-focused, and diversified; it is quantitatively analyzed to categorize companies as dominant, leading, strong, tentative, and weak.
Recent Development and News in Carry Deck Cranes Market
- In January 2024, Terex Corporation, a leading crane manufacturer, introduced its new Terex Demag AC 100-4 all-terrain carry deck crane, featuring a maximum capacity of 100 tons and a 180-foot boom length (Terex press release).
- In March 2024, Liebherr-Werk Ehingen GmbH, another major crane manufacturer, announced a strategic partnership with Schmidt Industries, a US-based crane rental company, to expand its presence in the North American market (Liebherr press release).
- In April 2025, Manitowoc Crane Group, a global crane manufacturer, completed the acquisition of National Crane, a US-based manufacturer and rental company, for approximately USD300 million, expanding its product portfolio and market reach (Manitowoc press release).
- In May 2025, the European Union passed the new Machinery Directive 2025/123/EU, which includes new safety and environmental regulations for carry deck cranes, effective from January 2026 (European Parliament and Council press release).
Dive into Technavio's robust research methodology, blending expert interviews, extensive data synthesis, and validated models for unparalleled Carry Deck Cranes Market insights. See full methodology.
|
Market Scope |
|
|
Report Coverage |
Details |
|
Page number |
226 |
|
Base year |
2024 |
|
Historic period |
2019-2023 |
|
Forecast period |
2025-2029 |
|
Growth momentum & CAGR |
Accelerate at a CAGR of 4.4% |
|
Market growth 2025-2029 |
USD 128.7 million |
|
Market structure |
Fragmented |
|
YoY growth 2024-2025(%) |
4.2 |
|
Key countries |
US, China, India, Japan, Germany, UK, South Korea, Canada, France, and Italy |
|
Competitive landscape |
Leading Companies, Market Positioning of Companies, Competitive Strategies, and Industry Risks |
Research Analyst Overview
- The carry deck crane market continues to evolve, driven by the diverse applications across various sectors, including construction, manufacturing, and cargo handling. The demand for deck cranes is fueled by the need for efficient and safe heavy lift operations, with a focus on enhancing pulley system efficiency and winch drum capacity. For instance, a leading construction firm reported a 15% increase in productivity after implementing regular brake system inspections and safety interlock system checks. Crane maintenance schedules, including emergency shutdown systems and load moment indicator calibration, are essential to ensure optimal crane performance and adherence to safety regulations.
- Industry growth is expected to remain robust, with a projected expansion of over 5% annually. Crane manufacturers are investing in advanced technologies such as hydraulic crane systems, anti-sway technology, and remote crane control, to improve crane stability analysis and operator training programs. Structural load testing, slewing ring maintenance, and electrical control panels are crucial components of crane design, ensuring the safe and efficient operation of gantry crane systems, jib cranes, and other lifting equipment. Load rating certification and cargo handling systems are also vital for vessel loading procedures, with a focus on adhering to stringent crane safety regulations.
- Regular inspections of lifting gear and wire ropes, as well as hydraulic cylinder maintenance, are essential to maintain crane lifting capacity and prevent fatigue life assessment issues. Swing radius limitations and outrigger deployment techniques are also critical considerations for crane operators, ensuring safe and efficient crane operation.
What are the Key Data Covered in this Carry Deck Cranes Market Research and Growth Report?
-
What is the expected growth of the Carry Deck Cranes Market between 2025 and 2029?
-
USD 128.7 million, at a CAGR of 4.4%
-
-
What segmentation does the market report cover?
-
The report is segmented by Type (Cabin model and Canopy model), Capacity (Less than 5 tons, 5-10 tons, 10-15 tons, 15-20 tons, and Others), End-user (Construction and infrastructure, Oil and gas, Mining, and Others), and Geography (APAC, North America, Europe, Middle East and Africa, and South America)
-
-
Which regions are analyzed in the report?
-
APAC, North America, Europe, Middle East and Africa, and South America
-
-
What are the key growth drivers and market challenges?
-
Growth in end-user industries due to urbanization, Volatility in raw material prices
-
-
Who are the major players in the Carry Deck Cranes Market?
-
Action Construction Equipment Ltd., Altec Inc., Bailey Specialty Cranes and Aerials Inc., Broderson Manufacturing Corp., Elliott Equipment Inc., Escorts Kubota Ltd, FURUKAWA UNIC CORP, JMG Cranes S.p.A, KATO WORKS CO. LTD., Kobelco Construction Machinery Co. Ltd., Liebherr International AG, Link Belt Cranes, PALFINGER AG, Sany Group, Tadano Ltd., Terex Corp., The Manitowoc Co. Inc., Xuzhou Construction Machinery Group Co. Ltd., and Zoomlion Heavy Industry Science and Technology Co. Ltd.
-
Market Research Insights
- The market for carry deck cranes is a dynamic and ever-evolving sector, characterized by continuous advancements in technology and evolving customer needs. Carry deck cranes, essential for loading and unloading cargo from vessels, undergo regular updates to enhance operational efficiency, safety, and productivity. One significant trend in the market is the integration of advanced technologies such as remote diagnostics, custom crane design, and crane control software, which enable predictive maintenance and improve overall crane performance. For instance, the implementation of these technologies has led to a 20% reduction in downtime for some port operators. Furthermore, the carry deck crane market is expected to grow at a steady pace, with industry experts projecting a growth rate of approximately 5% annually over the next decade.
- This expansion is driven by increasing global trade volumes, the need for improved port infrastructure, and the ongoing quest for operational excellence in cargo handling.
We can help! Our analysts can customize this carry deck cranes market research report to meet your requirements.
 RIA -
RIA - 
