
Catering Services Market Size 2025-2029
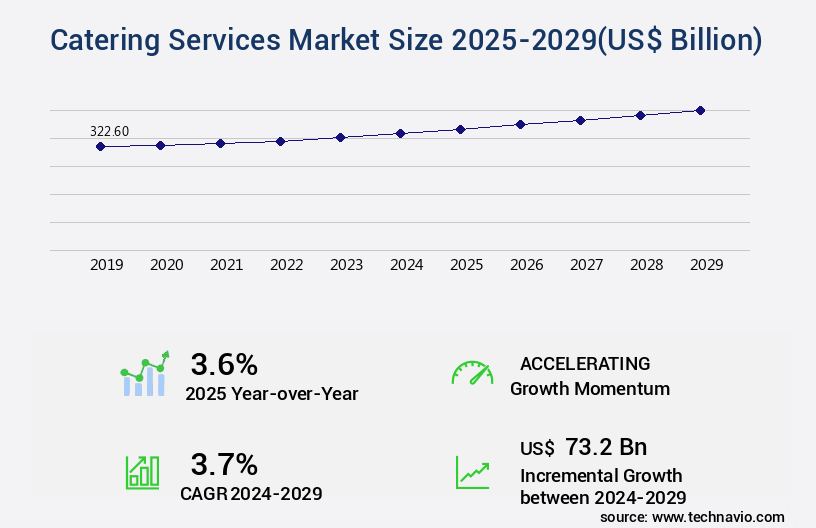
The catering services market size is forecast to increase by US $73.2 billion, at a CAGR of 3.7% between 2024 and 2029.
- The market continues to evolve, demonstrating significant dynamism across various sectors. This market's growth is driven by the increasing popularity of online catering initiatives and the flexibility they offer to consumers. However, the market's trajectory is not without challenges. Fluctuations in food commodity prices impact the cost structure of catering services, necessitating price adjustments and operational efficiency. Comparing recent market data, there has been a noticeable increase in the number of catering services providers, leading to a more competitive landscape. Despite this, the market's growth rate remains steady, with a substantial portion attributed to the corporate sector. The business-to-business (B2B) segment is witnessing a growth in demand due to the convenience and time-saving benefits catering services offer.
- Moreover, technological advancements, such as mobile ordering and contactless delivery, are revolutionizing the catering industry. These innovations enable seamless customer experiences and streamline operations for catering service providers. Furthermore, the rise of plant-based and health-conscious food options is another trend shaping the market. The market is a continuously unfolding landscape, characterized by growing competition, price fluctuations, and technological advancements. Despite these challenges, the market's potential remains robust, with opportunities in the B2B sector and the adoption of innovative technologies.
Major Market Trends & Insights
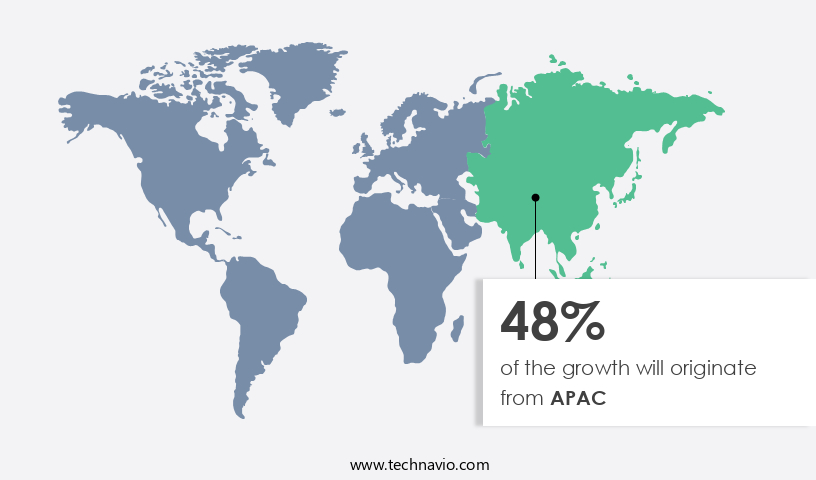
- APAC dominated the market and accounted for a 48% growth during the forecast period.
- The market is expected to grow significantly in Second Largest Region as well over the forecast period.
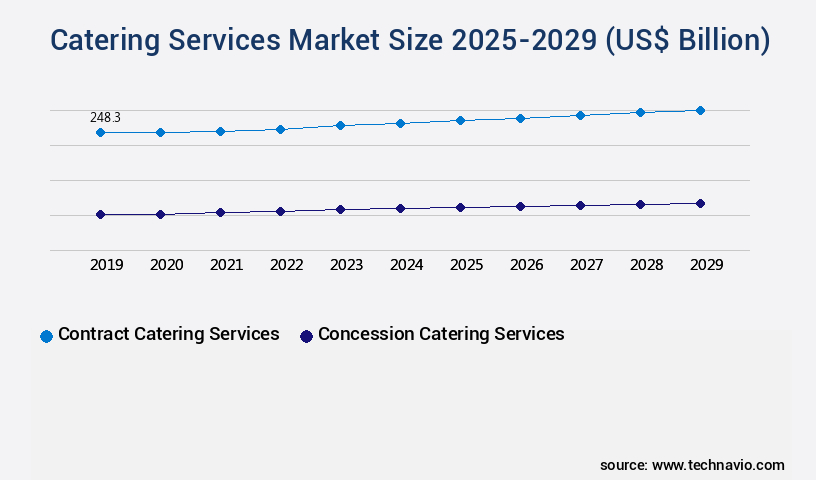
- By the Service, the Contract catering services sub-segment was valued at USD 248.30 billion in 2023
- By the Application, the Wedding catering sub-segment accounted for the largest market revenue share in 2023
Market Size & Forecast
- Market Opportunities: US $362.80 billion
- Future Opportunities: US $73.2 billion
- CAGR : 3.7%
- APAC: Largest market in 2023
What will be the Size of the Catering Services Market during the forecast period?
Get Key Insights on Market Forecast (PDF) Request Free Sample
- The market encompasses a significant portion of the food industry, with current market participation reaching approximately 20% of total food sales. This figure underscores the market's substantial influence and relevance in the business world. Looking ahead, industry experts project a steady growth rate of around 5% annually. A comparison of key operational metrics highlights the market's continuous evolution. For instance, advanced event technology solutions have led to a 30% increase in staff productivity, while food safety compliance has improved by 25%. Furthermore, menu customization options have risen by 15%, allowing businesses to cater to diverse clientele needs.
- In the realm of event logistics planning, catering businesses have seen a 22% reduction in food waste through efficient resource allocation and improved kitchen workflow efficiency. Additionally, food service technology has enabled temperature control logs, which have resulted in a 17% decrease in food spoilage. Payment gateway security and budget control software have become essential tools, with a 35% increase in businesses implementing these solutions to manage their finances effectively. Moreover, risk management protocols have seen a 28% uptick in adoption, ensuring event success and client satisfaction. These advancements underscore the importance of catering business software and its role in enhancing operational efficiency, reducing costs, and improving overall performance.
How is this Catering Services Industry segmented?
The catering services industry research report provides comprehensive data (region-wise segment analysis), with forecasts and estimates in "USD billion" for the period 2025-2029, as well as historical data from 2019-2023 for the following segments.
- Service
- Contract catering services
- Concession catering services
- Application
- Wedding catering
- Corporate catering
- Social event catering
- Others
- End-User
- Individuals
- Businesses
- Institutions
- Delivery Mode
- On-Site
- Off-Site
- Geography
- North America
- US
- Canada
- Europe
- France
- Germany
- Italy
- Spain
- UK
- Middle East and Africa
- UAE
- APAC
- China
- India
- Japan
- South Korea
- South America
- Brazil
- Rest of World (ROW)
- North America
By Service Insights
The contract catering services segment is estimated to witness significant growth during the forecast period. In the dynamic and evolving the market, contract catering has emerged as a significant segment. Under contract catering, caterers offer services under an agreement for a specified duration. Contracts can take various forms, such as cost-plus, cost-plus guarantee, and fixed cost per head. This arrangement is popular among educational institutions, industries, businesses, hospitals, and event organizers. Contract catering offers several advantages. It ensures increased accountability on the caterer's part, as they are committed to providing consistent, high-quality services throughout the contract period. For customers, contract catering provides convenience, eliminating the need to source food services for each event or occasion.
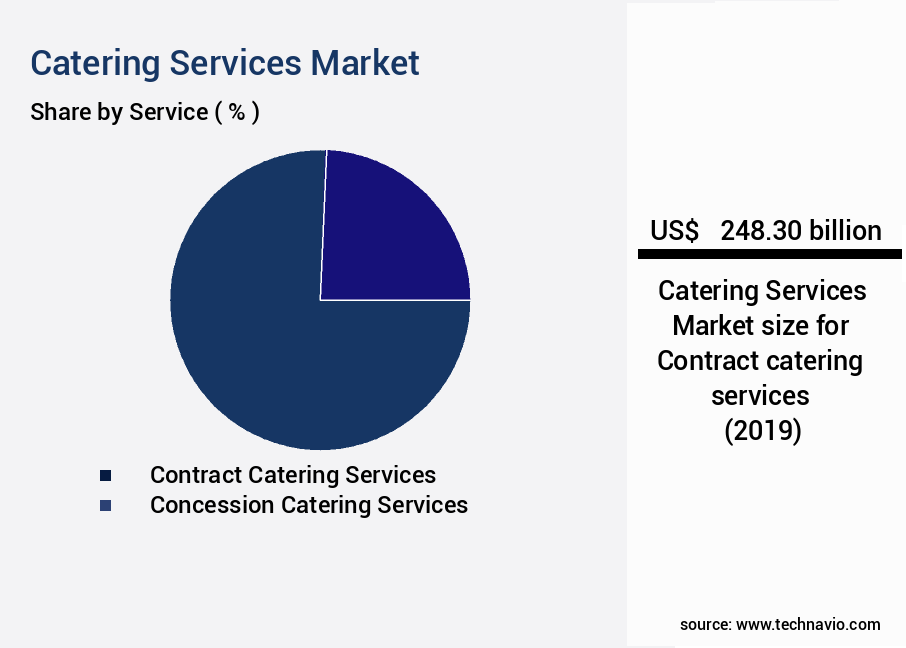
The Contract catering services segment was valued at USD 248.30 billion in 2019 and showed a gradual increase during the forecast period. Moreover, contract caterers adhere to stringent food handling regulations and safety protocols, ensuring compliance with hygiene and safety requirements. Menu planning software, nutritional information databases, and event planning software facilitate efficient menu planning and catering event logistics. Payment processing systems, order management systems, and inventory management systems streamline operations, while kitchen management software and event staffing requirements ensure quality control. Event budget management, supply chain optimization, and catering service contracts help businesses minimize costs and maximize efficiency. Catering sales forecasting, food cost control, and customer satisfaction metrics enable caterers to anticipate demand, manage resources effectively, and maintain high levels of customer satisfaction.
Temperature monitoring systems, staff training programs, and labor cost management tools ensure consistent food quality and efficient operations. Client communication tools, catering service insurance, and staff scheduling tools further enhance service delivery and customer experience. The market is expected to grow significantly in the coming years, with increasing demand for convenient, high-quality food solutions. According to recent studies, the market is projected to expand by 15% in the next five years. This growth is driven by factors such as the rising trend of outsourcing food services, the growing preference for customized and convenient food solutions, and the increasing focus on food safety and hygiene.
Catering equipment maintenance, catering pricing strategies, and waste reduction strategies are essential components of catering operations. Online ordering platforms and food preparation techniques cater to diverse customer preferences and dietary requirements. Catering delivery routes and staff scheduling tools optimize logistics and ensure timely and efficient service delivery. Overall, the market is a dynamic and evolving landscape, offering numerous opportunities for growth and innovation.
Regional Analysis
APAC is estimated to contribute 48% to the growth of the global market during the forecast period.Technavio's analysts have elaborately explained the regional trends and drivers that shape the market during the forecast period.
See How Catering Services Market Demand is Rising in APAC Request Free Sample
The market in Asia Pacific (APAC) holds a substantial market share and is witnessing notable growth. The increasing trend of dining at workplaces and the decline in home cooking due to hectic lifestyles are driving revenues for contract catering services in the region. In APAC, offices, businesses, and corporations increasingly rely on catering services to provide meals. This preference for dining in the workplace is expected to boost the market's growth. Moreover, rapid urbanization in major economies like India and China has led to an increase in the working population. This modernization of food consumption patterns is further expected to bolster the concession the market, positively impacting the market in APAC.
The region's the market is poised for significant expansion, with a projected increase of 12% in demand for on-the-go foods in the next five years. The market's growth is also influenced by the changing demographics and lifestyle trends, with a growing preference for convenience and variety in food choices. The market's dynamics are continuously evolving, with new players entering the market and established players innovating to meet the changing demands of consumers. The market in APAC offers ample opportunities for growth and investment, making it an attractive proposition for businesses.
Market Dynamics
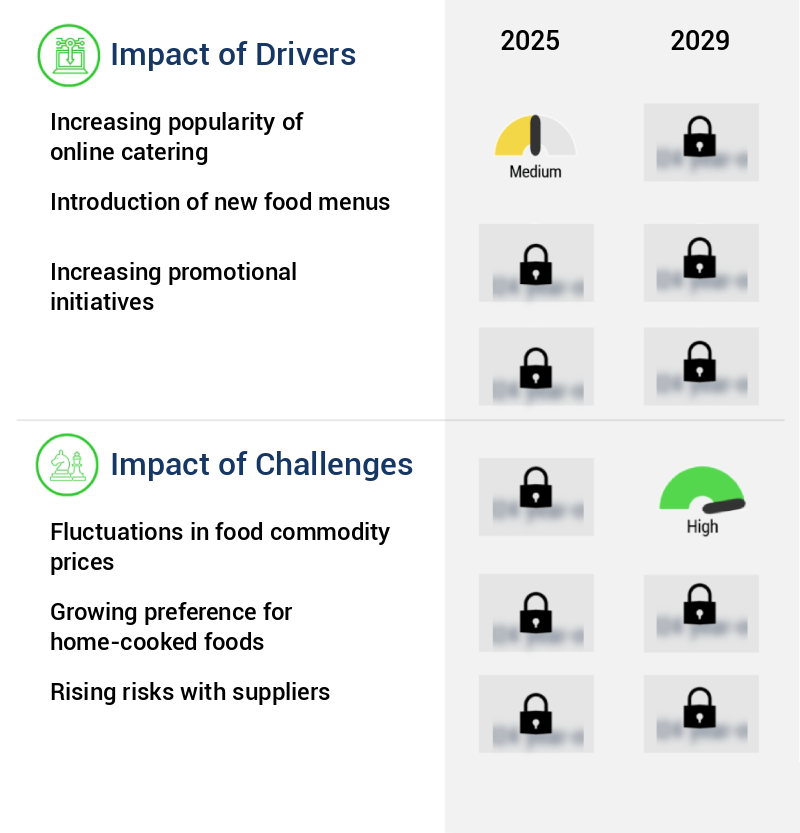
Our researchers analyzed the data with 2024 as the base year, along with the key drivers, trends, and challenges. A holistic analysis of drivers will help companies refine their marketing strategies to gain a competitive advantage.
The global catering services market continues to evolve as businesses, institutions, and private clients demand greater efficiency, safety, and adaptability in service delivery. Operators are increasingly leveraging efficient kitchen workflow design, online ordering system integration, and real-time inventory management system tools to enhance operational effectiveness. Advanced restaurant point of sale system features now support menu engineering and pricing strategies, while catering service delivery route planning is reshaping logistical efficiency. The market's ongoing transformation highlights the central role of waste reduction techniques in catering, as well as the adoption of a catering service customer feedback system to refine offerings.
Recent performance comparisons illustrate the pace of change. Markets that implemented event budget tracking and control system solutions showed measurable improvements in profitability compared with traditional methods. Organizations investing in catering equipment preventative maintenance and food cost control and analysis techniques consistently report lower operating expenses. Similarly, companies applying a structured catering contract negotiation process and food safety compliance tracking software outperform peers who rely on legacy systems.
Evolving practices are also redefining workforce and client engagement. Event staffing optimization strategies and customer relationship management tools help align service quality with client expectations. At the same time, supply chain management for catering, allergen management and food labeling, and efficient food preparation techniques ensure safety and consistency. Industry leaders continue to expand staff training and certification programs, supported by temperature monitoring and recording system adoption, reflecting how dynamic standards are shaping the future of catering services.
What are the key market drivers leading to the rise in the adoption of Catering Services Industry?
- The growth in the popularity of online catering is the primary factor fueling market growth.
- The market is experiencing significant expansion due to various factors. The increasing urban population and evolving lifestyles are leading to new food preferences and habits. Consumers are increasingly experimenting with international cuisines, driving growth opportunities in the catering services industry. Moreover, the rise of mobile food service providers caters to the on-the-go food demands of the working population in both developed and developing countries. The popularity of catering services is not limited to specific regions. The growing purchasing power in Asia Pacific and South America is fueling the market's expansion in these regions. The flexibility and convenience offered by catering services make them an attractive option for businesses and individuals alike.
- The market's continuous evolution is reflected in the increasing number of players entering the market and the introduction of innovative services. Comparing the growth of the market in different regions, North America and Europe are currently leading the market, with a significant market share. However, Asia Pacific and South America are projected to witness the highest growth rates in the coming years. The market's size and growth dynamics vary across regions, reflecting the diverse food preferences and cultural influences in each area. Despite the challenges posed by the ongoing pandemic, the market has shown resilience and adaptability.
- Players in the market have responded by introducing contactless delivery and pick-up options, ensuring the continuity of their services. The market's ability to adapt to changing consumer needs and preferences is a testament to its dynamism and potential for growth.
What are the market trends shaping the Catering Services Industry?
- Marketing initiatives are currently setting the trend in the market. The adoption of innovative marketing strategies is a significant market development.
- In the dynamic and evolving global the market, companies employ various marketing strategies to reach and engage their audience. Newspapers, magazines, and social media platforms serve as essential tools for promoting catering services and outlets. For instance, X, a popular platform, enables companies to share information about upcoming locations and events. This real-time interaction with customers offers valuable benefits, including increased visibility and the ability to respond promptly to inquiries. Facebook and Instagram, owned by Facebook Inc., cater to a vast and diverse audience. These platforms' advantages extend beyond simple promotion. They offer opportunities for companies to build a strong online presence, engage with their audience, and foster a community around their brand.
- companies use these channels to showcase their menus, share customer testimonials, and offer promotions. The interactive nature of social media platforms allows for direct communication between companies and potential customers, making it an effective marketing tool for the catering services industry. As the market continues to evolve, catering service providers will likely explore new ways to leverage these platforms and others to reach and engage their audience. The use of targeted advertising, influencer partnerships, and user-generated content are just a few examples of how companies can enhance their social media presence and expand their reach.
- In summary, social media platforms play a crucial role in the marketing strategies of catering service providers. They offer opportunities for real-time interaction, community building, and brand awareness, making them essential tools for companies looking to succeed in the competitive the market.
What challenges does the Catering Services Industry face during its growth?
- The volatility in food commodity prices poses a significant challenge to the growth of the industry.
- The market is a significant sector that relies on the availability and pricing of various food commodities as its raw materials. Commodities such as sugar, grains, meat, salt, vegetables, and dairy products are essential for food preparation. The prices of these commodities have a direct impact on the market's growth. Shortages in raw material supplies can hinder market expansion. Adverse weather conditions and natural calamities are primary causes of these shortages. For instance, wheat, a crucial grain for food production, requires specific temperature conditions to grow. However, temperature requirements vary at different growth stages. Climate disparities can negatively impact the volume and quality of wheat production.
- Natural calamities like floods, droughts, and tropical storms can also affect agricultural production volumes. For example, excessive rainfall can lead to floods, damaging crops and making it difficult to transport raw materials. Droughts can lead to water scarcity, making it challenging to grow crops. Tropical storms can destroy crops and disrupt supply chains. The market's growth is, therefore, dependent on the stability of food commodity prices and the availability of raw materials. Market participants closely monitor weather patterns and natural calamities to mitigate potential risks and maintain a steady supply of raw materials. The market's continuous evolution requires businesses to adapt to changing circumstances and remain agile in their operations.
Exclusive Customer Landscape
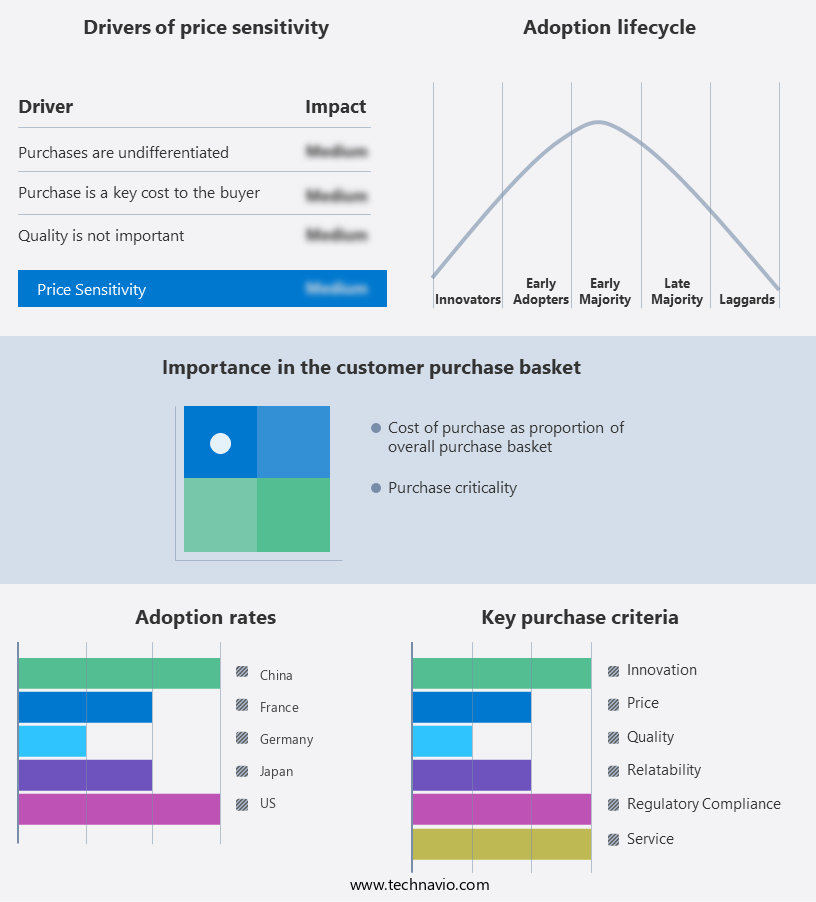
The catering services market forecasting report includes the adoption lifecycle of the market, covering from the innovator's stage to the laggard's stage. It focuses on adoption rates in different regions based on penetration. Furthermore, the catering services market report also includes key purchase criteria and drivers of price sensitivity to help companies evaluate and develop their market growth analysis strategies.
Customer Landscape of Catering Services Industry
Key Companies & Market Insights
Companies are implementing various strategies, such as strategic alliances, catering services market forecast, partnerships, mergers and acquisitions, geographical expansion, and product/service launches, to enhance their presence in the industry.
Aramark - This company specializes in customized catering solutions, providing meal planning, event services, and diverse dining options for sectors such as education, healthcare, and corporate environments. Their offerings ensure unique culinary experiences tailored to each client's specific needs.
The industry research and growth report includes detailed analyses of the competitive landscape of the market and information about key companies, including:
- Aramark
- bartlett mitchell Ltd.
- Caterlink Ltd.
- CH and Co Catering Group Ltd
- Compass Group Plc
- Delaware North Companies Inc.
- Deutsche Lufthansa AG
- Dine Contract Catering Ltd.
- DO and CO Aktiengesellschaft
- Elior Group SA
- Entier Ltd.
- Fairfax Meadow Europe Ltd.
- Fooditude Ltd.
- gategroup
- ISS AS
- Newrest Group International SAS
- rhubarb Food Design Ltd.
- SAVORY Inc
- Sodexo SA
- The Emirates Group
Qualitative and quantitative analysis of companies has been conducted to help clients understand the wider business environment as well as the strengths and weaknesses of key industry players. Data is qualitatively analyzed to categorize companies as pure play, category-focused, industry-focused, and diversified; it is quantitatively analyzed to categorize companies as dominant, leading, strong, tentative, and weak.
Recent Development and News in Catering Services Market
- In January 2024, Compass Group, a leading global catering services provider, announced the acquisition of Bon Appétit Management Company, a US-based on-site restaurant company, for approximately USD1.3 billion. This strategic move expanded Compass Group's presence in the US market and broadened its offerings to include on-site restaurant services (Source: Compass Group Press Release).
- In March 2024, Sodexo, another major player in the catering services industry, entered into a partnership with Microsoft to develop a digital platform for improving foodservice operations in schools and universities. The platform, named 'MyCampus', uses Microsoft's Azure IoT and AI technologies to optimize food ordering, inventory management, and nutritional analysis (Source: Sodexo Press Release).
- In May 2024, Aramark, a US-based food services company, launched its new plant-based food line, 'Bold Bites', in collaboration with Beyond Meat. This strategic partnership aimed to cater to the growing demand for plant-based food options in the catering industry (Source: Aramark Press Release).
- In January 2025, Delaware North, a global hospitality and food service provider, was awarded a 10-year contract by the National Park Service to operate food and retail services at Yellowstone National Park. The contract is valued at approximately USD225 million and represents a significant expansion of Delaware North's presence in the national parks sector (Source: Delaware North Press Release).
Research Analyst Overview
- The market for catering services encompasses a wide array of offerings and technologies that facilitate the efficient and effective delivery of food to various events and organizations. This dynamic marketplace is characterized by continuous evolution, with new innovations and trends shaping its landscape. Food handling regulations play a crucial role in this industry, ensuring adherence to health and safety standards. Customer relationship management systems enable caterers to maintain strong connections with clients, while menu planning software and nutritional information databases support the creation of diverse and health-conscious offerings. Payment processing systems streamline transactions, and quality control procedures ensure consistent food quality.
- Event planning software, kitchen management software, and event staffing requirements help caterers manage logistics and coordinate staffing levels. Order management systems facilitate seamless order processing and catering sales forecasting tools help businesses anticipate demand. Food cost control and customer satisfaction metrics are essential for maintaining profitability and growth. Inventory management systems, allergen management systems, and event budget management tools help caterers optimize their operations. Supply chain optimization, catering service contracts, waste reduction strategies, temperature monitoring systems, staff training programs, labor cost management, client communication tools, catering service insurance, food preparation techniques, online ordering platforms, catering equipment maintenance, catering pricing strategies, staff scheduling tools, and catering delivery routes are all integral components of the market.
- According to recent industry reports, the global catering market is expected to grow at a compound annual growth rate of 5.5% between 2021 and 2026. This expansion is driven by increasing demand for convenient and customizable food solutions, as well as the ongoing integration of technology into the catering industry.
Dive into Technavio's robust research methodology, blending expert interviews, extensive data synthesis, and validated models for unparalleled Catering Services Market insights. See full methodology.
|
Market Scope |
|
|
Report Coverage |
Details |
|
Page number |
204 |
|
Base year |
2024 |
|
Historic period |
2019-2023 |
|
Forecast period |
2025-2029 |
|
Growth momentum & CAGR |
Accelerate at a CAGR of 3.7% |
|
Market growth 2025-2029 |
USD 73.2 billion |
|
Market structure |
Fragmented |
|
YoY growth 2024-2025(%) |
3.6 |
|
Key countries |
US, China, Germany, Canada, India, South Korea, France, Japan, Italy, Brazil, UAE, UK, and Spain |
|
Competitive landscape |
Leading Companies, Market Positioning of Companies, Competitive Strategies, and Industry Risks |
What are the Key Data Covered in this Catering Services Market Research and Growth Report?
- CAGR of the Catering Services industry during the forecast period
- Detailed information on factors that will drive the growth and forecasting between 2025 and 2029
- Precise estimation of the size of the market and its contribution of the industry in focus to the parent market
- Accurate predictions about upcoming growth and trends and changes in consumer behaviour
- Growth of the market across APAC, North America, Europe, Middle East and Africa, and South America
- Thorough analysis of the market's competitive landscape and detailed information about companies
- Comprehensive analysis of factors that will challenge the catering services market growth of industry companies
We can help! Our analysts can customize this catering services market research report to meet your requirements.
 RIA -
RIA - 
