Event Logistics Market Analysis, Size, and Forecast 2026-2030: APAC (China, Japan, and India), North America (US, Canada, and Mexico), Europe (Germany, UK, and France), South America (Brazil and Argentina), Middle East and Africa (Saudi Arabia, UAE, and South Africa), and Rest of World (ROW)

Event Logistics Market Analysis, Size, and Forecast 2026-2030:
APAC (China, Japan, and India), North America (US, Canada, and Mexico), Europe (Germany, UK, and France), South America (Brazil and Argentina), Middle East and Africa (Saudi Arabia, UAE, and South Africa), and Rest of World (ROW)

Published: Apr 2026 322 Pages SKU: IRTNTR41064

Market Overview at a Glance

$1.62 B
Market Opportunity
6%
CAGR 2025 - 2030
32.2%
APAC Growth
$1.85 B
Entertainment events segment 2024

Event Logistics Market Size 2026-2030
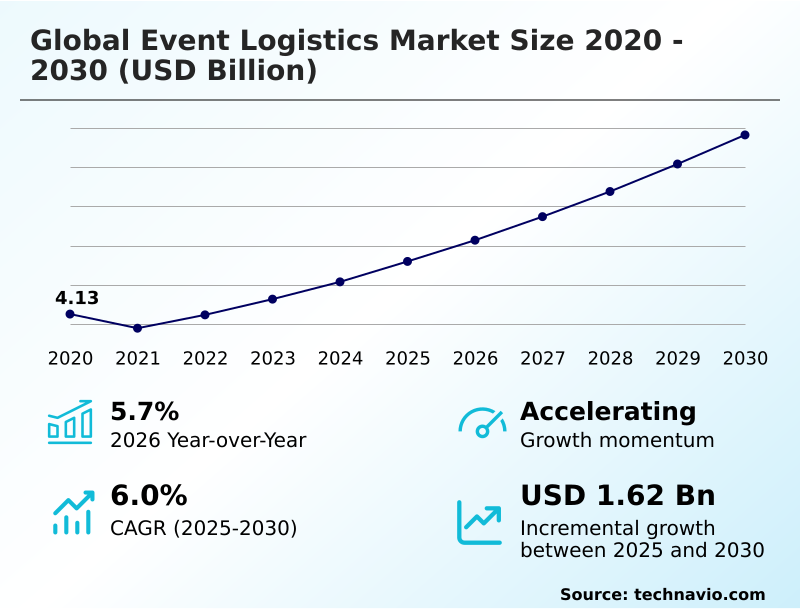
The event logistics market size is valued to increase by USD 1.62 billion, at a CAGR of 6% from 2025 to 2030. Growth in corporate events and international exhibitions will drive the event logistics market.

Major Market Trends & Insights

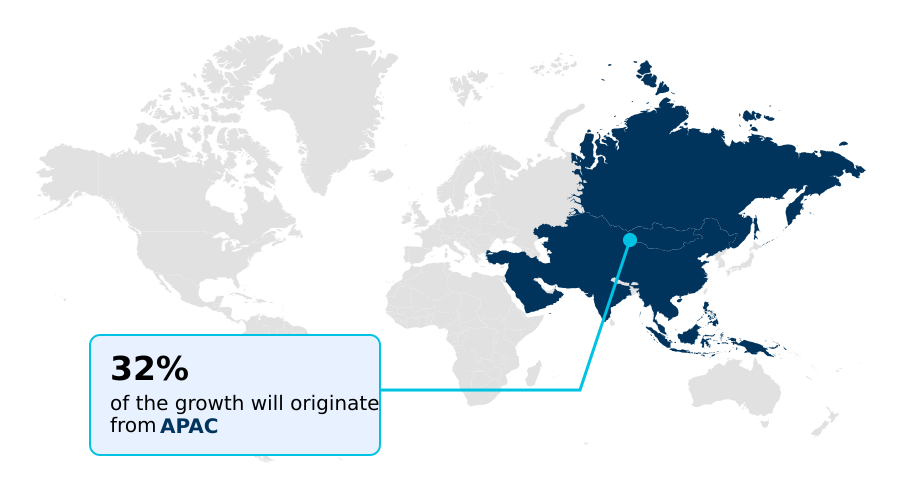
  • APAC dominated the market and accounted for a 32.2% growth during the forecast period.
  • By Event Type - Entertainment events segment was valued at USD 1.85 billion in 2024
  • By End-user - Corporates and enterprises segment accounted for the largest market revenue share in 2024

Market Size & Forecast

  • Market Opportunities: USD 2.29 billion
  • Market Future Opportunities: USD 1.62 billion
  • CAGR from 2025 to 2030 : 6%

Market Summary

  • The event logistics market is defined by the comprehensive planning and execution required to manage the physical flow of goods for temporary gatherings, from corporate conferences to global sports tournaments. Growth is driven by the increasing frequency of international trade shows and entertainment events, demanding precise logistical coordination of everything from audiovisual equipment to large-scale staging.
  • A key trend is the adoption of technology, such as IoT sensors and real-time tracking, to provide supply chain visibility. For example, a firm managing a multi-city concert tour can use predictive analytics and data-driven logistics to optimize routing and anticipate customs delays, ensuring on-time delivery and setup.
  • However, the industry faces challenges like high operational costs, the need for sustainable logistics, and the complexity of managing last-minute schedule changes. Success hinges on delivering flexible, reliable services, including specialized handling and on-site project management, that mitigate risk and ensure a seamless experience.

What will be the Size of the Event Logistics Market during the forecast period?

Get Key Insights on Market Forecast (PDF) Request Free Sample

How is the Event Logistics Market Segmented?

The event logistics industry research report provides comprehensive data (region-wise segment analysis), with forecasts and estimates in "USD million" for the period 2026-2030, as well as historical data from 2020-2024 for the following segments.

  • Event type
    • Entertainment events
    • Sports events
    • Trade fairs and expos
    • Corporate events
    • Others
  • End-user
    • Corporates and enterprises
    • Entertainment companies
    • Government and public sector
    • Sports organizations
    • Others
  • Service type
    • Transportation and freight
    • On-site setup and handling
    • Warehousing and storage
    • Customs and compliance
    • Others
  • Geography
    • APAC
      • China
      • Japan
      • India
    • North America
      • US
      • Canada
      • Mexico
    • Europe
      • Germany
      • UK
      • France
    • South America
      • Brazil
      • Argentina
    • Middle East and Africa
      • Saudi Arabia
      • UAE
      • South Africa
    • Rest of World (ROW)

By Event Type Insights

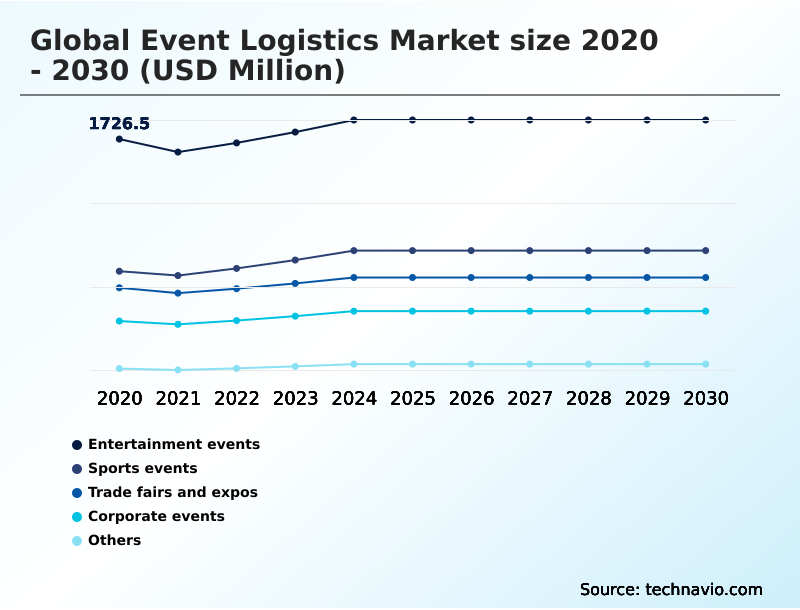
The entertainment events segment is estimated to witness significant growth during the forecast period.

The entertainment events segment is a specialized vertical characterized by high-stakes logistical demands. This sector is propelled by global concert tour logistics and large-scale festivals, which necessitate precise event freight management and multi-modal transport under tight deadlines.

Providers deliver specialized handling, including freight forwarding and on-site handling services, to prevent damage to high-value assets. The operational complexity of trade show shipping and sports event transport is compounded by the need for effective drayage services and customs brokerage.

The adoption of new inventory systems has reduced pre-event kit assembly times by nearly 50%, highlighting the move toward efficiency in warehousing and storage and conference logistics solutions for the sector.

Request Free Sample

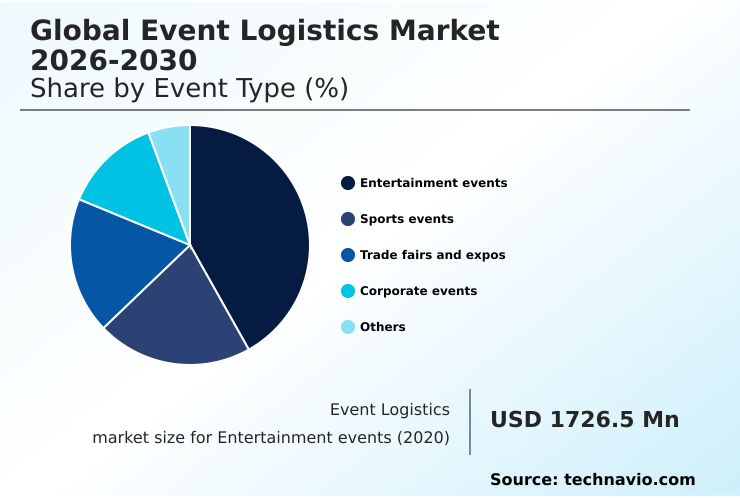
The Entertainment events segment was valued at USD 1.85 billion in 2024 and showed a gradual increase during the forecast period.

Request Free Sample

Regional Analysis

APAC is estimated to contribute 32.2% to the growth of the global market during the forecast period.Technavio’s analysts have elaborately explained the regional trends and drivers that shape the market during the forecast period.

See How Event Logistics Market Demand is Rising in APAC Request Free Sample

The geographic landscape is shaped by regional investments in event infrastructure, contributing to a diverse market. APAC is a significant region, accounting for over 32% of the market's incremental growth, driven by large-scale trade fairs.

In North America, which holds over 27% of the market, the focus is on technology-driven exhibitor services. Providers leverage data-driven logistics and predictive analytics for enhanced venue logistics management.

The adoption of AI-driven inventory systems has cut stock-out incidents by over 40% in major convention hubs. On-site project management is critical for global event shipping, while ATA carnet services are essential for temporary imports.

Modular service packages, 5G-enabled tracking for sensitive equipment shipping, and specialized freight services for time-sensitive freight define the competitive edge in developed markets.

Market Dynamics

Our researchers analyzed the data with 2025 as the base year, along with the key drivers, trends, and challenges. A holistic analysis of drivers will help companies refine their marketing strategies to gain a competitive advantage.

  • Strategic decision-making in the event logistics market increasingly revolves around optimizing complex operational variables. Evaluating the total cost of international trade show logistics goes beyond freight, involving drayage service costs at convention centers and the complexities of managing customs for international exhibitions.
  • For high-stakes projects, such as coordinating logistics for sports tournaments or handling oversized cargo for expos, robust risk management in live event logistics is critical. The choice of a freight forwarder for events is now heavily influenced by their technological capabilities, particularly in providing real-time tracking for event equipment.
  • The demand for specialized services, like temperature-controlled shipping for catering and secure logistics for high-value exhibits, is rising. Firms are adopting best practices for venue load-in/load-out, which can improve turnaround times by over 25% compared to traditional methods.
  • Furthermore, the growth of logistics solutions for hybrid events and project logistics for new product launches highlights a shift toward integrated service models. The selection of event logistics planning software and the move toward automating the warehouse for event materials are key investment areas.
  • Adherence to sustainable logistics in the events industry and providing white-glove handling for art fairs are becoming significant differentiators. This is particularly true for logistics for multi-city concert tours and event logistics for pharmaceutical conferences, where precision is paramount.

What are the key market drivers leading to the rise in the adoption of Event Logistics Industry?
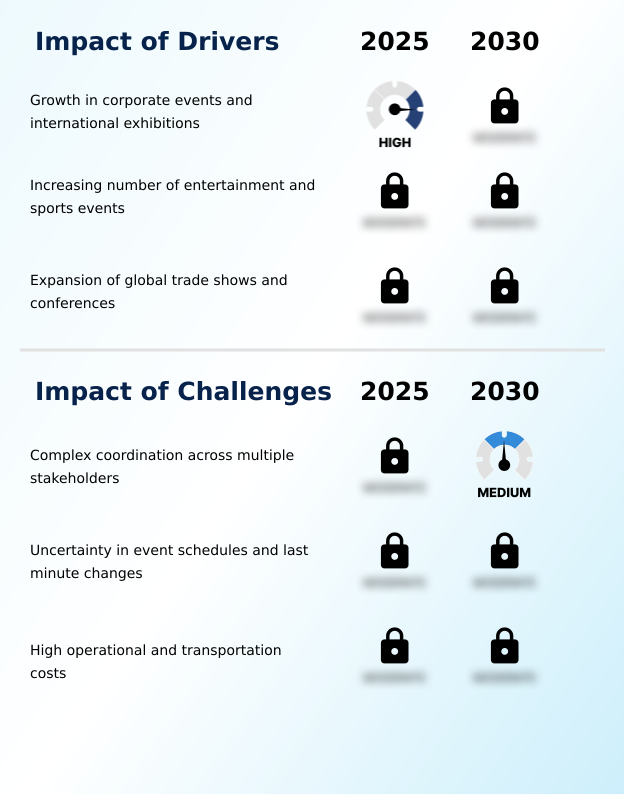
  • The increasing frequency of corporate events and international exhibitions is a primary driver fueling market expansion.

  • The expansion of global trade shows and industry-specific conferences is a significant market driver. Growth in pharmaceutical conference logistics and product launch logistics requires sophisticated supply chain visibility from origin to destination.
  • The rise of touring production logistics for film production transport and fashion week logistics necessitates enhanced route optimization and inventory management to handle high-value, time-sensitive goods.
  • This drive for efficiency is critical for esports tournament logistics, where on-time delivery of technical equipment is paramount.
  • End-to-end exhibition logistics solutions, integrating sustainable logistics practices and reliable last-mile delivery, have demonstrated the ability to reduce carbon footprints by up to 10% per event. Furthermore, the need for temperature-controlled transport for certain event types continues to grow.

What are the market trends shaping the Event Logistics Industry?

  • The adoption of digital and automation tools is a notable trend, driving enhanced operational efficiency. This modernization of traditional logistics processes is transforming the industry landscape.

  • Key trends are reshaping the market, with a focus on customized solutions that improve efficiency. For instance, the adoption of digital platforms has been shown to improve load planning accuracy by over 25%. The demand for white-glove services is increasing, particularly for art exhibition handling and motorsport logistics.
  • Effective project logistics now incorporates advanced rigging services and heavy lift capabilities for complex setups. This is crucial for broadcast equipment transport and live event supply chain management. For international tours, carnet management is essential, while time-critical delivery defines success for festival logistics planning.
  • Effective corporate event coordination relies on these advancements to ensure seamless execution, with some firms reporting a 15% reduction in on-site setup times.

What challenges does the Event Logistics Industry face during its growth?

  • The complex coordination required among multiple stakeholders presents a significant challenge to consistent industry growth.

  • Addressing operational complexity remains a key challenge, demanding superior logistical coordination. The need for secure transport for high-value assets in museum exhibit transport and government summit logistics is non-negotiable. Firms are leveraging digital twin simulation to mitigate risks in heavy machinery transport, improving planning efficiency by up to 30%.
  • However, managing the unique demands of destination wedding logistics or pop-up event logistics requires extreme flexibility. Integrating real-time tracking via IoT sensors is becoming standard for charity event logistics to ensure transparency. While the use of automated guided vehicles streamlines warehouse operations, achieving seamless coordination is difficult.
  • Some are exploring blockchain for logistics to improve data integrity, cutting documentation errors by 20%.

Exclusive Technavio Analysis on Customer Landscape

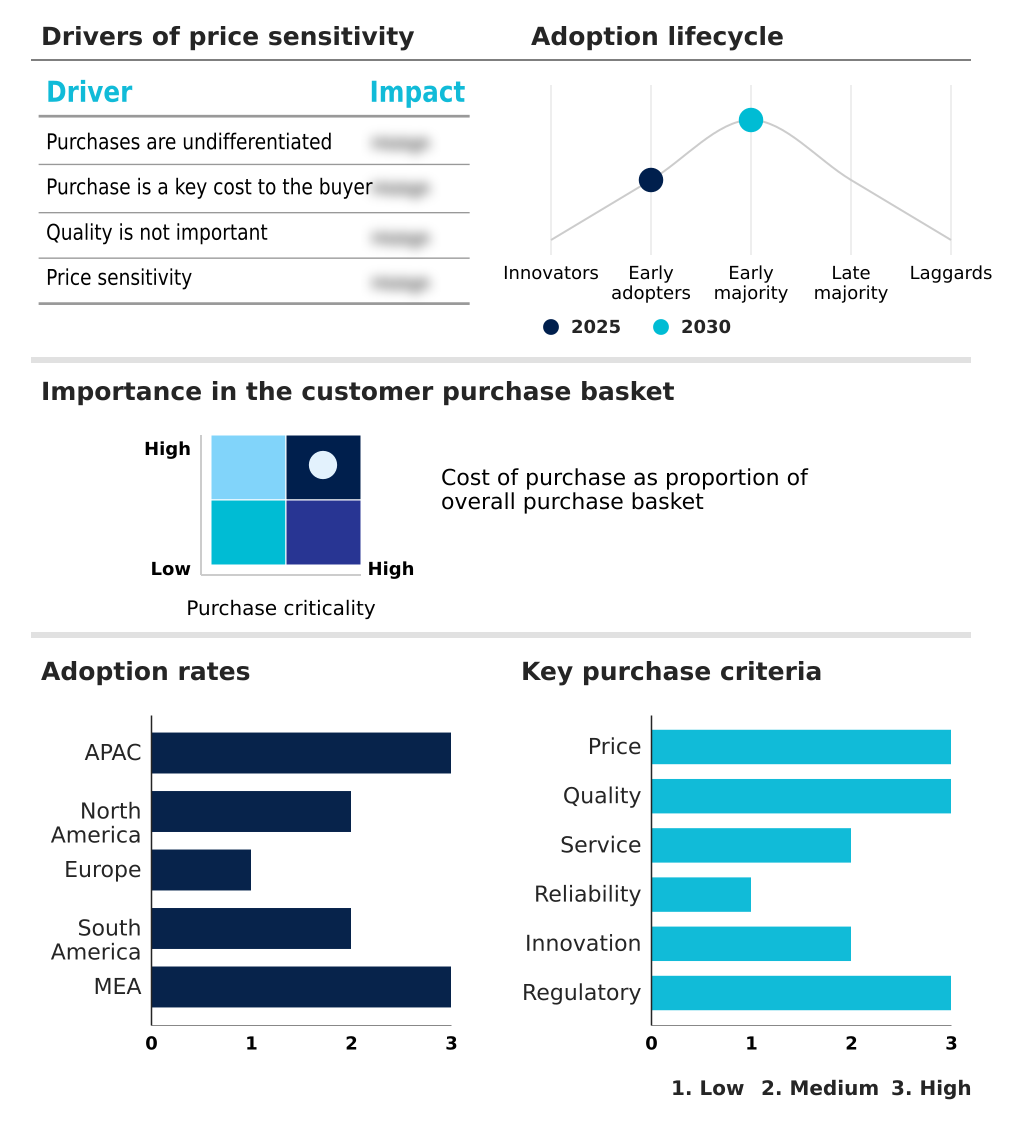
The event logistics market forecasting report includes the adoption lifecycle of the market, covering from the innovator’s stage to the laggard’s stage. It focuses on adoption rates in different regions based on penetration. Furthermore, the event logistics market report also includes key purchase criteria and drivers of price sensitivity to help companies evaluate and develop their market growth analysis strategies.

Customer Landscape of Event Logistics Industry

Competitive Landscape

Companies are implementing various strategies, such as strategic alliances, event logistics market forecast, partnerships, mergers and acquisitions, geographical expansion, and product/service launches, to enhance their presence in the industry.

Agility Global PLC - Delivering specialized project cargo handling and integrated supply chain solutions designed for the complex logistical demands of large-scale global events.

The industry research and growth report includes detailed analyses of the competitive landscape of the market and information about key companies, including:

  • Agility Global PLC
  • Air Charter Service Group Ltd.
  • C H Robinson Worldwide Inc.
  • CEVA Logistics SA
  • DHL International GmbH
  • DSV AS
  • Expeditors International Inc.
  • FedEx Corp.
  • GAC Group
  • GEODIS
  • Hellmann Worldwide Logistics
  • Kuehne Nagel Management AG
  • LoxamHune
  • Nippon Express Holdings Inc.
  • Rhenus SE and Co. KG
  • DB Schenker
  • SOS Global Express
  • The Rock It Co. LLC
  • United Parcel Service Inc.
  • Yusen Logistics Co. Ltd.

Qualitative and quantitative analysis of companies has been conducted to help clients understand the wider business environment as well as the strengths and weaknesses of key industry players. Data is qualitatively analyzed to categorize companies as pure play, category-focused, industry-focused, and diversified; it is quantitatively analyzed to categorize companies as dominant, leading, strong, tentative, and weak.

Recent Development and News in Event logistics market

  • In May 2025, Agility successfully managed a logistical contract for a major cricket tournament, handling over two thousand shipments of equipment and uniforms for ten international teams.
  • In April 2025, FedEx introduced a specialized shipping solution for the medical conference sector, incorporating real-time thermal monitoring for transporting clinical devices to international exhibitions.
  • In February 2025, Kuehne Nagel managed a significant increase in emergency rerouting for its live event division after several major music festivals were rescheduled due to adverse weather.
  • In January 2025, DHL Global Forwarding rolled out a new multi-party digital dashboard to improve communication between venue owners and equipment suppliers during major fashion weeks.

Dive into Technavio’s robust research methodology, blending expert interviews, extensive data synthesis, and validated models for unparalleled Event Logistics Market insights. See full methodology.

Market Scope
Page number 322
Base year 2025
Historic period 2020-2024
Forecast period 2026-2030
Growth momentum & CAGR Accelerate at a CAGR of 6%
Market growth 2026-2030 USD 1616.0 million
Market structure Fragmented
YoY growth 2025-2026(%) 5.7%
Key countries China, Japan, India, South Korea, Australia, Indonesia, US, Canada, Mexico, Germany, UK, France, Italy, Spain, The Netherlands, Brazil, Argentina, Chile, Saudi Arabia, UAE, South Africa, Israel and Turkey
Competitive landscape Leading Companies, Market Positioning of Companies, Competitive Strategies, and Industry Risks

Request Free Sample

Research Analyst Overview

  • The event logistics market is a highly specialized sector centered on providing time-critical delivery and logistical coordination for temporary gatherings. Success is predicated on flawless execution, encompassing everything from freight forwarding and warehousing and storage to complex on-site handling.
  • The integration of technology like real-time tracking through iot sensors and 5g-enabled tracking is no longer a luxury but a necessity for maintaining supply chain visibility. Boardroom decisions are increasingly focused on leveraging these tools for competitive advantage; for instance, adopting ai-driven inventory and digital twin simulation can reduce load planning errors by over 25%.
  • Key service offerings include drayage services, customs brokerage, and carnet management, especially for international exhibition logistics. The demand for specialized handling, including white-glove services, temperature-controlled transport, and rigging services for heavy lift capabilities, is growing. Sustainable logistics and efficient route optimization are also critical considerations.
  • Providers must offer secure transport and master the complexities of multi-modal transport and last-mile delivery, often through modular service packages guided by on-site project management and predictive analytics. The use of automated guided vehicles, blockchain for logistics, and data-driven logistics is pivotal for future growth, especially when managing ata carnet services.

What are the Key Data Covered in this Event Logistics Market Research and Growth Report?

  • What is the expected growth of the Event Logistics Market between 2026 and 2030?

    • USD 1.62 billion, at a CAGR of 6%

  • What segmentation does the market report cover?

    • The report is segmented by Event Type (Entertainment events, Sports events, Trade fairs and expos, Corporate events, and Others), End-user (Corporates and enterprises, Entertainment companies, Government and public sector, Sports organizations, and Others), Service Type (Transportation and freight, On-site setup and handling, Warehousing and storage, Customs and compliance, and Others) and Geography (APAC, North America, Europe, South America, Middle East and Africa)

  • Which regions are analyzed in the report?

    • APAC, North America, Europe, South America and Middle East and Africa

  • What are the key growth drivers and market challenges?

    • Growth in corporate events and international exhibitions, Complex coordination across multiple stakeholders

  • Who are the major players in the Event Logistics Market?

    • Agility Global PLC, Air Charter Service Group Ltd., C H Robinson Worldwide Inc., CEVA Logistics SA, DHL International GmbH, DSV AS, Expeditors International Inc., FedEx Corp., GAC Group, GEODIS, Hellmann Worldwide Logistics, Kuehne Nagel Management AG, LoxamHune, Nippon Express Holdings Inc., Rhenus SE and Co. KG, DB Schenker, SOS Global Express, The Rock It Co. LLC, United Parcel Service Inc. and Yusen Logistics Co. Ltd.

Market Research Insights

  • Market dynamics are increasingly shaped by client demand for customized, high-visibility solutions. Providers of concert tour logistics and trade show shipping are leveraging technology to differentiate their offerings. For instance, the integration of advanced tracking for sports event transport has led to a 99% on-time delivery rate for critical equipment.
  • Similarly, in corporate event coordination and festival logistics planning, the use of centralized digital platforms has reduced communication errors by up to 40%. The demand for specialized knowledge in niches like art exhibition handling and broadcast equipment transport is growing.
  • Firms specializing in live event supply chain management report that clients who adopt integrated conference logistics solutions see a 15% reduction in overall logistics spending. Success now hinges on delivering a seamless experience through superior event freight management and exhibition freight services.

We can help! Our analysts can customize this event logistics market research report to meet your requirements.

Get in touch

1. Executive Summary

1.1 Market overview

Executive Summary - Chart on Market Overview
Executive Summary - Data Table on Market Overview
Executive Summary - Chart on Global Market Characteristics
Executive Summary - Chart on Market by Geography
Executive Summary - Chart on Market Segmentation by Event Type
Executive Summary - Chart on Market Segmentation by End-user
Executive Summary - Chart on Market Segmentation by Service Type
Executive Summary - Chart on Incremental Growth
Executive Summary - Data Table on Incremental Growth
Executive Summary - Chart on Company Market Positioning

2. Technavio Analysis

2.1 Analysis of price sensitivity, lifecycle, customer purchase basket, adoption rates, and purchase criteria

2.2 Criticality of inputs and Factors of differentiation

Chart on Overview on criticality of inputs and factors of differentiation

2.3 Factors of disruption

Chart on Overview on factors of disruption

2.4 Impact of drivers and challenges

Chart on Impact of drivers and challenges in 2025 and 2030

3. Market Landscape

3.1 Market ecosystem

Chart on Parent Market
Data Table on - Parent Market

3.2 Market characteristics

Chart on Market characteristics analysis

3.3 Value chain analysis

Chart on Value chain analysis

4. Market Sizing

4.1 Market definition

Data Table on Offerings of companies included in the market definition

4.2 Market segment analysis

Market segments

4.3 Market size 2025

4.4 Market outlook: Forecast for 2025-2030

Chart on Global - Market size and forecast 2025-2030 ($ million)
Data Table on Global - Market size and forecast 2025-2030 ($ million)
Chart on Global Market: Year-over-year growth 2025-2030 (%)
Data Table on Global Market: Year-over-year growth 2025-2030 (%)

5. Historic Market Size

5.1 Global Event Logistics Market 2020 - 2024

Historic Market Size - Data Table on Global Event Logistics Market 2020 - 2024 ($ million)

5.2 Event Type segment analysis 2020 - 2024

Historic Market Size - Event Type Segment 2020 - 2024 ($ million)

5.3 End-user segment analysis 2020 - 2024

Historic Market Size - End-user Segment 2020 - 2024 ($ million)

5.4 Service Type segment analysis 2020 - 2024

Historic Market Size - Service Type Segment 2020 - 2024 ($ million)

5.5 Geography segment analysis 2020 - 2024

Historic Market Size - Geography Segment 2020 - 2024 ($ million)

5.6 Country segment analysis 2020 - 2024

Historic Market Size - Country Segment 2020 - 2024 ($ million)

6. Qualitative Analysis

6.1 Impact of AI on Global Event Logistics Market

6.2 Impact of Geopolitical Conflicts on Global Event Logistics Market

7. Five Forces Analysis

7.1 Five forces summary

Five forces analysis - Comparison between 2025 and 2030

7.2 Bargaining power of buyers

Bargaining power of buyers - Impact of key factors 2025 and 2030

7.3 Bargaining power of suppliers

Bargaining power of suppliers - Impact of key factors in 2025 and 2030

7.4 Threat of new entrants

Threat of new entrants - Impact of key factors in 2025 and 2030

7.5 Threat of substitutes

Threat of substitutes - Impact of key factors in 2025 and 2030

7.6 Threat of rivalry

Threat of rivalry - Impact of key factors in 2025 and 2030

7.7 Market condition

Chart on Market condition - Five forces 2025 and 2030

8. Market Segmentation by Event Type

8.1 Market segments

Chart on Event Type - Market share 2025-2030 (%)
Data Table on Event Type - Market share 2025-2030 (%)

8.2 Comparison by Event Type

Chart on Comparison by Event Type
Data Table on Comparison by Event Type

8.3 Entertainment events - Market size and forecast 2025-2030

Chart on Entertainment events - Market size and forecast 2025-2030 ($ million)
Data Table on Entertainment events - Market size and forecast 2025-2030 ($ million)
Chart on Entertainment events - Year-over-year growth 2025-2030 (%)
Data Table on Entertainment events - Year-over-year growth 2025-2030 (%)

8.4 Sports events - Market size and forecast 2025-2030

Chart on Sports events - Market size and forecast 2025-2030 ($ million)
Data Table on Sports events - Market size and forecast 2025-2030 ($ million)
Chart on Sports events - Year-over-year growth 2025-2030 (%)
Data Table on Sports events - Year-over-year growth 2025-2030 (%)

8.5 Trade fairs and expos - Market size and forecast 2025-2030

Chart on Trade fairs and expos - Market size and forecast 2025-2030 ($ million)
Data Table on Trade fairs and expos - Market size and forecast 2025-2030 ($ million)
Chart on Trade fairs and expos - Year-over-year growth 2025-2030 (%)
Data Table on Trade fairs and expos - Year-over-year growth 2025-2030 (%)

8.6 Corporate events - Market size and forecast 2025-2030

Chart on Corporate events - Market size and forecast 2025-2030 ($ million)
Data Table on Corporate events - Market size and forecast 2025-2030 ($ million)
Chart on Corporate events - Year-over-year growth 2025-2030 (%)
Data Table on Corporate events - Year-over-year growth 2025-2030 (%)

8.7 Others - Market size and forecast 2025-2030

Chart on Others - Market size and forecast 2025-2030 ($ million)
Data Table on Others - Market size and forecast 2025-2030 ($ million)
Chart on Others - Year-over-year growth 2025-2030 (%)
Data Table on Others - Year-over-year growth 2025-2030 (%)

8.8 Market opportunity by Event Type

Market opportunity by Event Type ($ million)
Data Table on Market opportunity by Event Type ($ million)

9. Market Segmentation by End-user

9.1 Market segments

Chart on End-user - Market share 2025-2030 (%)
Data Table on End-user - Market share 2025-2030 (%)

9.2 Comparison by End-user

Chart on Comparison by End-user
Data Table on Comparison by End-user

9.3 Corporates and enterprises - Market size and forecast 2025-2030

Chart on Corporates and enterprises - Market size and forecast 2025-2030 ($ million)
Data Table on Corporates and enterprises - Market size and forecast 2025-2030 ($ million)
Chart on Corporates and enterprises - Year-over-year growth 2025-2030 (%)
Data Table on Corporates and enterprises - Year-over-year growth 2025-2030 (%)

9.4 Entertainment companies - Market size and forecast 2025-2030

Chart on Entertainment companies - Market size and forecast 2025-2030 ($ million)
Data Table on Entertainment companies - Market size and forecast 2025-2030 ($ million)
Chart on Entertainment companies - Year-over-year growth 2025-2030 (%)
Data Table on Entertainment companies - Year-over-year growth 2025-2030 (%)

9.5 Government and public sector - Market size and forecast 2025-2030

Chart on Government and public sector - Market size and forecast 2025-2030 ($ million)
Data Table on Government and public sector - Market size and forecast 2025-2030 ($ million)
Chart on Government and public sector - Year-over-year growth 2025-2030 (%)
Data Table on Government and public sector - Year-over-year growth 2025-2030 (%)

9.6 Sports organizations - Market size and forecast 2025-2030

Chart on Sports organizations - Market size and forecast 2025-2030 ($ million)
Data Table on Sports organizations - Market size and forecast 2025-2030 ($ million)
Chart on Sports organizations - Year-over-year growth 2025-2030 (%)
Data Table on Sports organizations - Year-over-year growth 2025-2030 (%)

9.7 Others - Market size and forecast 2025-2030

Chart on Others - Market size and forecast 2025-2030 ($ million)
Data Table on Others - Market size and forecast 2025-2030 ($ million)
Chart on Others - Year-over-year growth 2025-2030 (%)
Data Table on Others - Year-over-year growth 2025-2030 (%)

9.8 Market opportunity by End-user

Market opportunity by End-user ($ million)
Data Table on Market opportunity by End-user ($ million)

10. Market Segmentation by Service Type

10.1 Market segments

Chart on Service Type - Market share 2025-2030 (%)
Data Table on Service Type - Market share 2025-2030 (%)

10.2 Comparison by Service Type

Chart on Comparison by Service Type
Data Table on Comparison by Service Type

10.3 Transportation and freight - Market size and forecast 2025-2030

Chart on Transportation and freight - Market size and forecast 2025-2030 ($ million)
Data Table on Transportation and freight - Market size and forecast 2025-2030 ($ million)
Chart on Transportation and freight - Year-over-year growth 2025-2030 (%)
Data Table on Transportation and freight - Year-over-year growth 2025-2030 (%)

10.4 On-site setup and handling - Market size and forecast 2025-2030

Chart on On-site setup and handling - Market size and forecast 2025-2030 ($ million)
Data Table on On-site setup and handling - Market size and forecast 2025-2030 ($ million)
Chart on On-site setup and handling - Year-over-year growth 2025-2030 (%)
Data Table on On-site setup and handling - Year-over-year growth 2025-2030 (%)

10.5 Warehousing and storage - Market size and forecast 2025-2030

Chart on Warehousing and storage - Market size and forecast 2025-2030 ($ million)
Data Table on Warehousing and storage - Market size and forecast 2025-2030 ($ million)
Chart on Warehousing and storage - Year-over-year growth 2025-2030 (%)
Data Table on Warehousing and storage - Year-over-year growth 2025-2030 (%)

10.6 Customs and compliance - Market size and forecast 2025-2030

Chart on Customs and compliance - Market size and forecast 2025-2030 ($ million)
Data Table on Customs and compliance - Market size and forecast 2025-2030 ($ million)
Chart on Customs and compliance - Year-over-year growth 2025-2030 (%)
Data Table on Customs and compliance - Year-over-year growth 2025-2030 (%)

10.7 Others - Market size and forecast 2025-2030

Chart on Others - Market size and forecast 2025-2030 ($ million)
Data Table on Others - Market size and forecast 2025-2030 ($ million)
Chart on Others - Year-over-year growth 2025-2030 (%)
Data Table on Others - Year-over-year growth 2025-2030 (%)

10.8 Market opportunity by Service Type

Market opportunity by Service Type ($ million)
Data Table on Market opportunity by Service Type ($ million)

11. Customer Landscape

11.1 Customer landscape overview

Analysis of price sensitivity, lifecycle, customer purchase basket, adoption rates, and purchase criteria

12. Geographic Landscape

12.1 Geographic segmentation

Chart on Market share by geography 2025-2030 (%)
Data Table on Market share by geography 2025-2030 (%)

12.2 Geographic comparison

Chart on Geographic comparison
Data Table on Geographic comparison

12.3 APAC - Market size and forecast 2025-2030

Chart on APAC - Market size and forecast 2025-2030 ($ million)
Data Table on APAC - Market size and forecast 2025-2030 ($ million)
Chart on APAC - Year-over-year growth 2025-2030 (%)
Data Table on APAC - Year-over-year growth 2025-2030 (%)
Chart on Regional Comparison - APAC
Data Table on Regional Comparison - APAC

12.3.1 China - Market size and forecast 2025-2030

Chart on China - Market size and forecast 2025-2030 ($ million)
Data Table on China - Market size and forecast 2025-2030 ($ million)
Chart on China - Year-over-year growth 2025-2030 (%)
Data Table on China - Year-over-year growth 2025-2030 (%)

12.3.2 Japan - Market size and forecast 2025-2030

Chart on Japan - Market size and forecast 2025-2030 ($ million)
Data Table on Japan - Market size and forecast 2025-2030 ($ million)
Chart on Japan - Year-over-year growth 2025-2030 (%)
Data Table on Japan - Year-over-year growth 2025-2030 (%)

12.3.3 India - Market size and forecast 2025-2030

Chart on India - Market size and forecast 2025-2030 ($ million)
Data Table on India - Market size and forecast 2025-2030 ($ million)
Chart on India - Year-over-year growth 2025-2030 (%)
Data Table on India - Year-over-year growth 2025-2030 (%)

12.3.4 South Korea - Market size and forecast 2025-2030

Chart on South Korea - Market size and forecast 2025-2030 ($ million)
Data Table on South Korea - Market size and forecast 2025-2030 ($ million)
Chart on South Korea - Year-over-year growth 2025-2030 (%)
Data Table on South Korea - Year-over-year growth 2025-2030 (%)

12.3.5 Australia - Market size and forecast 2025-2030

Chart on Australia - Market size and forecast 2025-2030 ($ million)
Data Table on Australia - Market size and forecast 2025-2030 ($ million)
Chart on Australia - Year-over-year growth 2025-2030 (%)
Data Table on Australia - Year-over-year growth 2025-2030 (%)

12.3.6 Indonesia - Market size and forecast 2025-2030

Chart on Indonesia - Market size and forecast 2025-2030 ($ million)
Data Table on Indonesia - Market size and forecast 2025-2030 ($ million)
Chart on Indonesia - Year-over-year growth 2025-2030 (%)
Data Table on Indonesia - Year-over-year growth 2025-2030 (%)

12.4 North America - Market size and forecast 2025-2030

Chart on North America - Market size and forecast 2025-2030 ($ million)
Data Table on North America - Market size and forecast 2025-2030 ($ million)
Chart on North America - Year-over-year growth 2025-2030 (%)
Data Table on North America - Year-over-year growth 2025-2030 (%)
Chart on Regional Comparison - North America
Data Table on Regional Comparison - North America

12.4.1 US - Market size and forecast 2025-2030

Chart on US - Market size and forecast 2025-2030 ($ million)
Data Table on US - Market size and forecast 2025-2030 ($ million)
Chart on US - Year-over-year growth 2025-2030 (%)
Data Table on US - Year-over-year growth 2025-2030 (%)

12.4.2 Canada - Market size and forecast 2025-2030

Chart on Canada - Market size and forecast 2025-2030 ($ million)
Data Table on Canada - Market size and forecast 2025-2030 ($ million)
Chart on Canada - Year-over-year growth 2025-2030 (%)
Data Table on Canada - Year-over-year growth 2025-2030 (%)

12.4.3 Mexico - Market size and forecast 2025-2030

Chart on Mexico - Market size and forecast 2025-2030 ($ million)
Data Table on Mexico - Market size and forecast 2025-2030 ($ million)
Chart on Mexico - Year-over-year growth 2025-2030 (%)
Data Table on Mexico - Year-over-year growth 2025-2030 (%)

12.5 Europe - Market size and forecast 2025-2030

Chart on Europe - Market size and forecast 2025-2030 ($ million)
Data Table on Europe - Market size and forecast 2025-2030 ($ million)
Chart on Europe - Year-over-year growth 2025-2030 (%)
Data Table on Europe - Year-over-year growth 2025-2030 (%)
Chart on Regional Comparison - Europe
Data Table on Regional Comparison - Europe

12.5.1 Germany - Market size and forecast 2025-2030

Chart on Germany - Market size and forecast 2025-2030 ($ million)
Data Table on Germany - Market size and forecast 2025-2030 ($ million)
Chart on Germany - Year-over-year growth 2025-2030 (%)
Data Table on Germany - Year-over-year growth 2025-2030 (%)

12.5.2 UK - Market size and forecast 2025-2030

Chart on UK - Market size and forecast 2025-2030 ($ million)
Data Table on UK - Market size and forecast 2025-2030 ($ million)
Chart on UK - Year-over-year growth 2025-2030 (%)
Data Table on UK - Year-over-year growth 2025-2030 (%)

12.5.3 France - Market size and forecast 2025-2030

Chart on France - Market size and forecast 2025-2030 ($ million)
Data Table on France - Market size and forecast 2025-2030 ($ million)
Chart on France - Year-over-year growth 2025-2030 (%)
Data Table on France - Year-over-year growth 2025-2030 (%)

12.5.4 Italy - Market size and forecast 2025-2030

Chart on Italy - Market size and forecast 2025-2030 ($ million)
Data Table on Italy - Market size and forecast 2025-2030 ($ million)
Chart on Italy - Year-over-year growth 2025-2030 (%)
Data Table on Italy - Year-over-year growth 2025-2030 (%)

12.5.5 Spain - Market size and forecast 2025-2030

Chart on Spain - Market size and forecast 2025-2030 ($ million)
Data Table on Spain - Market size and forecast 2025-2030 ($ million)
Chart on Spain - Year-over-year growth 2025-2030 (%)
Data Table on Spain - Year-over-year growth 2025-2030 (%)

12.5.6 The Netherlands - Market size and forecast 2025-2030

Chart on The Netherlands - Market size and forecast 2025-2030 ($ million)
Data Table on The Netherlands - Market size and forecast 2025-2030 ($ million)
Chart on The Netherlands - Year-over-year growth 2025-2030 (%)
Data Table on The Netherlands - Year-over-year growth 2025-2030 (%)

12.6 South America - Market size and forecast 2025-2030

Chart on South America - Market size and forecast 2025-2030 ($ million)
Data Table on South America - Market size and forecast 2025-2030 ($ million)
Chart on South America - Year-over-year growth 2025-2030 (%)
Data Table on South America - Year-over-year growth 2025-2030 (%)
Chart on Regional Comparison - South America
Data Table on Regional Comparison - South America

12.6.1 Brazil - Market size and forecast 2025-2030

Chart on Brazil - Market size and forecast 2025-2030 ($ million)
Data Table on Brazil - Market size and forecast 2025-2030 ($ million)
Chart on Brazil - Year-over-year growth 2025-2030 (%)
Data Table on Brazil - Year-over-year growth 2025-2030 (%)

12.6.2 Argentina - Market size and forecast 2025-2030

Chart on Argentina - Market size and forecast 2025-2030 ($ million)
Data Table on Argentina - Market size and forecast 2025-2030 ($ million)
Chart on Argentina - Year-over-year growth 2025-2030 (%)
Data Table on Argentina - Year-over-year growth 2025-2030 (%)

12.6.3 Chile - Market size and forecast 2025-2030

Chart on Chile - Market size and forecast 2025-2030 ($ million)
Data Table on Chile - Market size and forecast 2025-2030 ($ million)
Chart on Chile - Year-over-year growth 2025-2030 (%)
Data Table on Chile - Year-over-year growth 2025-2030 (%)

12.7 Middle East and Africa - Market size and forecast 2025-2030

Chart on Middle East and Africa - Market size and forecast 2025-2030 ($ million)
Data Table on Middle East and Africa - Market size and forecast 2025-2030 ($ million)
Chart on Middle East and Africa - Year-over-year growth 2025-2030 (%)
Data Table on Middle East and Africa - Year-over-year growth 2025-2030 (%)
Chart on Regional Comparison - Middle East and Africa
Data Table on Regional Comparison - Middle East and Africa

12.7.1 Saudi Arabia - Market size and forecast 2025-2030

Chart on Saudi Arabia - Market size and forecast 2025-2030 ($ million)
Data Table on Saudi Arabia - Market size and forecast 2025-2030 ($ million)
Chart on Saudi Arabia - Year-over-year growth 2025-2030 (%)
Data Table on Saudi Arabia - Year-over-year growth 2025-2030 (%)

12.7.2 UAE - Market size and forecast 2025-2030

Chart on UAE - Market size and forecast 2025-2030 ($ million)
Data Table on UAE - Market size and forecast 2025-2030 ($ million)
Chart on UAE - Year-over-year growth 2025-2030 (%)
Data Table on UAE - Year-over-year growth 2025-2030 (%)

12.7.3 South Africa - Market size and forecast 2025-2030

Chart on South Africa - Market size and forecast 2025-2030 ($ million)
Data Table on South Africa - Market size and forecast 2025-2030 ($ million)
Chart on South Africa - Year-over-year growth 2025-2030 (%)
Data Table on South Africa - Year-over-year growth 2025-2030 (%)

12.7.4 Israel - Market size and forecast 2025-2030

Chart on Israel - Market size and forecast 2025-2030 ($ million)
Data Table on Israel - Market size and forecast 2025-2030 ($ million)
Chart on Israel - Year-over-year growth 2025-2030 (%)
Data Table on Israel - Year-over-year growth 2025-2030 (%)

12.7.5 Turkey - Market size and forecast 2025-2030

Chart on Turkey - Market size and forecast 2025-2030 ($ million)
Data Table on Turkey - Market size and forecast 2025-2030 ($ million)
Chart on Turkey - Year-over-year growth 2025-2030 (%)
Data Table on Turkey - Year-over-year growth 2025-2030 (%)

12.8 Market opportunity by geography

Market opportunity by geography ($ million)
Data Tables on Market opportunity by geography ($ million)

13. Drivers, Challenges, and Opportunity

13.1 Market drivers

Growth in corporate events and international exhibitions
Increasing number of entertainment and sports events
Expansion of global trade shows and conferences

13.2 Market challenges

Complex coordination across multiple stakeholders
Uncertainty in event schedules and last minute changes
High operational and transportation costs

13.3 Impact of drivers and challenges

Impact of drivers and challenges in 2025 and 2030

13.4 Market opportunities

Adoption of digital and automation tools
Integration of real time tracking and analytics
Focus on customized and flexible logistics solutions

14. Competitive Landscape

14.1 Overview

14.2

Overview on criticality of inputs and factors of differentiation

14.3 Landscape disruption

Overview on factors of disruption

14.4 Industry risks

Impact of key risks on business

15. Competitive Analysis

15.1 Companies profiled

Companies covered

15.2 Company ranking index

15.3 Market positioning of companies

Matrix on companies position and classification

15.4 Agility Global PLC

Agility Global PLC - Overview
Agility Global PLC - Business segments
Agility Global PLC - Key offerings
Agility Global PLC - Segment focus
SWOT

15.5 C H Robinson Worldwide Inc.

C H Robinson Worldwide Inc. - Overview
C H Robinson Worldwide Inc. - Business segments
C H Robinson Worldwide Inc. - Key offerings
C H Robinson Worldwide Inc. - Segment focus
SWOT

15.6 CEVA Logistics SA

CEVA Logistics SA - Overview
CEVA Logistics SA - Product / Service
CEVA Logistics SA - Key offerings
SWOT

15.7 DHL International GmbH

DHL International GmbH - Overview
DHL International GmbH - Business segments
DHL International GmbH - Key news
DHL International GmbH - Key offerings
DHL International GmbH - Segment focus
SWOT

15.8 DSV AS

DSV AS - Overview
DSV AS - Business segments
DSV AS - Key offerings
DSV AS - Segment focus
SWOT

15.9 Expeditors International Inc.

Expeditors International Inc. - Overview
Expeditors International Inc. - Business segments
Expeditors International Inc. - Key offerings
Expeditors International Inc. - Segment focus
SWOT

15.10 FedEx Corp.

FedEx Corp. - Overview
FedEx Corp. - Business segments
FedEx Corp. - Key offerings
FedEx Corp. - Segment focus
SWOT

15.11 GEODIS

GEODIS - Overview
GEODIS - Product / Service
GEODIS - Key offerings
SWOT

15.12 Hellmann Worldwide Logistics

Hellmann Worldwide Logistics - Overview
Hellmann Worldwide Logistics - Product / Service
Hellmann Worldwide Logistics - Key offerings
SWOT

15.13 Kuehne Nagel Management AG

Kuehne Nagel Management AG - Overview
Kuehne Nagel Management AG - Business segments
Kuehne Nagel Management AG - Key news
Kuehne Nagel Management AG - Key offerings
Kuehne Nagel Management AG - Segment focus
SWOT

15.14 Nippon Express Holdings Inc.

Nippon Express Holdings Inc. - Overview
Nippon Express Holdings Inc. - Business segments
Nippon Express Holdings Inc. - Key offerings
Nippon Express Holdings Inc. - Segment focus
SWOT

15.15 Rhenus SE and Co. KG

Rhenus SE and Co. KG - Overview
Rhenus SE and Co. KG - Product / Service
Rhenus SE and Co. KG - Key offerings
SWOT

15.16 DB Schenker

DB Schenker - Overview
DB Schenker - Product / Service
DB Schenker - Key offerings
SWOT

15.17 United Parcel Service Inc.

United Parcel Service Inc. - Overview
United Parcel Service Inc. - Business segments
United Parcel Service Inc. - Key news
United Parcel Service Inc. - Key offerings
United Parcel Service Inc. - Segment focus
SWOT

15.18 Yusen Logistics Co. Ltd.

Yusen Logistics Co. Ltd. - Overview
Yusen Logistics Co. Ltd. - Product / Service
Yusen Logistics Co. Ltd. - Key offerings
SWOT

16. Appendix

16.1 Scope of the report

Market definition
Objectives
Notes and caveats

16.2 Inclusions and exclusions checklist

Inclusions checklist
Exclusions checklist

16.3 Currency conversion rates for US$

16.4 Research methodology

16.5 Data procurement

Information sources

16.6 Data validation

16.7 Validation techniques employed for market sizing

16.8 Data synthesis

16.9 360 degree market analysis

16.10 List of abbreviations

Research Methodology

Technavio presents a detailed picture of the market by way of study, synthesis, and summation of data from multiple sources. The analysts have presented the various facets of the market with a particular focus on identifying the key industry influencers. The data thus presented is comprehensive, reliable, and the result of extensive research, both primary and secondary.

INFORMATION SOURCES

Primary sources

  • Manufacturers and suppliers
  • Channel partners
  • Industry experts
  • Strategic decision makers

Secondary sources

  • Industry journals and periodicals
  • Government data
  • Financial reports of key industry players
  • Historical data
  • Press releases

DATA ANALYSIS

Data Synthesis

  • Collation of data
  • Estimation of key figures
  • Analysis of derived insights

Data Validation

  • Triangulation with data models
  • Reference against proprietary databases
  • Corroboration with industry experts

REPORT WRITING

Qualitative

  • Market drivers
  • Market challenges
  • Market trends
  • Five forces analysis

Quantitative

  • Market size and forecast
  • Market segmentation
  • Geographical insights
  • Competitive landscape

Interested in this report?

Get your sample now to see our research methodology and insights!

Download Now

Frequently Asked Questions

Event Logistics market growth will increase by USD 1616.0 million during 2026-2030.

The Event Logistics market is expected to grow at a CAGR of 6% during 2026-2030.

Event Logistics market is segmented by Event type (Entertainment events, Sports events, Trade fairs and expos, Corporate events, Others) End-user (Corporates and enterprises, Entertainment companies, Government and public sector, Sports organizations, Others) Service type (Transportation and freight, On-site setup and handling, Warehousing and storage, Customs and compliance, Others)

Agility Global PLC, Air Charter Service Group Ltd., C H Robinson Worldwide Inc., CEVA Logistics SA, DHL International GmbH, DSV AS, Expeditors International Inc., FedEx Corp., GAC Group, GEODIS, Hellmann Worldwide Logistics, Kuehne Nagel Management AG, LoxamHune, Nippon Express Holdings Inc., Rhenus SE and Co. KG, DB Schenker, SOS Global Express, The Rock It Co. LLC, United Parcel Service Inc., Yusen Logistics Co. Ltd. are a few of the key vendors in the Event Logistics market.

APAC will register the highest growth rate of 32.2% among the other regions. Therefore, the Event Logistics market in APAC is expected to garner significant business opportunities for the vendors during the forecast period.

China, Japan, India, South Korea, Australia, Indonesia, US, Canada, Mexico, Germany, UK, France, Italy, Spain, The Netherlands, Brazil, Argentina, Chile, Saudi Arabia, UAE, South Africa, Israel, Turkey

  • Growth in corporate events and international exhibitions is the driving factor this market.

The Event Logistics market vendors should focus on grabbing business opportunities from the Event type segment as it accounted for the largest market share in the base year.
RIA - Research AI Assistant
Ask RIA