Food Service Market Analysis, Size, and Forecast 2026-2030: APAC (China, Japan, and India), North America (US, Canada, and Mexico), Europe (France, UK, and Germany), South America (Brazil and Argentina), Middle East and Africa (Saudi Arabia, Turkey, and UAE), and Rest of World (ROW)

Food Service Market Analysis, Size, and Forecast 2026-2030:
APAC (China, Japan, and India), North America (US, Canada, and Mexico), Europe (France, UK, and Germany), South America (Brazil and Argentina), Middle East and Africa (Saudi Arabia, Turkey, and UAE), and Rest of World (ROW)

Published: May 2026 309 Pages SKU: IRTNTR40123

Market Overview at a Glance

$5581.4 B
Market Opportunity
7.9%
CAGR 2025 - 2030
50.1%
APAC Growth
$2783.3 B
Conventional segment 2024

Food Service Market Size 2026-2030

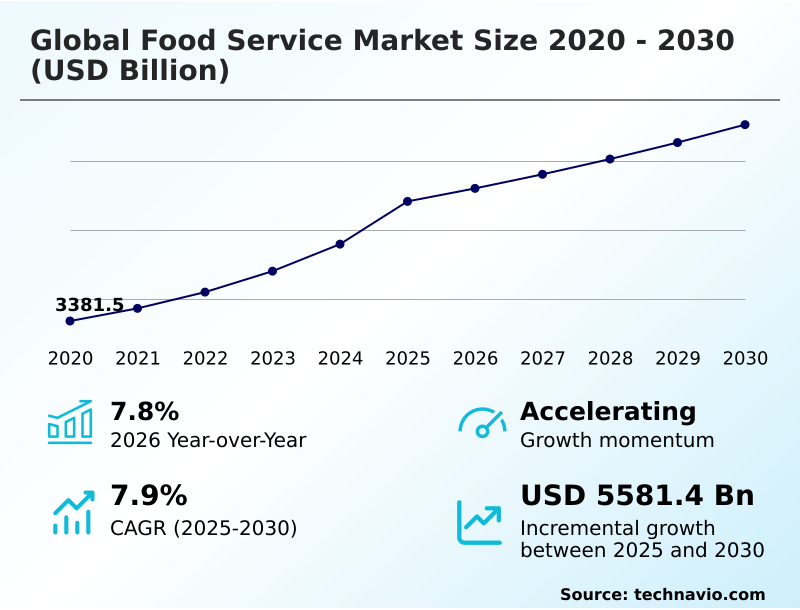
The Food Service Market size was valued at USD 12080.7 billion in 2025, growing at a CAGR of 7.9% during the forecast period 2026-2030.

Major Market Trends & Insights

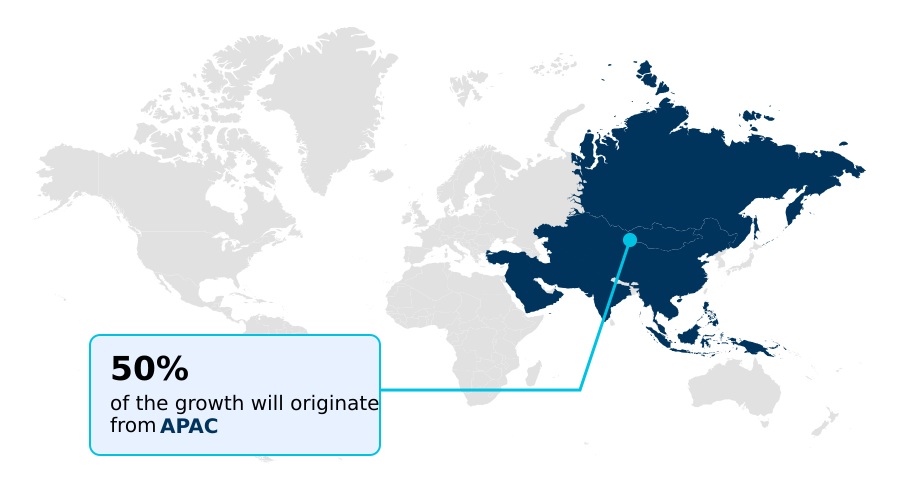
  • APAC dominated the market and accounted for a 50.1% growth during the forecast period.
  • By Service - Conventional segment was valued at USD 2783.3 billion in 2024
  • By Sector - Commercial segment accounted for the largest market revenue share in 2024

Market Size & Forecast

  • Historic Market Opportunities 2020-2024: USD 14280.6 billion
  • Market Future Opportunities 2025-2030: USD 5581.4 billion
  • CAGR from 2025 to 2030 : 7.9%

Market Summary

  • The food service market is defined by a strategic pivot towards operational efficiency, where the integration of kitchen management systems has shown to improve order accuracy by over 25%. In parallel, the adoption of contactless payment systems has accelerated, with transaction speeds increasing by 40% compared to traditional methods.
  • A primary driver for this evolution is the ongoing digital transformation, which enables a data-driven approach to understanding consumer behavior and personalizing the omnichannel experience. For instance, a restaurant chain can analyze purchasing patterns from its loyalty programs to optimize menu engineering and reduce food waste.
  • However, the industry grapples with the persistent challenge of chronic supply chain disruption and commodity price volatility. This forces operators to build greater supply chain resilience through supplier diversification and advanced inventory management software to mitigate the impact on food cost percentages and maintain profitability.

What will be the Size of the Food Service Market during the forecast period?

Get Key Insights on Market Forecast (PDF) Request Free Sample

How is the Food Service Market Segmented?

The food service industry research report provides comprehensive data (region-wise segment analysis), with forecasts and analysis for the period 2026-2030, as well as historical data from 2020-2024 for the following segments.
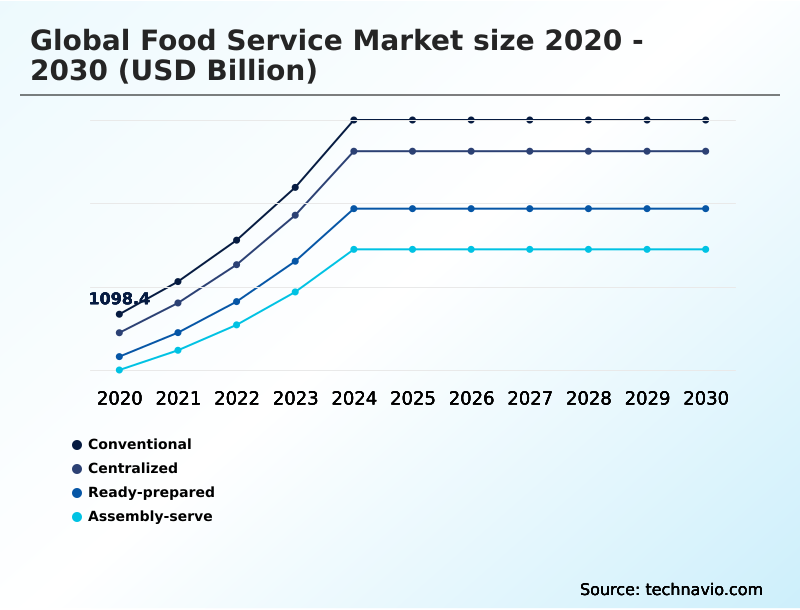
  • Service
    • Conventional
    • Centralized
    • Ready-prepared
    • Assembly-serve
  • Sector
    • Commercial
    • Non-commercial
  • Type
    • Full service restaurants
    • Quick service restaurants
    • Institutes
    • Others
  • Geography
    • APAC
      • China
      • Japan
      • India
    • North America
      • US
      • Canada
      • Mexico
    • Europe
      • France
      • UK
      • Germany
    • South America
      • Brazil
      • Argentina
    • Middle East and Africa
      • Saudi Arabia
      • Turkey
      • UAE
    • Rest of World (ROW)

How is the Food Service Market Segmented by Service?

The conventional segment is estimated to witness significant growth during the forecast period.

The conventional service segment, where food production and service occur at the same facility, saw on-site food preparation errors decrease by 15% with the adoption of simplified menu engineering.

This model, which emphasizes made-to-order freshness, faces challenges in operational efficiency, particularly during peak hours, where labor costs are 20% higher than in centralized models.

It relies heavily on skilled culinary staff for both front-of-house and back-of-house automation, making it ideal for fine dining and full-service restaurants where customization and culinary innovation are key differentiators. The commercial segment is a key user of this model.

Request Free Sample

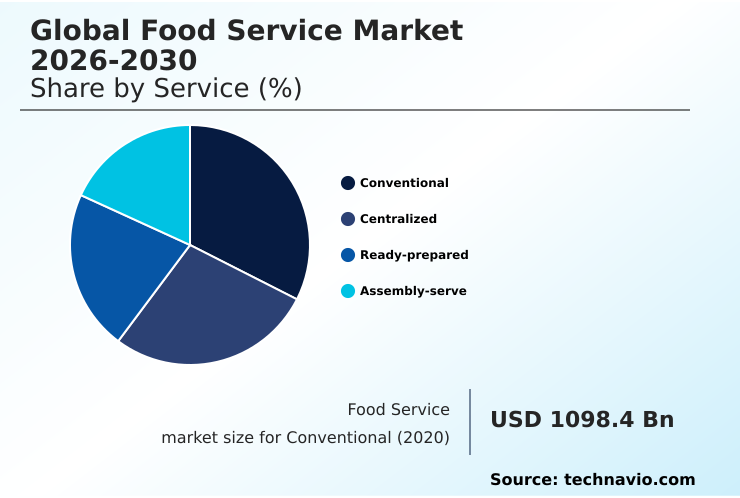
The Conventional segment was valued at USD 2783.3 billion in 2024 and showed a gradual increase during the forecast period.

Request Free Sample

How demand for the Food Service market is rising in the leading region?

APAC is estimated to contribute 50.1% to the growth of the global market during the forecast period.Technavio’s analysts have elaborately explained the regional trends and drivers that shape the market during the forecast period.

See How Food Service Market demand is rising in APAC Request Free Sample

The global food service market exhibits significant regional disparity, with APAC poised to contribute approximately 50% of the market's incremental growth, a figure more than double that of North America's projected 20.7%.

This rapid expansion is led by countries like China, where the market size is forecast to be substantially larger than in Japan, driven by a massive consumer base and rapid urbanization.

In contrast, the mature North America market, led by the US, focuses on operational efficiency and technology adoption, such as front-of-house automation, to manage high labor costs.

This regional divergence in consumer behavior and market maturity necessitates distinct strategies for customer acquisition and supply chain management.

For instance, the demand for food to go is expanding faster in APAC's urban centers, influencing restaurant design and investment in digital storefronts and third-party delivery aggregators.

What are the key Drivers, Trends, and Challenges in the Food Service Market?

Our researchers analyzed the data with 2025 as the base year, along with the key drivers, trends, and challenges. A holistic analysis of drivers will help companies refine their marketing strategies to gain a competitive advantage.

  • Understanding what is contract foodservice management has become crucial for institutions looking to streamline operations, as outsourcing can reduce food service-related capital expenditures by up to 30% compared to in-house management.
  • Simultaneously, operators are exploring the benefits of virtual kitchens for restaurants, which offer a low-cost entry point into new markets with operating overheads that are often 40% lower than traditional brick-and-mortar locations.
  • The operational shift is supported by technology, with inquiries into how food traceability platforms work becoming more common as businesses aim to enhance food safety and build consumer trust. This focus on backend systems underscores the importance of supply chain resilience in food service, a factor that has become as critical as menu innovation.
  • The strategic discussions around the impact of off-premises dining on restaurant design are reshaping physical layouts to optimize workflows for a business model where delivery and takeaway now represent a significant and growing revenue stream.

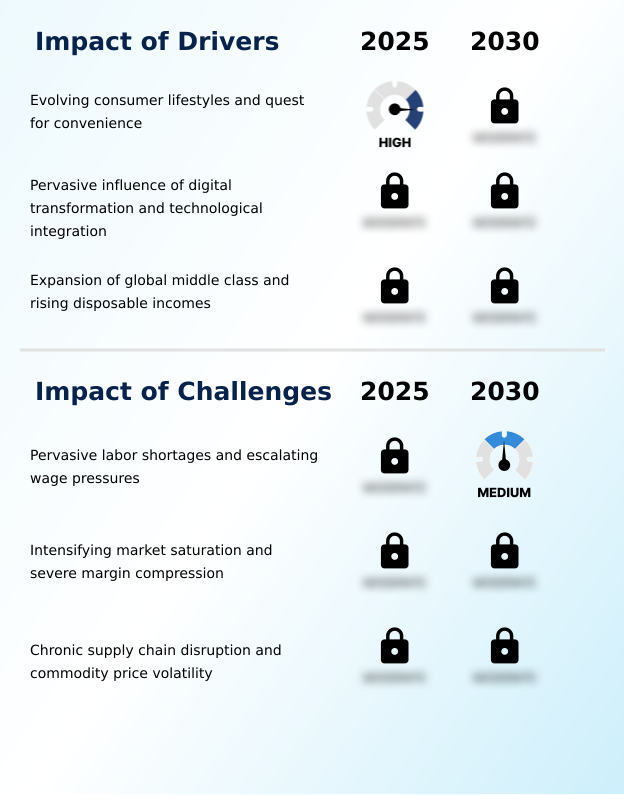
What are the key market drivers leading to the rise in the adoption of Food Service Industry?

  • Evolving consumer lifestyles and the corresponding quest for convenience serve as a fundamental driver propelling market expansion.

  • The pervasive influence of digital transformation is a primary driver, with the adoption of an omnichannel experience leading to a 25% increase in customer retention for early adopters.
  • The integration of self-service kiosks and digital menu boards in quick service restaurants has reduced order times by an average of 30%, directly enhancing operational efficiency.
  • This data-driven approach allows for hyper-personalization through loyalty programs and customer relationship management, shaping everything from menu engineering to customer acquisition strategies.
  • The expansion of third-party delivery aggregators has further fueled this growth, creating new revenue streams and expanding the market for meal solutions and casual dining beyond physical locations.
  • This technological integration is critical for managing food cost percentages and optimizing profitability.

What are the market trends shaping the Food Service Industry?

  • The ascendancy of health, wellness, and sustainability represents a fundamental shift in consumer consciousness, establishing them as core value propositions within the industry.

  • A defining trend in the food service market is the structural shift toward off-premises dining, a segment that has seen a 40% increase in volume in some urban markets, fundamentally altering operational models.
  • This pivot is enabled by the adoption of virtual kitchens and ghost kitchen operations, which reduce real estate costs by up to 60% compared to traditional dining establishments. This business model relies heavily on a sophisticated technology stack, including digital storefronts and efficient supply chain management.
  • Consequently, operators are investing heavily in sustainable food packaging and plant-based menu options to differentiate their brand identity in a crowded digital marketplace. The focus on prepared food and ready-to-eat meals delivered directly to consumers underscores a permanent change in consumer behavior.

What challenges does the Food Service Industry face during its growth?

  • Pervasive labor shortages and escalating wage pressures present a systemic challenge that significantly impacts the industry's financial and operational stability.

  • Pervasive labor shortages are a critical challenge, with turnover rates in some segments exceeding 100% annually, leading to a 15% increase in training and recruitment costs. This instability is compounded by escalating wage pressures that directly compress profit margins, a significant issue in an industry where food cost percentages are already high.
  • Operators are responding by accelerating investments in front-of-house automation and back-of-house automation to mitigate labor dependency, though the initial capital outlay can be substantial. Furthermore, chronic supply chain disruption and commodity price volatility add another layer of complexity, making inventory management software and flexible menu planning essential tools for survival.
  • The reliance on a strained workforce directly impacts service quality and the ability to provide a consistent dining out experience.

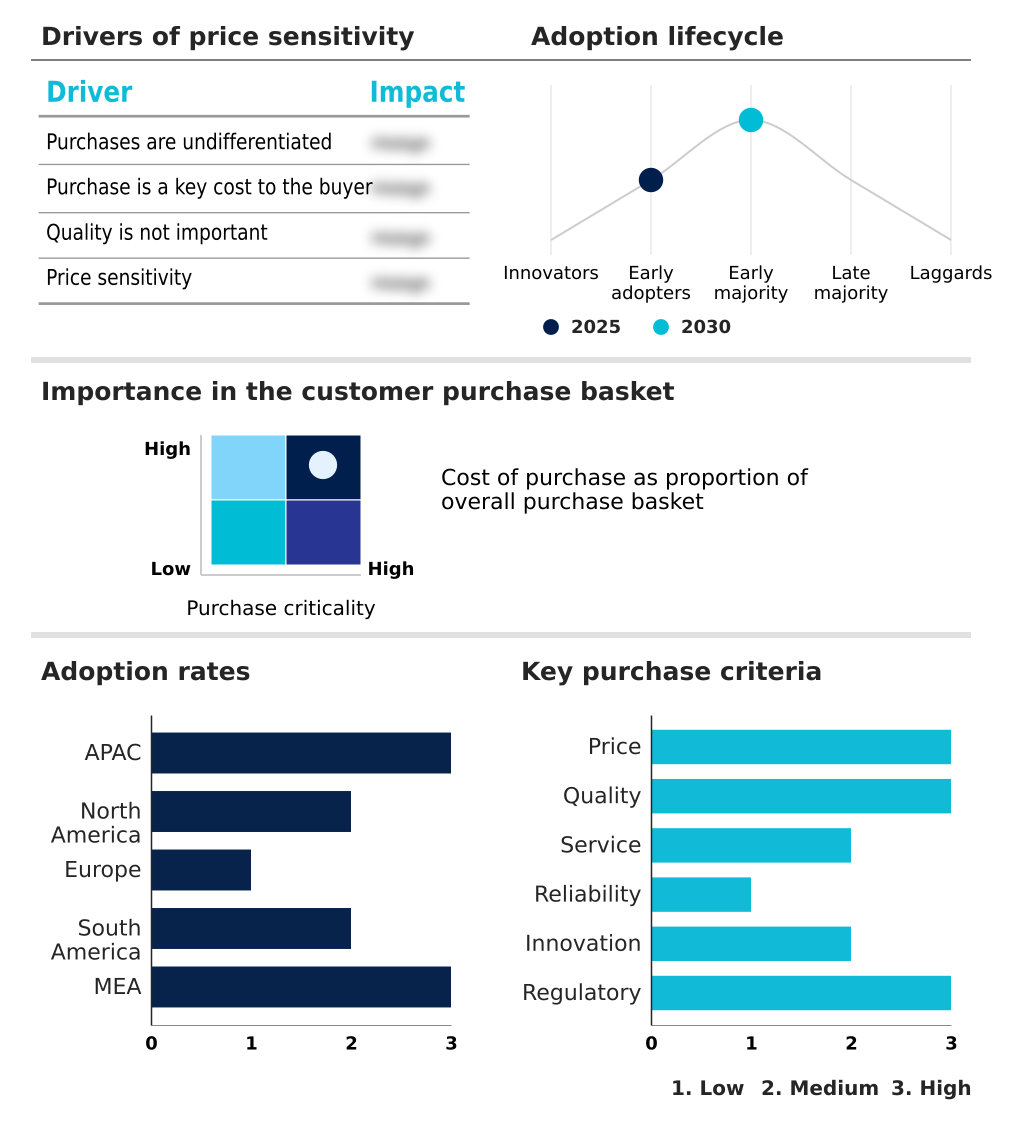
Exclusive Technavio Analysis on Customer Landscape

The food service market forecasting report includes the adoption lifecycle of the market, covering from the innovator’s stage to the laggard’s stage. It focuses on adoption rates in different regions based on penetration. Furthermore, the food service market report also includes key purchase criteria and drivers of price sensitivity to help companies evaluate and develop their market growth analysis strategies.

Customer Landscape of Food Service Industry

Competitive Landscape

Companies are implementing various strategies, such as strategic alliances, food service market forecast, partnerships, mergers and acquisitions, geographical expansion, and product/service launches, to enhance their presence in the industry.

Abela and Co. LLC - The market features diverse solutions, including contract foodservice management, quick-service restaurant operations, and specialized institutional catering, addressing both commercial and non-commercial sector needs.

The industry research and growth report includes detailed analyses of the competitive landscape of the market and information about key companies, including:

  • Abela and Co. LLC
  • Aramark
  • Compass Group Plc
  • Costa Coffee
  • Delaware North Companies Inc.
  • Dominos Pizza Inc.
  • Eurest USA
  • Honeybee Foods Corp.
  • Maschio Food Services Inc.
  • McDonald Corp.
  • MOS Food Services Inc.
  • Papa Johns International Inc.
  • Performance Food Group Co.
  • Restaurant Brands Inc.
  • SGS SA
  • Sodexo SA
  • Starbucks Corp.
  • Sysco Corp.
  • The Wendys Co.
  • Tim Hortons USA Inc.

Qualitative and quantitative analysis of companies has been conducted to help clients understand the wider business environment as well as the strengths and weaknesses of key industry players. Data is qualitatively analyzed to categorize companies as pure play, category-focused, industry-focused, and diversified; it is quantitatively analyzed to categorize companies as dominant, leading, strong, tentative, and weak.

Market Intelligence Radar: High-Impact Developments & Growth Signals

  • In the hotels, resorts and cruise lines industry, the widespread adoption of AI-powered smart room technology, enabling voice-controlled amenities, has created new opportunities for integrated in-room food service ordering, impacting menu engineering and delivery logistics.
  • The increasing consumer interest in cruise travel as a primary vacation choice has spurred demand for diverse and high-quality onboard dining options, driving growth for contract foodservice management providers specializing in maritime hospitality.
  • A growing number of quick service restaurants being established within resort properties and travel hubs is expanding the footprint of casual dining options, directly influencing consumer dining out habits during leisure travel.
  • The rise in online travel agencies and digital booking platforms has led to hotels and resorts bundling accommodation with dining packages and loyalty programs, requiring sophisticated customer relationship management to personalize food service offers.

Dive into Technavio’s robust research methodology, blending expert interviews, extensive data synthesis, and validated models for unparalleled Food Service Market insights. See full methodology.

Market Scope
Page number 309
Base year 2025
Historic period 2020-2024
Forecast period 2026-2030
Growth momentum & CAGR Accelerate at a CAGR of 7.9%
Market growth 2026-2030 USD 5581.4 billion
Market structure Fragmented
YoY growth 2025-2026(%) 7.8%
Key countries China, Japan, India, South Korea, Australia, Indonesia, US, Canada, Mexico, France, UK, Germany, Italy, Spain, The Netherlands, Brazil, Argentina, Chile, Saudi Arabia, Turkey, UAE, South Africa and Egypt
Competitive landscape Leading Companies, Market Positioning of Companies, Competitive Strategies, and Industry Risks

Request Free Sample

Research Analyst Overview

  • The food service market ecosystem is a complex network where raw material suppliers provide commodities to centralized production units, which achieve up to 35% cost savings through economies of scale. These goods are then distributed through channels to commercial and non-commercial operators. The commercial segment, comprising 80% of the market, includes everything from quick service restaurants to fine dining establishments.
  • Regulatory bodies enforce stringent food safety standards, while technology providers offer solutions like point of sale systems and kitchen management software that are integral to operational efficiency. The value chain culminates with end-users whose preferences for convenience and digital integration drive innovation.
  • Supporting entities, including logistics firms and R&D organizations, are crucial for supply chain resilience and culinary innovation, ensuring the industry can adapt to evolving consumer demands.

What are the Key Data Covered in this Food Service Market Research and Growth Report?

  • What is the expected growth of the Food Service Market between 2026 and 2030?

    • The Food Service Market is expected to grow by USD 5581.4 billion during 2026-2030, registering a CAGR of 7.9%. Year-over-year growth in 2026 is estimated at 7.8%%. This acceleration is shaped by evolving consumer lifestyles and quest for convenience, which is intensifying demand across multiple end-use verticals covered in the report.

  • What segmentation does the market report cover?

    • The report is segmented by Service (Conventional, Centralized, Ready-prepared, and Assembly-serve), Sector (Commercial, and Non-commercial), Type (Full service restaurants, Quick service restaurants, Institutes, and Others) and Geography (APAC, North America, Europe, South America, Middle East and Africa). Among these, the Conventional segment is estimated to witness significant growth during the forecast period, driven by rising adoption across key application areas. Each segment includes detailed qualitative and quantitative analysis, along with historical data from 2020-2024 and forecasts through 2030 with year-over-year growth rates.

  • Which regions are analyzed in the report?

    • The report covers APAC, North America, Europe, South America and Middle East and Africa. APAC is estimated to contribute 50.1% to market growth during the forecast period. Country-level analysis includes China, Japan, India, South Korea, Australia, Indonesia, US, Canada, Mexico, France, UK, Germany, Italy, Spain, The Netherlands, Brazil, Argentina, Chile, Saudi Arabia, Turkey, UAE, South Africa and Egypt, with dedicated market size tables and year-over-year growth for each.

  • What are the key growth drivers and market challenges?

    • The primary driver is evolving consumer lifestyles and quest for convenience, which is accelerating investment and industry demand. The main challenge is pervasive labor shortages and escalating wage pressures, creating operational barriers for key market participants. The report quantifies the impact of each driver and challenge across 2026 and 2030 with comparative analysis.

  • Who are the major players in the Food Service Market?

    • Key vendors include Abela and Co. LLC, Aramark, Compass Group Plc, Costa Coffee, Delaware North Companies Inc., Dominos Pizza Inc., Eurest USA, Honeybee Foods Corp., Maschio Food Services Inc., McDonald Corp., MOS Food Services Inc., Papa Johns International Inc., Performance Food Group Co., Restaurant Brands Inc., SGS SA, Sodexo SA, Starbucks Corp., Sysco Corp., The Wendys Co. and Tim Hortons USA Inc.. The report provides qualitative and quantitative analysis categorizing companies as dominant, leading, strong, tentative, and weak based on their market positioning. Company profiles include business segment analysis, SWOT assessment, key offerings, and recent strategic developments.

Market Research Insights

  • The global food service market's competitive landscape is highly fragmented, with the top ten players, including McDonald Corp. and Starbucks Corp., accounting for less than 20% of the total market share. This environment fosters intense rivalry, compelling vendors to innovate continuously.
  • A key development is the strategic partnership between major chains and technology firms, such as the collaboration to deploy generative AI and cloud solutions across thousands of restaurants, aiming to boost operational efficiency by 15%. Simultaneously, sustainability has become a critical differentiator.
  • Leading coffeehouse chains are driving this shift by becoming the first to accept reusable cups for all order types, a move projected to divert millions of cups from landfills. These initiatives reflect a broader industry adaptation to challenges like market saturation and evolving consumer values, pushing companies like Compass Group Plc and Sodexo SA to refine their service models.

We can help! Our analysts can customize this food service market research report to meet your requirements.

Get in touch

1. Executive Summary

1.1 Market overview

Executive Summary - Chart on Market Overview
Executive Summary - Data Table on Market Overview
Executive Summary - Chart on Global Market Characteristics
Executive Summary - Chart on Market by Geography
Executive Summary - Chart on Market Segmentation by Service
Executive Summary - Chart on Market Segmentation by Sector
Executive Summary - Chart on Market Segmentation by Type
Executive Summary - Chart on Incremental Growth
Executive Summary - Data Table on Incremental Growth
Executive Summary - Chart on Company Market Positioning

2. Technavio Analysis

2.1 Analysis of price sensitivity, lifecycle, customer purchase basket, adoption rates, and purchase criteria

2.2 Criticality of inputs and Factors of differentiation

Chart on Overview on criticality of inputs and factors of differentiation

2.3 Factors of disruption

Chart on Overview on factors of disruption

2.4 Impact of drivers and challenges

Chart on Impact of drivers and challenges in 2025 and 2030

3. Market Landscape

3.1 Market ecosystem

Chart on Parent Market
Data Table on - Parent Market

3.2 Market characteristics

Chart on Market characteristics analysis

3.3 Value chain analysis

Chart on Value chain analysis

4. Market Sizing

4.1 Market definition

Data Table on Offerings of companies included in the market definition

4.2 Market segment analysis

Market segments

4.3 Market size 2025

4.4 Market outlook: Forecast for 2025-2030

Chart on Global - Market size and forecast 2025-2030 ($ billion)
Data Table on Global - Market size and forecast 2025-2030 ($ billion)
Chart on Global Market: Year-over-year growth 2025-2030 (%)
Data Table on Global Market: Year-over-year growth 2025-2030 (%)

5. Historic Market Size

5.1 Global Food Service Market 2020 - 2024

Historic Market Size - Data Table on Global Food Service Market 2020 - 2024 ($ billion)

5.2 Service segment analysis 2020 - 2024

Historic Market Size - Service Segment 2020 - 2024 ($ billion)

5.3 Sector segment analysis 2020 - 2024

Historic Market Size - Sector Segment 2020 - 2024 ($ billion)

5.4 Type segment analysis 2020 - 2024

Historic Market Size - Type Segment 2020 - 2024 ($ billion)

5.5 Geography segment analysis 2020 - 2024

Historic Market Size - Geography Segment 2020 - 2024 ($ billion)

5.6 Country segment analysis 2020 - 2024

Historic Market Size - Country Segment 2020 - 2024 ($ billion)

6. Qualitative Analysis

6.1 The impact of AI on global food service market

7. Five Forces Analysis

7.1 Five forces summary

Five forces analysis - Comparison between 2025 and 2030

7.2 Bargaining power of buyers

Bargaining power of buyers - Impact of key factors 2025 and 2030

7.3 Bargaining power of suppliers

Bargaining power of suppliers - Impact of key factors in 2025 and 2030

7.4 Threat of new entrants

Threat of new entrants - Impact of key factors in 2025 and 2030

7.5 Threat of substitutes

Threat of substitutes - Impact of key factors in 2025 and 2030

7.6 Threat of rivalry

Threat of rivalry - Impact of key factors in 2025 and 2030

7.7 Market condition

Chart on Market condition - Five forces 2025 and 2030

8. Market Segmentation by Service

8.1 Market segments

Chart on Service - Market share 2025-2030 (%)
Data Table on Service - Market share 2025-2030 (%)

8.2 Comparison by Service

Chart on Comparison by Service
Data Table on Comparison by Service

8.3 Conventional - Market size and forecast 2025-2030

Chart on Conventional - Market size and forecast 2025-2030 ($ billion)
Data Table on Conventional - Market size and forecast 2025-2030 ($ billion)
Chart on Conventional - Year-over-year growth 2025-2030 (%)
Data Table on Conventional - Year-over-year growth 2025-2030 (%)

8.4 Centralized - Market size and forecast 2025-2030

Chart on Centralized - Market size and forecast 2025-2030 ($ billion)
Data Table on Centralized - Market size and forecast 2025-2030 ($ billion)
Chart on Centralized - Year-over-year growth 2025-2030 (%)
Data Table on Centralized - Year-over-year growth 2025-2030 (%)

8.5 Ready-prepared - Market size and forecast 2025-2030

Chart on Ready-prepared - Market size and forecast 2025-2030 ($ billion)
Data Table on Ready-prepared - Market size and forecast 2025-2030 ($ billion)
Chart on Ready-prepared - Year-over-year growth 2025-2030 (%)
Data Table on Ready-prepared - Year-over-year growth 2025-2030 (%)

8.6 Assembly-serve - Market size and forecast 2025-2030

Chart on Assembly-serve - Market size and forecast 2025-2030 ($ billion)
Data Table on Assembly-serve - Market size and forecast 2025-2030 ($ billion)
Chart on Assembly-serve - Year-over-year growth 2025-2030 (%)
Data Table on Assembly-serve - Year-over-year growth 2025-2030 (%)

8.7 Market opportunity by Service

Market opportunity by Service ($ billion)
Data Table on Market opportunity by Service ($ billion)

9. Market Segmentation by Sector

9.1 Market segments

Chart on Sector - Market share 2025-2030 (%)
Data Table on Sector - Market share 2025-2030 (%)

9.2 Comparison by Sector

Chart on Comparison by Sector
Data Table on Comparison by Sector

9.3 Commercial - Market size and forecast 2025-2030

Chart on Commercial - Market size and forecast 2025-2030 ($ billion)
Data Table on Commercial - Market size and forecast 2025-2030 ($ billion)
Chart on Commercial - Year-over-year growth 2025-2030 (%)
Data Table on Commercial - Year-over-year growth 2025-2030 (%)

9.4 Non-commercial - Market size and forecast 2025-2030

Chart on Non-commercial - Market size and forecast 2025-2030 ($ billion)
Data Table on Non-commercial - Market size and forecast 2025-2030 ($ billion)
Chart on Non-commercial - Year-over-year growth 2025-2030 (%)
Data Table on Non-commercial - Year-over-year growth 2025-2030 (%)

9.5 Market opportunity by Sector

Market opportunity by Sector ($ billion)
Data Table on Market opportunity by Sector ($ billion)

10. Market Segmentation by Type

10.1 Market segments

Chart on Type - Market share 2025-2030 (%)
Data Table on Type - Market share 2025-2030 (%)

10.2 Comparison by Type

Chart on Comparison by Type
Data Table on Comparison by Type

10.3 Full service restaurants - Market size and forecast 2025-2030

Chart on Full service restaurants - Market size and forecast 2025-2030 ($ billion)
Data Table on Full service restaurants - Market size and forecast 2025-2030 ($ billion)
Chart on Full service restaurants - Year-over-year growth 2025-2030 (%)
Data Table on Full service restaurants - Year-over-year growth 2025-2030 (%)

10.4 Quick service restaurants - Market size and forecast 2025-2030

Chart on Quick service restaurants - Market size and forecast 2025-2030 ($ billion)
Data Table on Quick service restaurants - Market size and forecast 2025-2030 ($ billion)
Chart on Quick service restaurants - Year-over-year growth 2025-2030 (%)
Data Table on Quick service restaurants - Year-over-year growth 2025-2030 (%)

10.5 Institutes - Market size and forecast 2025-2030

Chart on Institutes - Market size and forecast 2025-2030 ($ billion)
Data Table on Institutes - Market size and forecast 2025-2030 ($ billion)
Chart on Institutes - Year-over-year growth 2025-2030 (%)
Data Table on Institutes - Year-over-year growth 2025-2030 (%)

10.6 Others - Market size and forecast 2025-2030

Chart on Others - Market size and forecast 2025-2030 ($ billion)
Data Table on Others - Market size and forecast 2025-2030 ($ billion)
Chart on Others - Year-over-year growth 2025-2030 (%)
Data Table on Others - Year-over-year growth 2025-2030 (%)

10.7 Market opportunity by Type

Market opportunity by Type ($ billion)
Data Table on Market opportunity by Type ($ billion)

11. Customer Landscape

11.1 Customer landscape overview

Analysis of price sensitivity, lifecycle, customer purchase basket, adoption rates, and purchase criteria

12. Geographic Landscape

12.1 Geographic segmentation

Chart on Market share by geography 2025-2030 (%)
Data Table on Market share by geography 2025-2030 (%)

12.2 Geographic comparison

Chart on Geographic comparison
Data Table on Geographic comparison

12.3 APAC - Market size and forecast 2025-2030

Chart on APAC - Market size and forecast 2025-2030 ($ billion)
Data Table on APAC - Market size and forecast 2025-2030 ($ billion)
Chart on APAC - Year-over-year growth 2025-2030 (%)
Data Table on APAC - Year-over-year growth 2025-2030 (%)
Chart on Regional Comparison - APAC
Data Table on Regional Comparison - APAC

12.3.1 China - Market size and forecast 2025-2030

Chart on China - Market size and forecast 2025-2030 ($ billion)
Data Table on China - Market size and forecast 2025-2030 ($ billion)
Chart on China - Year-over-year growth 2025-2030 (%)
Data Table on China - Year-over-year growth 2025-2030 (%)

12.3.2 Japan - Market size and forecast 2025-2030

Chart on Japan - Market size and forecast 2025-2030 ($ billion)
Data Table on Japan - Market size and forecast 2025-2030 ($ billion)
Chart on Japan - Year-over-year growth 2025-2030 (%)
Data Table on Japan - Year-over-year growth 2025-2030 (%)

12.3.3 India - Market size and forecast 2025-2030

Chart on India - Market size and forecast 2025-2030 ($ billion)
Data Table on India - Market size and forecast 2025-2030 ($ billion)
Chart on India - Year-over-year growth 2025-2030 (%)
Data Table on India - Year-over-year growth 2025-2030 (%)

12.3.4 South Korea - Market size and forecast 2025-2030

Chart on South Korea - Market size and forecast 2025-2030 ($ billion)
Data Table on South Korea - Market size and forecast 2025-2030 ($ billion)
Chart on South Korea - Year-over-year growth 2025-2030 (%)
Data Table on South Korea - Year-over-year growth 2025-2030 (%)

12.3.5 Australia - Market size and forecast 2025-2030

Chart on Australia - Market size and forecast 2025-2030 ($ billion)
Data Table on Australia - Market size and forecast 2025-2030 ($ billion)
Chart on Australia - Year-over-year growth 2025-2030 (%)
Data Table on Australia - Year-over-year growth 2025-2030 (%)

12.3.6 Indonesia - Market size and forecast 2025-2030

Chart on Indonesia - Market size and forecast 2025-2030 ($ billion)
Data Table on Indonesia - Market size and forecast 2025-2030 ($ billion)
Chart on Indonesia - Year-over-year growth 2025-2030 (%)
Data Table on Indonesia - Year-over-year growth 2025-2030 (%)

12.4 North America - Market size and forecast 2025-2030

Chart on North America - Market size and forecast 2025-2030 ($ billion)
Data Table on North America - Market size and forecast 2025-2030 ($ billion)
Chart on North America - Year-over-year growth 2025-2030 (%)
Data Table on North America - Year-over-year growth 2025-2030 (%)
Chart on Regional Comparison - North America
Data Table on Regional Comparison - North America

12.4.1 US - Market size and forecast 2025-2030

Chart on US - Market size and forecast 2025-2030 ($ billion)
Data Table on US - Market size and forecast 2025-2030 ($ billion)
Chart on US - Year-over-year growth 2025-2030 (%)
Data Table on US - Year-over-year growth 2025-2030 (%)

12.4.2 Canada - Market size and forecast 2025-2030

Chart on Canada - Market size and forecast 2025-2030 ($ billion)
Data Table on Canada - Market size and forecast 2025-2030 ($ billion)
Chart on Canada - Year-over-year growth 2025-2030 (%)
Data Table on Canada - Year-over-year growth 2025-2030 (%)

12.4.3 Mexico - Market size and forecast 2025-2030

Chart on Mexico - Market size and forecast 2025-2030 ($ billion)
Data Table on Mexico - Market size and forecast 2025-2030 ($ billion)
Chart on Mexico - Year-over-year growth 2025-2030 (%)
Data Table on Mexico - Year-over-year growth 2025-2030 (%)

12.5 Europe - Market size and forecast 2025-2030

Chart on Europe - Market size and forecast 2025-2030 ($ billion)
Data Table on Europe - Market size and forecast 2025-2030 ($ billion)
Chart on Europe - Year-over-year growth 2025-2030 (%)
Data Table on Europe - Year-over-year growth 2025-2030 (%)
Chart on Regional Comparison - Europe
Data Table on Regional Comparison - Europe

12.5.1 France - Market size and forecast 2025-2030

Chart on France - Market size and forecast 2025-2030 ($ billion)
Data Table on France - Market size and forecast 2025-2030 ($ billion)
Chart on France - Year-over-year growth 2025-2030 (%)
Data Table on France - Year-over-year growth 2025-2030 (%)

12.5.2 UK - Market size and forecast 2025-2030

Chart on UK - Market size and forecast 2025-2030 ($ billion)
Data Table on UK - Market size and forecast 2025-2030 ($ billion)
Chart on UK - Year-over-year growth 2025-2030 (%)
Data Table on UK - Year-over-year growth 2025-2030 (%)

12.5.3 Germany - Market size and forecast 2025-2030

Chart on Germany - Market size and forecast 2025-2030 ($ billion)
Data Table on Germany - Market size and forecast 2025-2030 ($ billion)
Chart on Germany - Year-over-year growth 2025-2030 (%)
Data Table on Germany - Year-over-year growth 2025-2030 (%)

12.5.4 Italy - Market size and forecast 2025-2030

Chart on Italy - Market size and forecast 2025-2030 ($ billion)
Data Table on Italy - Market size and forecast 2025-2030 ($ billion)
Chart on Italy - Year-over-year growth 2025-2030 (%)
Data Table on Italy - Year-over-year growth 2025-2030 (%)

12.5.5 Spain - Market size and forecast 2025-2030

Chart on Spain - Market size and forecast 2025-2030 ($ billion)
Data Table on Spain - Market size and forecast 2025-2030 ($ billion)
Chart on Spain - Year-over-year growth 2025-2030 (%)
Data Table on Spain - Year-over-year growth 2025-2030 (%)

12.5.6 The Netherlands - Market size and forecast 2025-2030

Chart on The Netherlands - Market size and forecast 2025-2030 ($ billion)
Data Table on The Netherlands - Market size and forecast 2025-2030 ($ billion)
Chart on The Netherlands - Year-over-year growth 2025-2030 (%)
Data Table on The Netherlands - Year-over-year growth 2025-2030 (%)

12.6 South America - Market size and forecast 2025-2030

Chart on South America - Market size and forecast 2025-2030 ($ billion)
Data Table on South America - Market size and forecast 2025-2030 ($ billion)
Chart on South America - Year-over-year growth 2025-2030 (%)
Data Table on South America - Year-over-year growth 2025-2030 (%)
Chart on Regional Comparison - South America
Data Table on Regional Comparison - South America

12.6.1 Brazil - Market size and forecast 2025-2030

Chart on Brazil - Market size and forecast 2025-2030 ($ billion)
Data Table on Brazil - Market size and forecast 2025-2030 ($ billion)
Chart on Brazil - Year-over-year growth 2025-2030 (%)
Data Table on Brazil - Year-over-year growth 2025-2030 (%)

12.6.2 Argentina - Market size and forecast 2025-2030

Chart on Argentina - Market size and forecast 2025-2030 ($ billion)
Data Table on Argentina - Market size and forecast 2025-2030 ($ billion)
Chart on Argentina - Year-over-year growth 2025-2030 (%)
Data Table on Argentina - Year-over-year growth 2025-2030 (%)

12.6.3 Chile - Market size and forecast 2025-2030

Chart on Chile - Market size and forecast 2025-2030 ($ billion)
Data Table on Chile - Market size and forecast 2025-2030 ($ billion)
Chart on Chile - Year-over-year growth 2025-2030 (%)
Data Table on Chile - Year-over-year growth 2025-2030 (%)

12.7 Middle East and Africa - Market size and forecast 2025-2030

Chart on Middle East and Africa - Market size and forecast 2025-2030 ($ billion)
Data Table on Middle East and Africa - Market size and forecast 2025-2030 ($ billion)
Chart on Middle East and Africa - Year-over-year growth 2025-2030 (%)
Data Table on Middle East and Africa - Year-over-year growth 2025-2030 (%)
Chart on Regional Comparison - Middle East and Africa
Data Table on Regional Comparison - Middle East and Africa

12.7.1 Saudi Arabia - Market size and forecast 2025-2030

Chart on Saudi Arabia - Market size and forecast 2025-2030 ($ billion)
Data Table on Saudi Arabia - Market size and forecast 2025-2030 ($ billion)
Chart on Saudi Arabia - Year-over-year growth 2025-2030 (%)
Data Table on Saudi Arabia - Year-over-year growth 2025-2030 (%)

12.7.2 Turkey - Market size and forecast 2025-2030

Chart on Turkey - Market size and forecast 2025-2030 ($ billion)
Data Table on Turkey - Market size and forecast 2025-2030 ($ billion)
Chart on Turkey - Year-over-year growth 2025-2030 (%)
Data Table on Turkey - Year-over-year growth 2025-2030 (%)

12.7.3 UAE - Market size and forecast 2025-2030

Chart on UAE - Market size and forecast 2025-2030 ($ billion)
Data Table on UAE - Market size and forecast 2025-2030 ($ billion)
Chart on UAE - Year-over-year growth 2025-2030 (%)
Data Table on UAE - Year-over-year growth 2025-2030 (%)

12.7.4 South Africa - Market size and forecast 2025-2030

Chart on South Africa - Market size and forecast 2025-2030 ($ billion)
Data Table on South Africa - Market size and forecast 2025-2030 ($ billion)
Chart on South Africa - Year-over-year growth 2025-2030 (%)
Data Table on South Africa - Year-over-year growth 2025-2030 (%)

12.7.5 Egypt - Market size and forecast 2025-2030

Chart on Egypt - Market size and forecast 2025-2030 ($ billion)
Data Table on Egypt - Market size and forecast 2025-2030 ($ billion)
Chart on Egypt - Year-over-year growth 2025-2030 (%)
Data Table on Egypt - Year-over-year growth 2025-2030 (%)

12.8 Market opportunity by geography

Market opportunity by geography ($ billion)
Data Tables on Market opportunity by geography ($ billion)

13. Drivers, Challenges, and Opportunity

13.1 Market drivers

Evolving consumer lifestyles and quest for convenience
Pervasive influence of digital transformation and technological integration
Expansion of global middle class and rising disposable incomes

13.2 Market challenges

Pervasive labor shortages and escalating wage pressures
Intensifying market saturation and severe margin compression
Chronic supply chain disruption and commodity price volatility

13.3 Impact of drivers and challenges

Impact of drivers and challenges in 2025 and 2030

13.4 Market opportunities

Ascendancy of health, wellness, and sustainability as core value propositions
Structural shift towards off premises centric operating model
Deepening integration of data analytics for hyper personalization

14. Competitive Landscape

14.1 Overview

14.2

Overview on criticality of inputs and factors of differentiation

14.3 Landscape disruption

Overview on factors of disruption

14.4 Industry risks

Impact of key risks on business

15. Competitive Analysis

15.1 Companies profiled

Companies covered

15.2 Company ranking index

15.3 Market positioning of companies

Matrix on companies position and classification

15.4 Aramark

Aramark - Overview
Aramark - Business segments
Aramark - Key offerings
Aramark - Segment focus
SWOT

15.5 Compass Group Plc

Compass Group Plc - Overview
Compass Group Plc - Business segments
Compass Group Plc - Key offerings
Compass Group Plc - Segment focus
SWOT

15.6 Costa Coffee

Costa Coffee - Overview
Costa Coffee - Product / Service
Costa Coffee - Key offerings
SWOT

15.7 Dominos Pizza Inc.

Dominos Pizza Inc. - Overview
Dominos Pizza Inc. - Business segments
Dominos Pizza Inc. - Key offerings
Dominos Pizza Inc. - Segment focus
SWOT

15.8 Eurest USA

Eurest USA - Overview
Eurest USA - Product / Service
Eurest USA - Key offerings
SWOT

15.9 Honeybee Foods Corp.

Honeybee Foods Corp. - Overview
Honeybee Foods Corp. - Product / Service
Honeybee Foods Corp. - Key offerings
SWOT

15.10 McDonald Corp.

McDonald Corp. - Overview
McDonald Corp. - Business segments
McDonald Corp. - Key offerings
McDonald Corp. - Segment focus
SWOT

15.11 Performance Food Group Co.

Performance Food Group Co. - Overview
Performance Food Group Co. - Business segments
Performance Food Group Co. - Key news
Performance Food Group Co. - Key offerings
Performance Food Group Co. - Segment focus
SWOT

15.12 Restaurant Brands Inc.

Restaurant Brands Inc. - Overview
Restaurant Brands Inc. - Business segments
Restaurant Brands Inc. - Key offerings
Restaurant Brands Inc. - Segment focus
SWOT

15.13 SGS SA

SGS SA - Overview
SGS SA - Business segments
SGS SA - Key offerings
SGS SA - Segment focus
SWOT

15.14 Sodexo SA

Sodexo SA - Overview
Sodexo SA - Business segments
Sodexo SA - Key offerings
Sodexo SA - Segment focus
SWOT

15.15 Starbucks Corp.

Starbucks Corp. - Overview
Starbucks Corp. - Business segments
Starbucks Corp. - Key offerings
Starbucks Corp. - Segment focus
SWOT

15.16 Sysco Corp.

Sysco Corp. - Overview
Sysco Corp. - Business segments
Sysco Corp. - Key news
Sysco Corp. - Key offerings
Sysco Corp. - Segment focus
SWOT

15.17 The Wendys Co.

The Wendys Co. - Overview
The Wendys Co. - Business segments
The Wendys Co. - Key offerings
The Wendys Co. - Segment focus
SWOT

15.18 Tim Hortons USA Inc.

Tim Hortons USA Inc. - Overview
Tim Hortons USA Inc. - Product / Service
Tim Hortons USA Inc. - Key offerings
SWOT

16. Appendix

16.1 Scope of the report

Market definition
Objectives
Notes and caveats

16.2 Inclusions and exclusions checklist

Inclusions checklist
Exclusions checklist

16.3 Currency conversion rates for US$

16.4 Research methodology

16.5 Data procurement

Information sources

16.6 Data validation

16.7 Validation techniques employed for market sizing

16.8 Data synthesis

16.9 360 degree market analysis

16.10 List of abbreviations

Research Methodology

Technavio presents a detailed picture of the market by way of study, synthesis, and summation of data from multiple sources. The analysts have presented the various facets of the market with a particular focus on identifying the key industry influencers. The data thus presented is comprehensive, reliable, and the result of extensive research, both primary and secondary.

INFORMATION SOURCES

Primary sources

  • Manufacturers and suppliers
  • Channel partners
  • Industry experts
  • Strategic decision makers

Secondary sources

  • Industry journals and periodicals
  • Government data
  • Financial reports of key industry players
  • Historical data
  • Press releases

DATA ANALYSIS

Data Synthesis

  • Collation of data
  • Estimation of key figures
  • Analysis of derived insights

Data Validation

  • Triangulation with data models
  • Reference against proprietary databases
  • Corroboration with industry experts

REPORT WRITING

Qualitative

  • Market drivers
  • Market challenges
  • Market trends
  • Five forces analysis

Quantitative

  • Market size and forecast
  • Market segmentation
  • Geographical insights
  • Competitive landscape

Interested in this report?

Get your sample now to see our research methodology and insights!

Download Now

Frequently Asked Questions

Food Service market growth will increase by USD 5581.4 billion during 2026-2030.

The Food Service market is expected to grow at a CAGR of 7.9% during 2026-2030.

Food Service market is segmented by Service (Conventional, Centralized, Ready-prepared, Assembly-serve) Sector (Commercial, Non-commercial) Type (Full service restaurants, Quick service restaurants, Institutes, Others)

Abela and Co. LLC, Aramark, Compass Group Plc, Costa Coffee, Delaware North Companies Inc., Dominos Pizza Inc., Eurest USA, Honeybee Foods Corp., Maschio Food Services Inc., McDonald Corp., MOS Food Services Inc., Papa Johns International Inc., Performance Food Group Co., Restaurant Brands Inc., SGS SA, Sodexo SA, Starbucks Corp., Sysco Corp., The Wendys Co., Tim Hortons USA Inc. are a few of the key vendors in the Food Service market.

APAC will register the highest growth rate of 50.1% among the other regions. Therefore, the Food Service market in APAC is expected to garner significant business opportunities for the vendors during the forecast period.

China, Japan, India, South Korea, Australia, Indonesia, US, Canada, Mexico, France, UK, Germany, Italy, Spain, The Netherlands, Brazil, Argentina, Chile, Saudi Arabia, Turkey, UAE, South Africa, Egypt

  • Evolving consumer lifestyles and quest for convenience is the driving factor this market.

The Food Service market vendors should focus on grabbing business opportunities from the Service segment as it accounted for the largest market share in the base year.
RIA - Research AI Assistant
Ask RIA