


Causal AI Market Analysis North America, Europe, APAC, Middle East and Africa, South America - US, China, Germany, UK, France - Size and Forecast 2024-2028

Causal AI Market Analysis North America, Europe, APAC, Middle East and Africa, South America - US, China, Germany, UK, France - Size and Forecast 2024-2028

Published: Jun 2024 152 Pages SKU: IRTNTR77649

Market Overview at a Glance

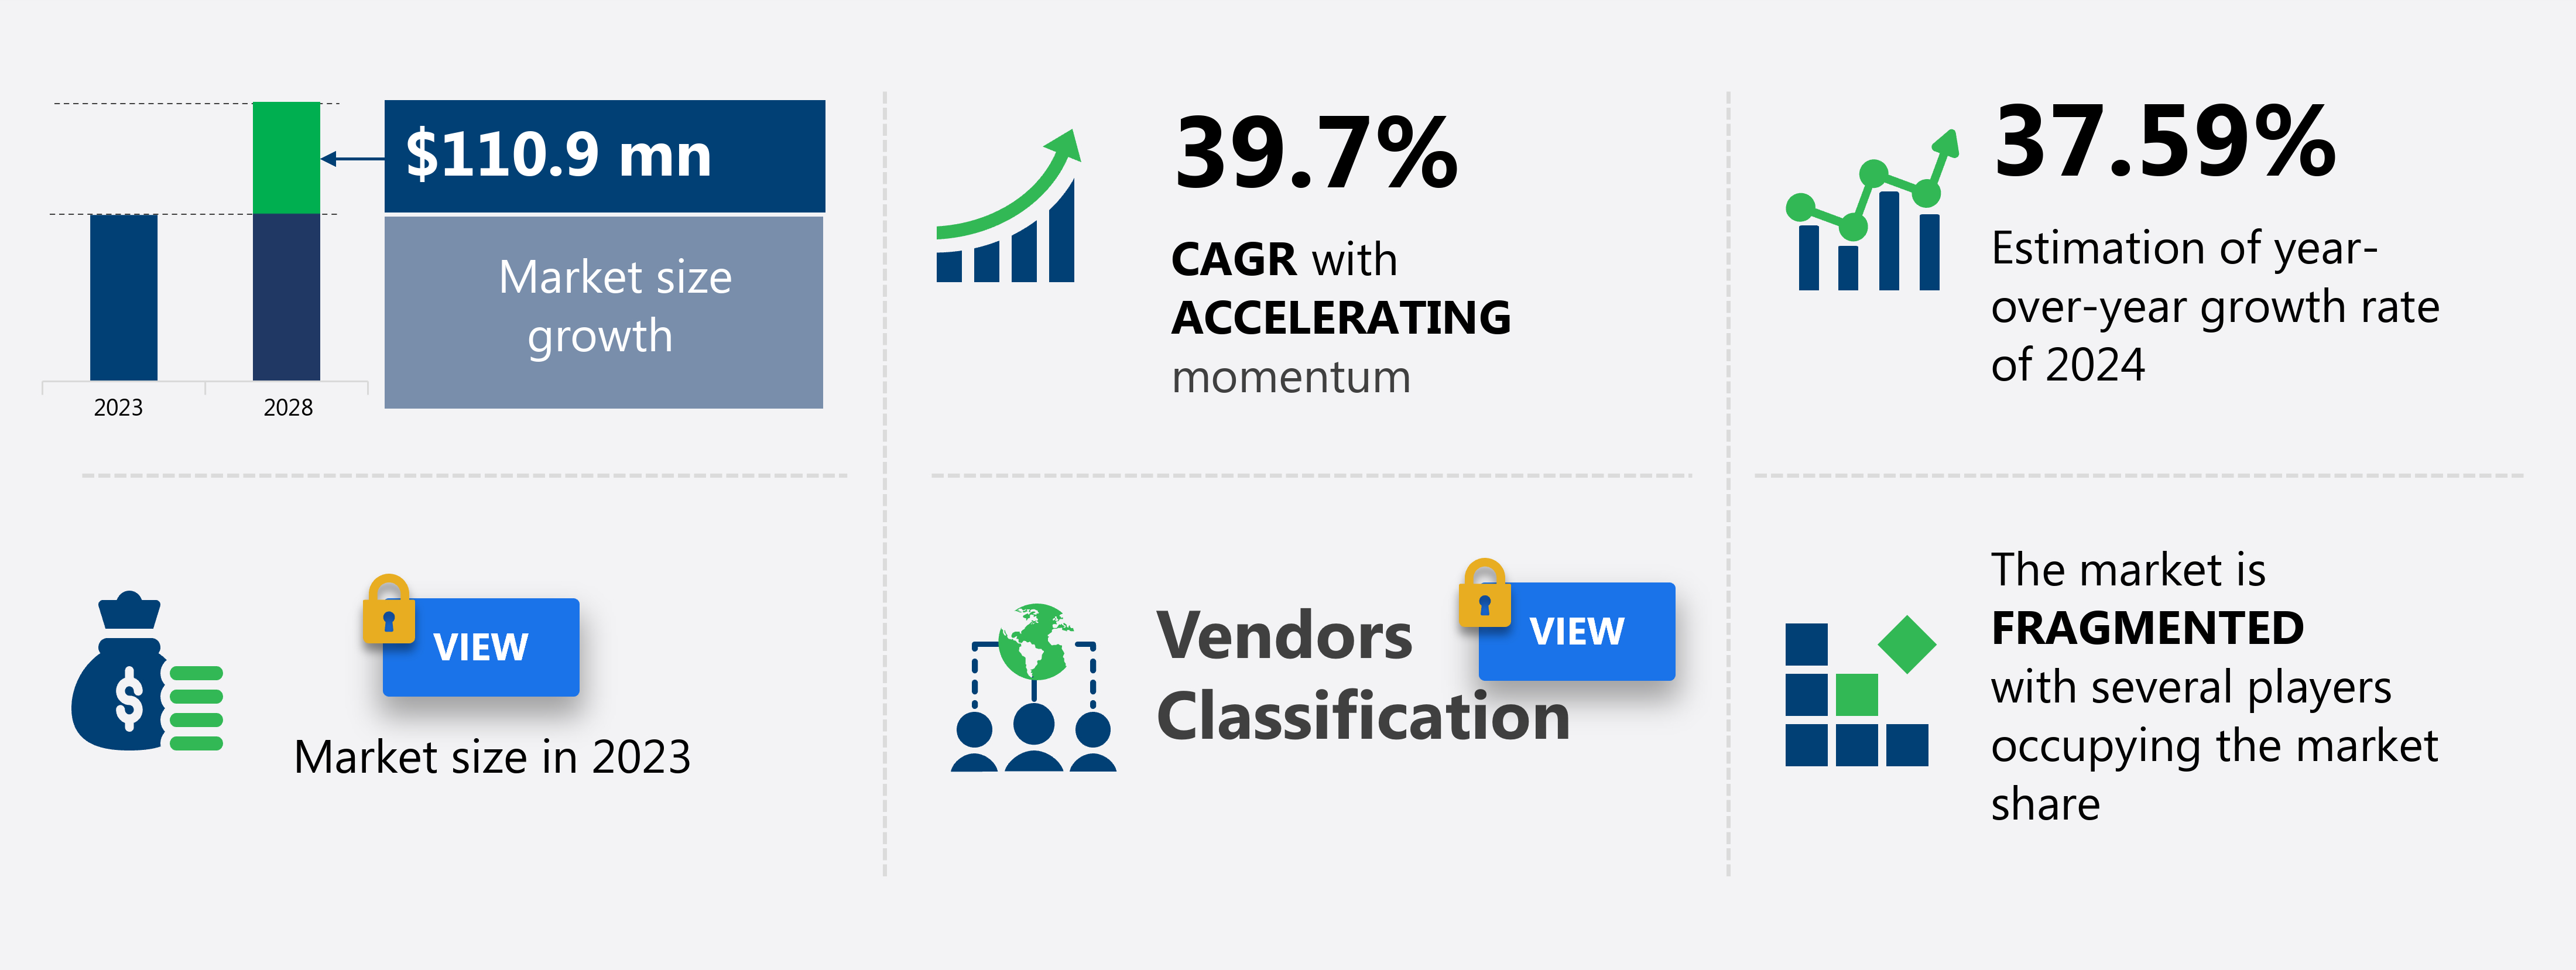
$110.9 Mn
Market Opportunity
39.7%
CAGR
37.59
YoY growth 2023-2024(%)

Causal AI Market Size 2024-2028 

The causal AI market size is forecast to increase by USD 110.9 million at a CAGR of 39.7% between 2023 and 2028.

  • The market is experiencing significant growth, driven by the increasing adoption of preventive strategies in various industries, particularly in healthcare and finance. Causal inference, the ability to identify the relationship between causes and effects, is becoming a crucial component of mainstream AI solutions. The potential applications of causal AI are vast, including drug discovery, predictive analytics,  natural language processing, patient diagnosis, and treatment, as well as personalized medicine. Venture capital firms have taken notice, with numerous investments and acquisitions in this area. However, challenges remain, such as the complexity of causal inference from large and intricate data sets, as well as ensuring the accuracy and reliability of causal models. Despite these challenges, the future of causal AI looks promising, with the potential to revolutionize industries and improve outcomes in various sectors.

What will be the Size of the Market During the Forecast Period?
Causal AI Market Size

 Request Free Sample

  • The market is witnessing significant growth due to its ability to provide insights into the underlying causes of complex data patterns. CAI is a subset of AI that focuses on identifying the causal relationships between variables, which is essential in various industries such as healthcare, finance, and manufacturing. One of the primary drivers of the CAI market is the increasing demand for interpretable AI solutions. Traditional AI models, such as deep learning and neural networks, are often considered a "black box," making it challenging to understand how they arrive at their conclusions.
  • In addition, CAI, on the other hand, offers transparency and explainability, making it an attractive option for businesses that require regulatory compliance and data privacy. Another factor fueling the growth of the CAI market is the need for customization and maintenance services. As businesses increasingly rely on AI to optimize operations, they require solutions that can be tailored to their specific needs. CAI's ability to identify causal relationships makes it an ideal choice for customized AI solutions. Furthermore, the need for ongoing maintenance and updates to keep up with technological advancements is driving demand for CAI solutions that offer maintenance services.

How is this market segmented and which is the largest segment?

The market research report provides comprehensive data (region-wise segment analysis), with forecasts and estimates in "USD million" for the period 2024-2028, as well as historical data from 2018-2022 for the following segments.

  • Deployment
    • Cloud
    • On-premises
  • End-user
    • Healthcare and life sciences
    • BFSI
    • Retail and e-commerce
    • Transportation and logistics
    • Others
  • Geography
    • North America
      • US
    • Europe
      • Germany
      • UK
      • France
    • APAC
      • China
    • Middle East and Africa
    • South America

By Deployment Insights

  • The cloud segment is estimated to witness significant growth during the forecast period.

In the realm of Artificial Intelligence (AI), on-premises deployment continues to be a preferred choice for businesses seeking data privacy and regulatory compliance. However, the advantages of cloud deployment, including scalability, accessibility, and cost-effectiveness, have made it an increasingly popular option for AI projects. Causal AI, a subsegment of advanced data analytics, is particularly well-suited to cloud deployment due to its variable usage requirements. Virtual assistants, such as Siri, Google Assistant, and Alexa, are prime examples of causal AI applications that benefit from cloud deployment. These AI models require significant computing power and storage capacity to process user queries and provide accurate responses.

Moreover, cloud providers offer AI-as-a-service (AIaaS) solutions, enabling developers to easily integrate pre-built AI models and services into their applications. Maintenance services are another crucial aspect of AI initiatives, ensuring that models remain up-to-date and perform optimally. Cloud providers offer these services, allowing businesses to focus on their core competencies while leaving the technical complexities to the experts. Data privacy and security are paramount, and cloud providers offer strong security measures to protect sensitive data. In conclusion, the importance of inference in causal AI applications, coupled with the benefits of cloud deployment, make it an attractive choice for businesses seeking to operationalize their AI initiatives.
Causal AI Market Share

Get a glance at the market report of share of various segments Request Free Sample

Market Dynamics

Our region market researchers analyzed the data with 2023 as the base year, along with the key drivers, trends, and challenges. A holistic analysis of drivers will help companies refine their marketing strategies to gain a competitive advantage.

What are the key market drivers leading to the rise in adoption of Causal AI Market?

Growing innovation of causal AI in healthcare and finance is the key driver of the market.

  • Causal artificial intelligence (AI) models are gaining traction in various industries, particularly in healthcare and finance, due to their ability to analyze vast datasets and provide accurate predictions. In healthcare, these models examine electronic health records, genomic data, and patient histories to determine the likelihood of diseases and facilitate early diagnosis. By taking into account genetic factors, lifestyle choices, and medication responses, causal AI models enable personalized treatment plans. Moreover, they expedite drug discovery by analyzing biological data to identify potential drug candidates and assess their potential efficacy and safety. In the healthcare sector, AI-powered chatbots enhance patient engagement by offering instant medical information, addressing queries, and managing appointment scheduling.
  • Similarly, in finance, causal AI models scrutinize financial transactions for irregularities and fraudulent activities in real time, ensuring enhanced security. The scalability and flexibility of causal AI models, coupled with their cost-effectiveness, make them an indispensable asset for organizations seeking to optimize their operations and improve overall performance.

What are the market trends shaping the Causal AI Market?

Integration of causal inference into mainstream AI solutions is the upcoming trend in the market.

  • Causal inference is a vital component of artificial intelligence (AI) systems, enabling a deeper comprehension of cause-and-effect relationships within intricate systems. By moving beyond mere correlations, causal inference empowers AI to make more informed decisions by pinpointing actual causal connections. This capability is essential in sectors where determining the consequences of interventions and actions is paramount, such as healthcare, finance, and marketing. In healthcare, causal AI can uncover the root causes of diseases instead of merely identifying patterns in patient data. This approach is invaluable in drug discovery, patient diagnosis, and treatment, paving the way for personalized medicine. Venture capital firms have recognized the potential of causal AI and have invested significantly in this area, with numerous acquisitions taking place.
  • However, implementing causal inference techniques into AI models poses potential challenges, including data availability, model complexity, and interpretability. Addressing these challenges will require ongoing research and collaboration between industry experts and academia. In conclusion, causal inference plays a pivotal role in enhancing the decision-making capabilities of AI systems by identifying true causal relationships. Its integration into predictive models improves the accuracy of predictions, making it a valuable asset in various industries. Despite the challenges, the future of causal AI is promising, with continued investment and advancements expected.

What challenges does Causal AI Market face during the growth?

Causal inference from complex data sets is a key challenge affecting market growth.

  • In the realm of scientific research, particularly in the drug discovery process, the ability to make accurate causal inferences from complex data sets is of paramount importance. Biological systems, molecular targets, disease pathways, and therapeutic compounds are interconnected, and understanding these relationships can lead to the development of effective treatments and improved clinical decision-making. However, working with complex data sets poses challenges. Data quality and representativeness are essential to ensure reliable causal inference. Confounding variables, which may influence both the treatment and the outcome, can lead to inaccurate conclusions if not properly accounted for. Furthermore, ethical and legal considerations come into play when dealing with sensitive patient data.
  • Moreover, ensuring compliance with regulations and ethical standards adds complexity to the process. Causal effects can also vary across subpopulations, further complicating matters. It is crucial for researchers to approach causal inference with a rigorous and professional mindset, ensuring data quality, addressing confounding variables, and adhering to ethical and legal guidelines.

Exclusive Customer Landscape

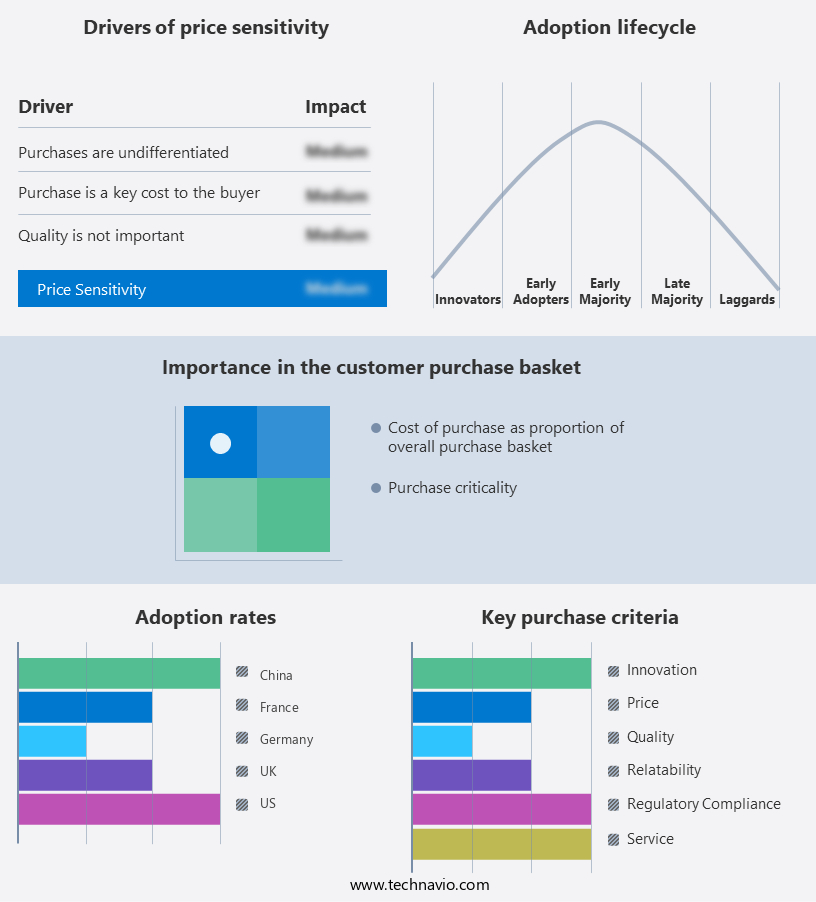
The market forecasting report includes the adoption lifecycle of the market, covering from the innovator's stage to the laggard's stage. It focuses on adoption rates in different regions based on penetration. Furthermore, the market report also includes key purchase criteria and drivers of price sensitivity to help companies evaluate and develop their market growth analysis strategies.
Causal AI Market Share by Geography

 Customer Landscape

Key Companies & Market Insights

Companies are implementing various strategies, such as strategic alliances, market forecast, partnerships, mergers and acquisitions, geographical expansion, and product/service launches, to enhance their presence in the market.

The market research and growth report includes detailed analyses of the competitive landscape of the market and information about key companies, including:

  • Aitia
  • Alphabet Inc.
  • Amazon.com Inc.
  • AMERICAN SOFTWARE INC.
  • causaLens
  • Causality Link LLC
  • Cognino.ai
  • Cognizant Technology Solutions Corp.
  • DataRobot Inc.
  • Dynatrace Inc.
  • Geminos Software
  • H2O.ai Inc.
  • INCRMNTAL Ltd.
  • International Business Machines Corp.
  • Meta Platforms Inc.
  • Microsoft Corp.
  • OpenAI L.L.C.
  • Parabole.ai
  • Scalnyx
  • Xplain Data GmbH

Qualitative and quantitative analysis of companies has been conducted to help clients understand the wider business environment as well as the strengths and weaknesses of key market players. Data is qualitatively analyzed to categorize companies as pure play, category-focused, industry-focused, and diversified; it is quantitatively analyzed to categorize companies as dominant, leading, strong, tentative, and weak.

Research Analyst Overview

The market is witnessing significant growth due to the increasing demand for interpretable AI models in various industries. The availability of vast amounts of data and advancements in computing power have made it possible to identify complex causal relationships between various factors. This is particularly important in fields such as healthcare, where understanding the root causes of diseases and developing personalized treatment plans are key priorities. However, there are several challenges in implementing causal AI, including regulatory compliance, data privacy, and the lack of standardization. Additionally, the high computing resources required for causal inference can make it cost-effective only for large organizations or those with significant investments from venture capital firms.

Despite these challenges, the potential benefits of causal AI are immense. In drug discovery, for instance, causal AI can help identify genetic, environmental, and lifestyle factors that contribute to diseases, enabling the development of targeted therapeutic compounds. In finance, causal AI can be used for portfolio optimization and fraud detection, while in healthcare, it can aid in clinical decision-making and patient diagnosis. The market for causal AI is expected to grow further due to the increasing adoption of cloud-based solutions and the importance of scalability and flexibility. Technological advancements such as generative models, federated learning, and explainable AI are also driving growth in the market. However, the lack of interpretability and customization in some AI models may hinder market adoption, especially in regulated industries. Overall, the market presents significant opportunities for innovation and growth in various industries, from healthcare and finance to academia and research and development. With continued investments and acquisitions in this space, we can expect to see further advancements and applications of causal AI in the future.

Market Scope

Report Coverage

Details

Page number

152

Base year

2023

Historic period

2018-2022

Forecast period

2024-2028

Growth momentum & CAGR

Accelerate at a CAGR of 39.7%

Market growth 2024-2028

USD 110.9 million

Market structure

Fragmented

YoY growth 2023-2024(%)

37.59

Key countries

US, China, Germany, UK, and France

Competitive landscape

Leading Companies, Market Positioning of Companies, Competitive Strategies, and Industry Risks

Request Free Sample

What are the Key Data Covered in this Market Research and Growth Report?

  • CAGR of the market during the forecast period
  • Detailed information on factors that will drive the market growth and forecasting between 2024 and 2028
  • Precise estimation of the size of the market  and its contribution of the market in focus to the parent market
  • Accurate predictions about upcoming market growth and trends and changes in consumer behaviour
  • Growth of the market across North America, Europe, APAC, Middle East and Africa, and South America
  • Thorough analysis of the market's competitive landscape and detailed information about companies
  • Comprehensive analysis of factors that will challenge the growth of market companies

We can help! Our analysts can customize this market research report to meet your requirements. Get in touch

1 Executive Summary

  • 1.1 Market overview
    • Exhibit 01: Executive Summary – Chart on Market Overview
    • Exhibit 02: Executive Summary – Data Table on Market Overview
    • Exhibit 03: Executive Summary – Chart on Global Market Characteristics
    • Exhibit 04: Executive Summary – Chart on Market by Geography
    • Exhibit 05: Executive Summary – Chart on Market Segmentation by Deployment
    • Exhibit 06: Executive Summary – Chart on Market Segmentation by End-user
    • Exhibit 07: Executive Summary – Chart on Incremental Growth
    • Exhibit 08: Executive Summary – Data Table on Incremental Growth
    • Exhibit 09: Executive Summary – Chart on Vendor Market Positioning

2 Market Landscape

  • 2.1 Market ecosystem
    • Exhibit 10: Parent market
    • Exhibit 11: Market Characteristics

3 Market Sizing

  • 3.1 Market definition
    • Exhibit 12: Offerings of vendors included in the market definition
  • 3.2 Market segment analysis
    • Exhibit 13: Market segments
  • 3.3 Market size 2023
    • 3.4 Market outlook: Forecast for 2023-2028
      • Exhibit 14: Chart on Global - Market size and forecast 2023-2028 ($ million)
      • Exhibit 15: Data Table on Global - Market size and forecast 2023-2028 ($ million)
      • Exhibit 16: Chart on Global Market: Year-over-year growth 2023-2028 (%)
      • Exhibit 17: Data Table on Global Market: Year-over-year growth 2023-2028 (%)

    4 Five Forces Analysis

    • 4.1 Five forces summary
      • Exhibit 18: Five forces analysis - Comparison between 2023 and 2028
    • 4.2 Bargaining power of buyers
      • Exhibit 19: Chart on Bargaining power of buyers – Impact of key factors 2023 and 2028
    • 4.3 Bargaining power of suppliers
      • Exhibit 20: Bargaining power of suppliers – Impact of key factors in 2023 and 2028
    • 4.4 Threat of new entrants
      • Exhibit 21: Threat of new entrants – Impact of key factors in 2023 and 2028
    • 4.5 Threat of substitutes
      • Exhibit 22: Threat of substitutes – Impact of key factors in 2023 and 2028
    • 4.6 Threat of rivalry
      • Exhibit 23: Threat of rivalry – Impact of key factors in 2023 and 2028
    • 4.7 Market condition
      • Exhibit 24: Chart on Market condition - Five forces 2023 and 2028

    5 Market Segmentation by Deployment

    • 5.1 Market segments
      • Exhibit 25: Chart on Deployment - Market share 2023-2028 (%)
      • Exhibit 26: Data Table on Deployment - Market share 2023-2028 (%)
    • 5.2 Comparison by Deployment
      • Exhibit 27: Chart on Comparison by Deployment
      • Exhibit 28: Data Table on Comparison by Deployment
    • 5.3 Cloud - Market size and forecast 2023-2028
      • Exhibit 29: Chart on Cloud - Market size and forecast 2023-2028 ($ million)
      • Exhibit 30: Data Table on Cloud - Market size and forecast 2023-2028 ($ million)
      • Exhibit 31: Chart on Cloud - Year-over-year growth 2023-2028 (%)
      • Exhibit 32: Data Table on Cloud - Year-over-year growth 2023-2028 (%)
    • 5.4 On-premises - Market size and forecast 2023-2028
      • Exhibit 33: Chart on On-premises - Market size and forecast 2023-2028 ($ million)
      • Exhibit 34: Data Table on On-premises - Market size and forecast 2023-2028 ($ million)
      • Exhibit 35: Chart on On-premises - Year-over-year growth 2023-2028 (%)
      • Exhibit 36: Data Table on On-premises - Year-over-year growth 2023-2028 (%)
    • 5.5 Market opportunity by Deployment
      • Exhibit 37: Market opportunity by Deployment ($ million)
      • Exhibit 38: Data Table on Market opportunity by Deployment ($ million)

    6 Market Segmentation by End-user

    • 6.1 Market segments
      • Exhibit 39: Chart on End-user - Market share 2023-2028 (%)
      • Exhibit 40: Data Table on End-user - Market share 2023-2028 (%)
    • 6.2 Comparison by End-user
      • Exhibit 41: Chart on Comparison by End-user
      • Exhibit 42: Data Table on Comparison by End-user
    • 6.3 Healthcare and life sciences - Market size and forecast 2023-2028
      • Exhibit 43: Chart on Healthcare and life sciences - Market size and forecast 2023-2028 ($ million)
      • Exhibit 44: Data Table on Healthcare and life sciences - Market size and forecast 2023-2028 ($ million)
      • Exhibit 45: Chart on Healthcare and life sciences - Year-over-year growth 2023-2028 (%)
      • Exhibit 46: Data Table on Healthcare and life sciences - Year-over-year growth 2023-2028 (%)
    • 6.4 BFSI - Market size and forecast 2023-2028
      • Exhibit 47: Chart on BFSI - Market size and forecast 2023-2028 ($ million)
      • Exhibit 48: Data Table on BFSI - Market size and forecast 2023-2028 ($ million)
      • Exhibit 49: Chart on BFSI - Year-over-year growth 2023-2028 (%)
      • Exhibit 50: Data Table on BFSI - Year-over-year growth 2023-2028 (%)
    • 6.5 Retail and e-commerce - Market size and forecast 2023-2028
      • Exhibit 51: Chart on Retail and e-commerce - Market size and forecast 2023-2028 ($ million)
      • Exhibit 52: Data Table on Retail and e-commerce - Market size and forecast 2023-2028 ($ million)
      • Exhibit 53: Chart on Retail and e-commerce - Year-over-year growth 2023-2028 (%)
      • Exhibit 54: Data Table on Retail and e-commerce - Year-over-year growth 2023-2028 (%)
    • 6.6 Transportation and logistics - Market size and forecast 2023-2028
      • Exhibit 55: Chart on Transportation and logistics - Market size and forecast 2023-2028 ($ million)
      • Exhibit 56: Data Table on Transportation and logistics - Market size and forecast 2023-2028 ($ million)
      • Exhibit 57: Chart on Transportation and logistics - Year-over-year growth 2023-2028 (%)
      • Exhibit 58: Data Table on Transportation and logistics - Year-over-year growth 2023-2028 (%)
    • 6.7 Others - Market size and forecast 2023-2028
      • Exhibit 59: Chart on Others - Market size and forecast 2023-2028 ($ million)
      • Exhibit 60: Data Table on Others - Market size and forecast 2023-2028 ($ million)
      • Exhibit 61: Chart on Others - Year-over-year growth 2023-2028 (%)
      • Exhibit 62: Data Table on Others - Year-over-year growth 2023-2028 (%)
    • 6.8 Market opportunity by End-user
      • Exhibit 63: Market opportunity by End-user ($ million)
      • Exhibit 64: Data Table on Market opportunity by End-user ($ million)

    7 Customer Landscape

    • 7.1 Customer landscape overview
      • Exhibit 65: Analysis of price sensitivity, lifecycle, customer purchase basket, adoption rates, and purchase criteria

    8 Geographic Landscape

    • 8.1 Geographic segmentation
      • Exhibit 66: Chart on Market share by geography 2023-2028 (%)
      • Exhibit 67: Data Table on Market share by geography 2023-2028 (%)
    • 8.2 Geographic comparison
      • Exhibit 68: Chart on Geographic comparison
      • Exhibit 69: Data Table on Geographic comparison
    • 8.3 North America - Market size and forecast 2023-2028
      • Exhibit 70: Chart on North America - Market size and forecast 2023-2028 ($ million)
      • Exhibit 71: Data Table on North America - Market size and forecast 2023-2028 ($ million)
      • Exhibit 72: Chart on North America - Year-over-year growth 2023-2028 (%)
      • Exhibit 73: Data Table on North America - Year-over-year growth 2023-2028 (%)
    • 8.4 Europe - Market size and forecast 2023-2028
      • Exhibit 74: Chart on Europe - Market size and forecast 2023-2028 ($ million)
      • Exhibit 75: Data Table on Europe - Market size and forecast 2023-2028 ($ million)
      • Exhibit 76: Chart on Europe - Year-over-year growth 2023-2028 (%)
      • Exhibit 77: Data Table on Europe - Year-over-year growth 2023-2028 (%)
    • 8.5 APAC - Market size and forecast 2023-2028
      • Exhibit 78: Chart on APAC - Market size and forecast 2023-2028 ($ million)
      • Exhibit 79: Data Table on APAC - Market size and forecast 2023-2028 ($ million)
      • Exhibit 80: Chart on APAC - Year-over-year growth 2023-2028 (%)
      • Exhibit 81: Data Table on APAC - Year-over-year growth 2023-2028 (%)
    • 8.6 Middle East and Africa - Market size and forecast 2023-2028
      • Exhibit 82: Chart on Middle East and Africa - Market size and forecast 2023-2028 ($ million)
      • Exhibit 83: Data Table on Middle East and Africa - Market size and forecast 2023-2028 ($ million)
      • Exhibit 84: Chart on Middle East and Africa - Year-over-year growth 2023-2028 (%)
      • Exhibit 85: Data Table on Middle East and Africa - Year-over-year growth 2023-2028 (%)
    • 8.7 South America - Market size and forecast 2023-2028
      • Exhibit 86: Chart on South America - Market size and forecast 2023-2028 ($ million)
      • Exhibit 87: Data Table on South America - Market size and forecast 2023-2028 ($ million)
      • Exhibit 88: Chart on South America - Year-over-year growth 2023-2028 (%)
      • Exhibit 89: Data Table on South America - Year-over-year growth 2023-2028 (%)
    • 8.8 US - Market size and forecast 2023-2028
      • Exhibit 90: Chart on US - Market size and forecast 2023-2028 ($ million)
      • Exhibit 91: Data Table on US - Market size and forecast 2023-2028 ($ million)
      • Exhibit 92: Chart on US - Year-over-year growth 2023-2028 (%)
      • Exhibit 93: Data Table on US - Year-over-year growth 2023-2028 (%)
    • 8.9 China - Market size and forecast 2023-2028
      • Exhibit 94: Chart on China - Market size and forecast 2023-2028 ($ million)
      • Exhibit 95: Data Table on China - Market size and forecast 2023-2028 ($ million)
      • Exhibit 96: Chart on China - Year-over-year growth 2023-2028 (%)
      • Exhibit 97: Data Table on China - Year-over-year growth 2023-2028 (%)
    • 8.10 Germany - Market size and forecast 2023-2028
      • Exhibit 98: Chart on Germany - Market size and forecast 2023-2028 ($ million)
      • Exhibit 99: Data Table on Germany - Market size and forecast 2023-2028 ($ million)
      • Exhibit 100: Chart on Germany - Year-over-year growth 2023-2028 (%)
      • Exhibit 101: Data Table on Germany - Year-over-year growth 2023-2028 (%)
    • 8.11 UK - Market size and forecast 2023-2028
      • Exhibit 102: Chart on UK - Market size and forecast 2023-2028 ($ million)
      • Exhibit 103: Data Table on UK - Market size and forecast 2023-2028 ($ million)
      • Exhibit 104: Chart on UK - Year-over-year growth 2023-2028 (%)
      • Exhibit 105: Data Table on UK - Year-over-year growth 2023-2028 (%)
    • 8.12 France - Market size and forecast 2023-2028
      • Exhibit 106: Chart on France - Market size and forecast 2023-2028 ($ million)
      • Exhibit 107: Data Table on France - Market size and forecast 2023-2028 ($ million)
      • Exhibit 108: Chart on France - Year-over-year growth 2023-2028 (%)
      • Exhibit 109: Data Table on France - Year-over-year growth 2023-2028 (%)
    • 8.13 Market opportunity by geography
      • Exhibit 110: Market opportunity by geography ($ million)
      • Exhibit 111: Data Tables on Market opportunity by geography ($ million)

    9 Drivers, Challenges, and Trends

    • 9.1 Market drivers
      • 9.2 Market challenges
        • 9.3 Impact of drivers and challenges
          • Exhibit 112: Impact of drivers and challenges in 2023 and 2028
        • 9.4 Market trends

          10 Vendor Landscape

          • 10.1 Overview
            • 10.2 Vendor landscape
              • Exhibit 113: Overview on Criticality of inputs and Factors of differentiation
            • 10.3 Landscape disruption
              • Exhibit 114: Overview on factors of disruption
            • 10.4 Industry risks
              • Exhibit 115: Impact of key risks on business

            11 Vendor Analysis

            • 11.1 Vendors covered
              • Exhibit 116: Vendors covered
            • 11.2 Market positioning of vendors
              • Exhibit 117: Matrix on vendor position and classification
            • 11.3 Aitia
              • Exhibit 118: Aitia - Overview
              • Exhibit 119: Aitia - Product / Service
              • Exhibit 120: Aitia - Key offerings
            • 11.4 Alphabet Inc.
              • Exhibit 121: Alphabet Inc. - Overview
              • Exhibit 122: Alphabet Inc. - Business segments
              • Exhibit 123: Alphabet Inc. - Key news
              • Exhibit 124: Alphabet Inc. - Key offerings
              • Exhibit 125: Alphabet Inc. - Segment focus
            • 11.5 Amazon.com Inc.
              • Exhibit 126: Amazon.com Inc. - Overview
              • Exhibit 127: Amazon.com Inc. - Business segments
              • Exhibit 128: Amazon.com Inc. - Key news
              • Exhibit 129: Amazon.com Inc. - Key offerings
              • Exhibit 130: Amazon.com Inc. - Segment focus
            • 11.6 AMERICAN SOFTWARE INC.
              • Exhibit 131: AMERICAN SOFTWARE INC. - Overview
              • Exhibit 132: AMERICAN SOFTWARE INC. - Business segments
              • Exhibit 133: AMERICAN SOFTWARE INC. - Key offerings
              • Exhibit 134: AMERICAN SOFTWARE INC. - Segment focus
            • 11.7 causaLens
              • Exhibit 135: causaLens - Overview
              • Exhibit 136: causaLens - Product / Service
              • Exhibit 137: causaLens - Key offerings
            • 11.8 Cognino.ai
              • Exhibit 138: Cognino.ai - Overview
              • Exhibit 139: Cognino.ai - Product / Service
              • Exhibit 140: Cognino.ai - Key offerings
            • 11.9 Cognizant Technology Solutions Corp.
              • Exhibit 141: Cognizant Technology Solutions Corp. - Overview
              • Exhibit 142: Cognizant Technology Solutions Corp. - Business segments
              • Exhibit 143: Cognizant Technology Solutions Corp. - Key offerings
              • Exhibit 144: Cognizant Technology Solutions Corp. - Segment focus
            • 11.10 Geminos Software
              • Exhibit 145: Geminos Software - Overview
              • Exhibit 146: Geminos Software - Product / Service
              • Exhibit 147: Geminos Software - Key offerings
            • 11.11 H2O.ai Inc.
              • Exhibit 148: H2O.ai Inc. - Overview
              • Exhibit 149: H2O.ai Inc. - Product / Service
              • Exhibit 150: H2O.ai Inc. - Key offerings
            • 11.12 INCRMNTAL Ltd.
              • Exhibit 151: INCRMNTAL Ltd. - Overview
              • Exhibit 152: INCRMNTAL Ltd. - Product / Service
              • Exhibit 153: INCRMNTAL Ltd. - Key offerings
            • 11.13 International Business Machines Corp.
              • Exhibit 154: International Business Machines Corp. - Overview
              • Exhibit 155: International Business Machines Corp. - Business segments
              • Exhibit 156: International Business Machines Corp. - Key news
              • Exhibit 157: International Business Machines Corp. - Key offerings
              • Exhibit 158: International Business Machines Corp. - Segment focus
            • 11.14 Meta Platforms Inc.
              • Exhibit 159: Meta Platforms Inc. - Overview
              • Exhibit 160: Meta Platforms Inc. - Product / Service
              • Exhibit 161: Meta Platforms Inc. - Key offerings
            • 11.15 Microsoft Corp.
              • Exhibit 162: Microsoft Corp. - Overview
              • Exhibit 163: Microsoft Corp. - Business segments
              • Exhibit 164: Microsoft Corp. - Key news
              • Exhibit 165: Microsoft Corp. - Key offerings
              • Exhibit 166: Microsoft Corp. - Segment focus
            • 11.16 OpenAI L.L.C.
              • Exhibit 167: OpenAI L.L.C. - Overview
              • Exhibit 168: OpenAI L.L.C. - Product / Service
              • Exhibit 169: OpenAI L.L.C. - Key offerings
            • 11.17 Xplain Data GmbH
              • Exhibit 170: Xplain Data GmbH - Overview
              • Exhibit 171: Xplain Data GmbH - Product / Service
              • Exhibit 172: Xplain Data GmbH - Key offerings

            12 Appendix

            • 12.1 Scope of the report
              • 12.2 Inclusions and exclusions checklist
                • Exhibit 173: Inclusions checklist
                • Exhibit 174: Exclusions checklist
              • 12.3 Currency conversion rates for US$
                • Exhibit 175: Currency conversion rates for US$
              • 12.4 Research methodology
                • Exhibit 176: Research methodology
                • Exhibit 177: Validation techniques employed for market sizing
                • Exhibit 178: Information sources
              • 12.5 List of abbreviations
                • Exhibit 179: List of abbreviations

              Research Methodology

              Technavio presents a detailed picture of the market by way of study, synthesis, and summation of data from multiple sources. The analysts have presented the various facets of the market with a particular focus on identifying the key industry influencers. The data thus presented is comprehensive, reliable, and the result of extensive research, both primary and secondary.

              INFORMATION SOURCES

              Primary sources

              • Manufacturers and suppliers
              • Channel partners
              • Industry experts
              • Strategic decision makers

              Secondary sources

              • Industry journals and periodicals
              • Government data
              • Financial reports of key industry players
              • Historical data
              • Press releases

              DATA ANALYSIS

              Data Synthesis

              • Collation of data
              • Estimation of key figures
              • Analysis of derived insights

              Data Validation

              • Triangulation with data models
              • Reference against proprietary databases
              • Corroboration with industry experts

              REPORT WRITING

              Qualitative

              • Market drivers
              • Market challenges
              • Market trends
              • Five forces analysis

              Quantitative

              • Market size and forecast
              • Market segmentation
              • Geographical insights
              • Competitive landscape

              Interested in this report?

              Get your sample now to see our research methodology and insights!

              Download Now

              Frequently Asked Questions

              Causal AI market growth will increase by $ 110.9 mn during 2024-2028.

              The Causal AI market is expected to grow at a CAGR of 39.7% during 2024-2028.

              Causal AI market is segmented by Deployment( Cloud, On-premises) End-user( Healthcare and life sciences, BFSI, Retail and e-commerce, Transportation and logistics, Others)

              Aitia, Alphabet Inc., Amazon.com Inc., AMERICAN SOFTWARE INC., causaLens, Causality Link LLC, Cognino.ai, Cognizant Technology Solutions Corp., DataRobot Inc., Dynatrace Inc., Geminos Software, H2O.ai Inc., INCRMNTAL Ltd., International Business Machines Corp., Meta Platforms Inc., Microsoft Corp., OpenAI L.L.C., Parabole.ai, Scalnyx, Xplain Data GmbH are a few of the key vendors in the Causal AI market.

              North America will register the highest growth rate of 44% among the other regions. Therefore, the Causal AI market in North America is expected to garner significant business opportunities for the vendors during the forecast period.

              US, China, Germany, UK, France

              • Growing innovation of causal AI in healthcare and financeIn healthcare is the driving factor this market.
              • causal AI models are being developed to analyze large datasets is the driving factor this market.
              • including electronic health records is the driving factor this market.
              • genomic data is the driving factor this market.
              • and patient history is the driving factor this market.
              • to predict the likelihood of diseases and assist in early diagnosis. AI is used to tailor treatment plans based on individual patient characteristics is the driving factor this market.
              • considering genetic factors is the driving factor this market.
              • lifestyle is the driving factor this market.
              • and responses to specific medications. Furthermore is the driving factor this market.
              • causal AI accelerates drug discovery processes by analyzing biological data to identify potential drug candidates and predict their efficacy and safety. In regular hospital usage is the driving factor this market.
              • AI-powered chatbots provide instant medical information is the driving factor this market.
              • answer queries is the driving factor this market.
              • and assist with appointment scheduling is the driving factor this market.
              • contributing to improved patient engagement. In finance is the driving factor this market.
              • causal AI models analyze patterns and anomalies in financial transactions to detect and prevent fraudulent activities in real time. Moreover is the driving factor this market.
              • it is used to assess creditworthiness by analyzing various data sources is the driving factor this market.
              • leading to more accurate and fair credit scoring models. AI analyzes news is the driving factor this market.
              • social media is the driving factor this market.
              • and other sources to gauge market sentiment is the driving factor this market.
              • helping financial professionals make informed investment decisions. To prevent cyber-attacks in finance sectors is the driving factor this market.
              • causal AI is used to predict potentially fraudulent activities by identifying subtle patterns and anomalies in financial data. User experiences developed in healthcare and finance is the driving factor this market.
              • such as personalized recommendations is the driving factor this market.
              • efficient services is the driving factor this market.
              • and real-time insights is the driving factor this market.
              • set a benchmark for what users expect from AI applications; thus is the driving factor this market.
              • growing innovation of causal AI in healthcare and finance is expected to fuel global causal AI market growth during the forecast period. is the driving factor this market.

              The Causal AI market vendors should focus on grabbing business opportunities from the Cloud segment as it accounted for the largest market share in the base year.
              RIA - Research AI Assistant
              Ask RIA
