CCUS Software Platforms Market Analysis, Size, and Forecast 2026-2030: North America (US, Canada, and Mexico), Europe (Germany, UK, and France), APAC (China, Japan, and India), Middle East and Africa (Saudi Arabia, UAE, and South Africa), South America (Brazil, Argentina, and Colombia), and Rest of World (ROW)

CCUS Software Platforms Market Analysis, Size, and Forecast 2026-2030:
North America (US, Canada, and Mexico), Europe (Germany, UK, and France), APAC (China, Japan, and India), Middle East and Africa (Saudi Arabia, UAE, and South Africa), South America (Brazil, Argentina, and Colombia), and Rest of World (ROW)

Published: Mar 2026 316 Pages SKU: IRTNTR81315

Market Overview at a Glance

$583.3 Mn
Market Opportunity
11.8%
CAGR 2025 - 2030
40.2%
North America Growth
$471 Mn
Cloud based segment 2024

CCUS Software Platforms Market Size 2026-2030

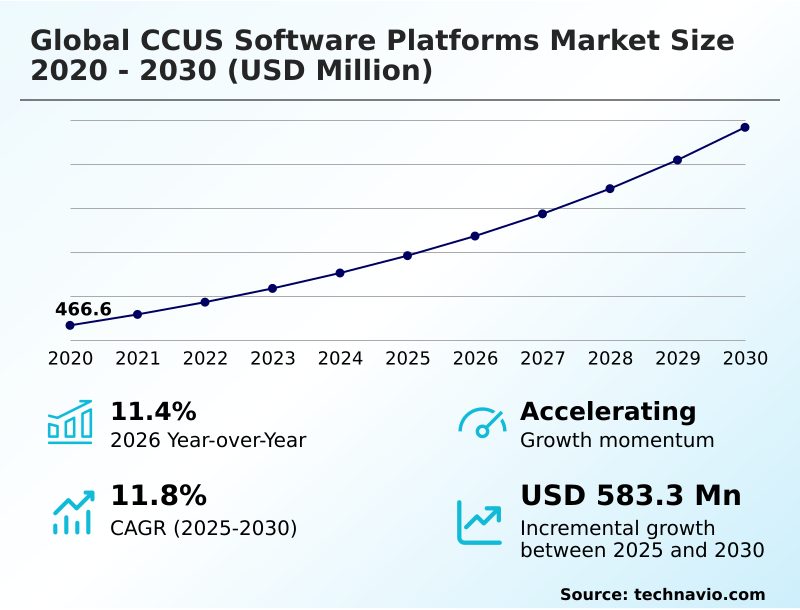
The ccus software platforms market size is valued to increase by USD 583.3 million, at a CAGR of 11.8% from 2025 to 2030. Stringent regulatory frameworks and evolution of carbon pricing mechanisms will drive the ccus software platforms market.

Major Market Trends & Insights

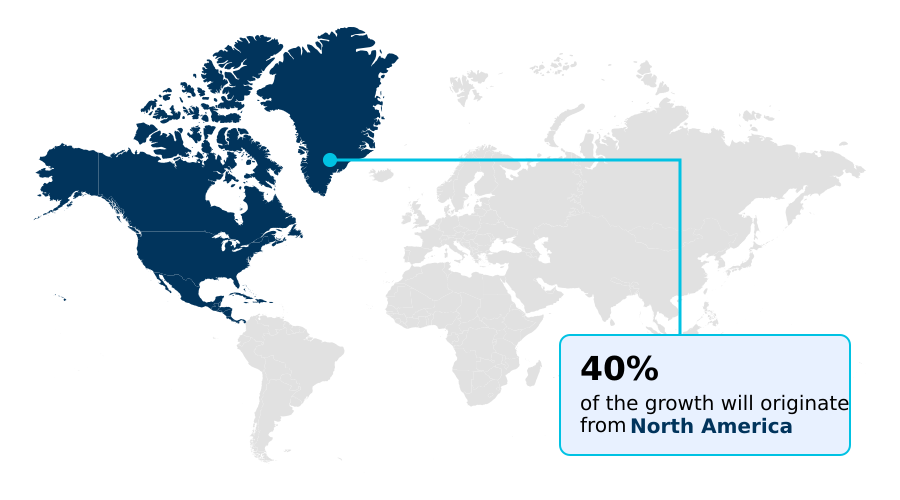
  • North America dominated the market and accounted for a 40.2% growth during the forecast period.
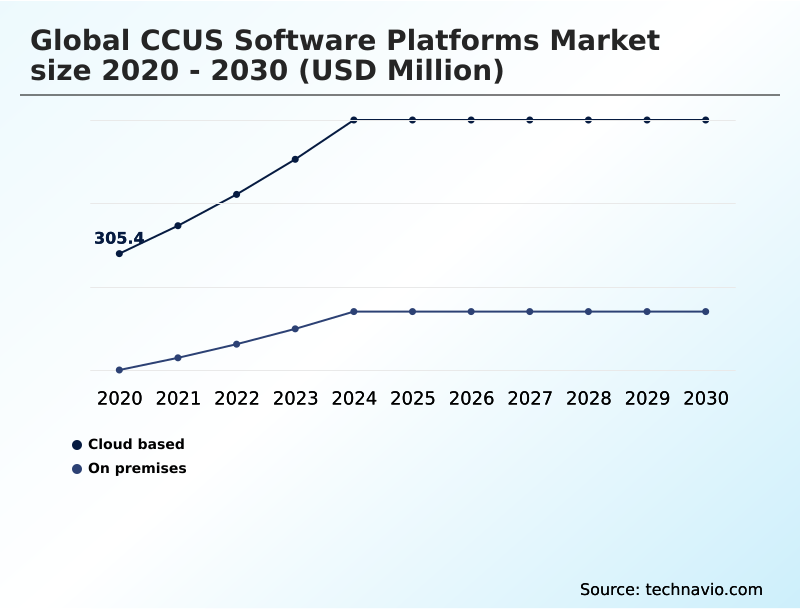
  • By Deployment - Cloud based segment was valued at USD 471 million in 2024
  • By Type - Monitoring and control platforms segment accounted for the largest market revenue share in 2024

Market Size & Forecast

  • Market Opportunities: USD 900.1 million
  • Market Future Opportunities: USD 583.3 million
  • CAGR from 2025 to 2030 : 11.8%

Market Summary

  • The CCUS software platforms market provides a sophisticated suite of digital tools for the end-to-end management of the carbon value chain. These platforms are engineered to facilitate the complex processes of capturing, transporting, and storing carbon dioxide, which is critical for heavy industries aiming to meet net-zero targets.
  • Utilizing advanced analytics, these systems enable precise carbon capture modeling and efficient process control systems to minimize the energy penalty in facilities. Furthermore, they offer robust geological sequestration monitoring and carbon plume modeling to ensure the long-term integrity of storage sites.
  • A key application involves an integrated emissions tracking software that automates regulatory compliance reporting for international frameworks, streamlining the verification of carbon credits. For instance, an operator of a large industrial cluster can leverage predictive maintenance modules to anticipate equipment failures in the transport network, preventing costly downtime and ensuring a continuous flow of CO2.
  • The market is defined by its role in providing the data-driven precision required to make carbon management technologically viable, economically feasible, and environmentally secure. This digital infrastructure is indispensable for tracking atmospheric emissions and assessing the safety of sequestration projects, thereby building stakeholder confidence.

What will be the Size of the CCUS Software Platforms Market during the forecast period?

Get Key Insights on Market Forecast (PDF) Request Free Sample

How is the CCUS Software Platforms Market Segmented?

The ccus software platforms industry research report provides comprehensive data (region-wise segment analysis), with forecasts and estimates in "USD million" for the period 2026-2030, as well as historical data from 2020-2024 for the following segments.

  • Deployment
    • Cloud based
    • On premises
  • Type
    • Monitoring and control platforms
    • Optimization and simulation software
    • Data analytics and reporting tools
    • Integration and management platforms
  • End-user
    • Oil and gas
    • Power generation
    • Cement
    • Others
  • Geography
    • North America
      • US
      • Canada
      • Mexico
    • Europe
      • Germany
      • UK
      • France
    • APAC
      • China
      • Japan
      • India
    • Middle East and Africa
      • Saudi Arabia
      • UAE
      • South Africa
    • South America
      • Brazil
      • Argentina
      • Colombia
    • Rest of World (ROW)

By Deployment Insights

The cloud based segment is estimated to witness significant growth during the forecast period.

Cloud-based deployment models are transforming carbon management by providing scalable, collaborative ecosystems essential for modern industrial decarbonization. These platforms leverage high-performance computing for intensive tasks like subsurface data analytics and simulation, removing the need for significant on-premise hardware investment.

This approach supports a carbon as a service platform model, enabling smaller operators to access advanced tools for monitoring, reporting, and verification.

For large, multi-user carbon infrastructure projects, a cloud platform serves as a single source of truth, synchronizing data from industrial automation software and pipeline telemetry systems in real time. This ensures accurate carbon accounting verification and streamlines compliance.

Organizations utilizing this model have reported up to a 20% improvement in data accessibility for remote monitoring teams.

Request Free Sample

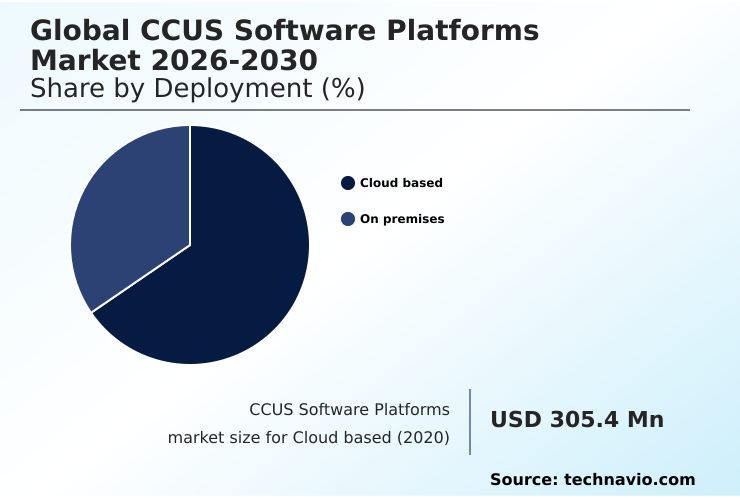
The Cloud based segment was valued at USD 471 million in 2024 and showed a gradual increase during the forecast period.

Request Free Sample

Regional Analysis

North America is estimated to contribute 40.2% to the growth of the global market during the forecast period.Technavio’s analysts have elaborately explained the regional trends and drivers that shape the market during the forecast period.

See How CCUS Software Platforms Market Demand is Rising in North America Request Free Sample

North America dominates the market, propelled by robust regulatory incentives in the United States and Canada that mandate enterprise-grade carbon tracking.

The region accounts for over 40% of the incremental growth opportunity, with operators leveraging advanced software for enhanced oil recovery modeling and injection well optimization.

European hubs in the UK and Norway are pioneers in subsea sequestration monitoring, utilizing platforms that integrate real-time leakage detection and asset performance management for offshore infrastructure.

The APAC region, led by Australia, is rapidly adopting these digital tools to manage shared carbon infrastructure and enable decarbonization workflow automation.

This geographic disparity highlights a market where mature regions focus on optimizing existing operations, while emerging markets prioritize establishing the foundational digital frameworks for future large-scale projects.

Market Dynamics

Our researchers analyzed the data with 2025 as the base year, along with the key drivers, trends, and challenges. A holistic analysis of drivers will help companies refine their marketing strategies to gain a competitive advantage.

  • The strategic implementation of specialized digital tools is becoming central to navigating the complex landscape of carbon management. Platforms offering software for 45q tax credit compliance are essential for operators in the United States seeking to monetize decarbonization efforts.
  • Technologically, the focus is on efficiency gains, with tools to optimize amine scrubbing with ai and automate direct air capture process control, which can reduce energy penalties. For storage, simulating co2 plume behavior in saline aquifers and integrating seismic data for reservoir selection are critical for long-term project viability.
  • The logistics of managing multi-user carbon pipeline networks and coordinating cross-border carbon dioxide shipments are handled by integrated platforms that provide real-time telemetry for co2 pipelines. In offshore environments, real-time monitoring for subsea carbon storage and ai-powered caprock integrity analysis are non-negotiable for safety.
  • Sector-specific applications, like a digital twin for natural gas power plant ccus or software for cement plant decarbonization, are gaining traction. These systems also facilitate new economic models, with tools for verifying carbon credits with blockchain and conducting lifecycle assessment for carbon utilization.
  • Adherence to strict regulatory mandates, such as managing class vi injection well compliance and using reporting tools for eu emissions trading system, is another key function. Overall, companies using integrated platforms for calculating embodied carbon footprint in infrastructure have reported a more streamlined project planning process compared to those using disconnected tools.

What are the key market drivers leading to the rise in the adoption of CCUS Software Platforms Industry?

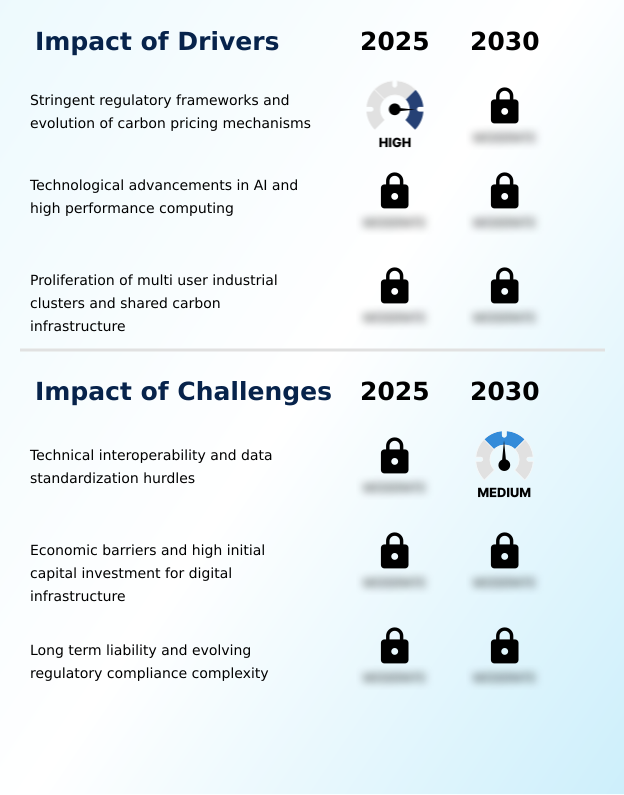
  • Stringent regulatory frameworks and the evolution of carbon pricing mechanisms are the primary drivers propelling market expansion.

  • Stringent regulations and carbon pricing, such as the carbon border adjustment mechanism, are primary market drivers.
  • These policies necessitate the use of sophisticated software for lifecycle emissions calculation and transparent reporting, with integrated carbon credit generation tools directly linking decarbonization efforts to financial returns.
  • Technologically, advancements in AI are transforming subsurface analysis, enabling automated geological fault identification and reducing site evaluation times by up to 40%.
  • For operational efficiency, the proliferation of industrial hubs requires platforms with multi-tenant digital management and advanced injection pressure management capabilities.
  • An environmental intelligence platform that provides a single, auditable record for all stakeholders is now essential for managing these collaborative, large-scale projects.

What are the market trends shaping the CCUS Software Platforms Industry?

  • The integration of advanced digital twins and high-fidelity physics-based modeling is an influential trend. It provides a sophisticated bridge between physical assets and digital oversight for the entire project lifecycle.

  • A dominant trend is the use of digital twins that leverage high-fidelity physics, including computational fluid dynamics and thermodynamic property modeling, to simulate the entire integrated carbon value chain. These platforms enhance operational oversight, with some systems improving energy efficiency in capture units by up to 10%.
  • The application of AI and machine learning for interpreting massive datasets from IoT for carbon monitoring and microseismic sensor analysis is another key development. This is enabling automated geological modeling and enhancing the use of subsurface imaging platforms for rapid site characterization.
  • The ability to predict CO2 behavior with greater than 95% accuracy in simulations is becoming a critical factor for securing project financing and regulatory approval.

What challenges does the CCUS Software Platforms Industry face during its growth?

  • Technical interoperability issues and a lack of data standardization across the value chain present a significant challenge to seamless market growth.

  • A significant challenge is the lack of technical interoperability, which fragments carbon lifecycle management and complicates the integration of subsurface models with process engineering data integration. This creates data silos that can impede real-time monitoring and holistic caprock stability assessment.
  • The high initial capital required for sensors and computing infrastructure also presents a barrier, with implementation costs sometimes exceeding software license fees by a factor of three. Furthermore, evolving regulations demand robust digital solutions, such as asset integrity software incorporating tamper-proof data logs, to manage long-term liability.
  • This complexity slows adoption, particularly for emerging applications like co2 mineralization software, which requires a seamless unified data environment to be effective.

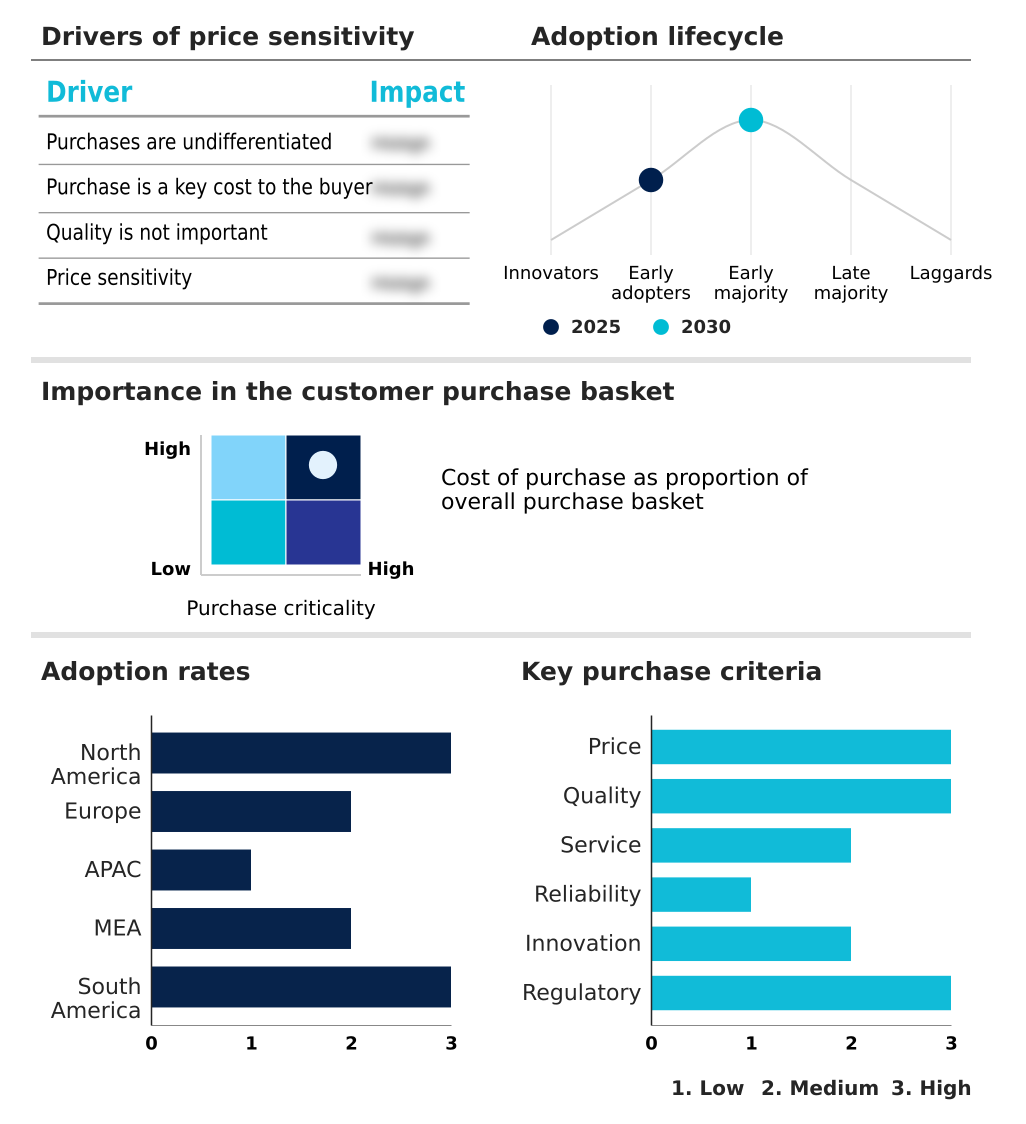
Exclusive Technavio Analysis on Customer Landscape

The ccus software platforms market forecasting report includes the adoption lifecycle of the market, covering from the innovator’s stage to the laggard’s stage. It focuses on adoption rates in different regions based on penetration. Furthermore, the ccus software platforms market report also includes key purchase criteria and drivers of price sensitivity to help companies evaluate and develop their market growth analysis strategies.

Customer Landscape of CCUS Software Platforms Industry

Competitive Landscape

Companies are implementing various strategies, such as strategic alliances, ccus software platforms market forecast, partnerships, mergers and acquisitions, geographical expansion, and product/service launches, to enhance their presence in the industry.

ANSYS Inc. - Key offerings provide end-to-end digital orchestration for carbon value chains, integrating capture facility monitoring, transport logistics, and subsurface storage management through a unified data environment.

The industry research and growth report includes detailed analyses of the competitive landscape of the market and information about key companies, including:

  • ANSYS Inc.
  • AVEVA Group Ltd.
  • Baker Hughes Co.
  • Bentley Systems Inc.
  • CGG SA
  • Dassault Systemes SE
  • DNV Group AS
  • Emerson Electric Co.
  • Halliburton Co.
  • Honeywell International Inc.
  • IBM Corp.
  • Kongsberg Gruppen ASA
  • Microsoft Corp.
  • Rockwell Automation Inc.
  • S and P Global Inc.
  • SAP SE
  • Schlumberger Ltd.
  • Siemens AG
  • TGS ASA
  • Yokogawa Electric Corp.

Qualitative and quantitative analysis of companies has been conducted to help clients understand the wider business environment as well as the strengths and weaknesses of key industry players. Data is qualitatively analyzed to categorize companies as pure play, category-focused, industry-focused, and diversified; it is quantitatively analyzed to categorize companies as dominant, leading, strong, tentative, and weak.

Recent Development and News in Ccus software platforms market

  • In August 2025, Halliburton introduced an updated version of its subsurface modeling software that incorporates generative artificial intelligence to automate the creation of high-resolution geological models for carbon sequestration.
  • In May 2025, the International Organization for Standardization finalized a revised framework for digital data exchange in carbon sequestration projects to address fragmentation issues.
  • In October 2025, the Northern Lights project in Norway activated a new multi-tenant digital management interface to coordinate the arrival and injection schedules of carbon dioxide shipments from diverse industrial emitters across Northern Europe.
  • In April 2025, the United States Department of Energy finalized a new set of digital reporting standards for federally funded carbon management projects, requiring the use of interoperable software platforms.

Dive into Technavio’s robust research methodology, blending expert interviews, extensive data synthesis, and validated models for unparalleled CCUS Software Platforms Market insights. See full methodology.

Market Scope
Page number 316
Base year 2025
Historic period 2020-2024
Forecast period 2026-2030
Growth momentum & CAGR Accelerate at a CAGR of 11.8%
Market growth 2026-2030 USD 583.3 million
Market structure Fragmented
YoY growth 2025-2026(%) 11.4%
Key countries US, Canada, Mexico, Germany, UK, France, Italy, The Netherlands, Spain, China, Japan, India, South Korea, Australia, Indonesia, Saudi Arabia, UAE, South Africa, Israel, Turkey, Brazil, Argentina and Colombia
Competitive landscape Leading Companies, Market Positioning of Companies, Competitive Strategies, and Industry Risks

Request Free Sample

Research Analyst Overview

  • The CCUS software platforms market is evolving from niche engineering tools to integrated, enterprise-level digital ecosystems. The convergence of operational technology and information technology is driving this shift, with platforms now combining subsurface reservoir simulation for site selection with real-time process control systems for amine scrubbing optimization.
  • A key trend is the deployment of physics-based digital twins that encompass the entire value chain, from carbon capture modeling and supercritical co2 modeling for transport to geological sequestration monitoring. These systems provide a holistic view, enabling predictive maintenance modules that improve asset uptime by over 15%.
  • Boardroom decisions are increasingly influenced by the capabilities of emissions tracking software to provide transparent carbon accounting verification, which is essential for accessing green financing and ensuring regulatory adherence. The integration of subsurface data analytics for reservoir integrity assessment and real-time leakage detection is now a standard requirement, transforming long-term risk management from a reactive to a proactive discipline.

What are the Key Data Covered in this CCUS Software Platforms Market Research and Growth Report?

  • What is the expected growth of the CCUS Software Platforms Market between 2026 and 2030?

    • USD 583.3 million, at a CAGR of 11.8%

  • What segmentation does the market report cover?

    • The report is segmented by Deployment (Cloud based, and On premises), Type (Monitoring and control platforms, Optimization and simulation softwar, Data analytics and reporting tools, and Integration and management platforms), End-user (Oil and gas, Power generation, Cement, and Others) and Geography (North America, Europe, APAC, Middle East and Africa, South America)

  • Which regions are analyzed in the report?

    • North America, Europe, APAC, Middle East and Africa and South America

  • What are the key growth drivers and market challenges?

    • Stringent regulatory frameworks and evolution of carbon pricing mechanisms, Technical interoperability and data standardization hurdles

  • Who are the major players in the CCUS Software Platforms Market?

    • ANSYS Inc., AVEVA Group Ltd., Baker Hughes Co., Bentley Systems Inc., CGG SA, Dassault Systemes SE, DNV Group AS, Emerson Electric Co., Halliburton Co., Honeywell International Inc., IBM Corp., Kongsberg Gruppen ASA, Microsoft Corp., Rockwell Automation Inc., S and P Global Inc., SAP SE, Schlumberger Ltd., Siemens AG, TGS ASA and Yokogawa Electric Corp.

Market Research Insights

  • Market dynamics are shaped by the critical need for digital orchestration for ccus, enabling complex coordination across the value chain. Platforms leveraging high-fidelity physics modeling allow operators to achieve a 15% increase in storage site selection accuracy. The adoption of integrated solutions supports net-zero industrial act compliance, with automated reporting features reducing audit preparation times by over 25%.
  • These systems are essential for managing logistical challenges, such as cross-border carbon transport, by providing a unified interface for multi-jurisdictional regulatory adherence. The shift towards shared infrastructure models is compelling organizations to invest in scalable, cloud-native platforms to maintain a competitive edge in a rapidly decarbonizing industrial landscape.

We can help! Our analysts can customize this ccus software platforms market research report to meet your requirements.

Get in touch

1. Executive Summary

1.1 Market overview

Executive Summary - Chart on Market Overview
Executive Summary - Data Table on Market Overview
Executive Summary - Chart on Global Market Characteristics
Executive Summary - Chart on Market by Geography
Executive Summary - Chart on Market Segmentation by Deployment
Executive Summary - Chart on Market Segmentation by Type
Executive Summary - Chart on Market Segmentation by End-user
Executive Summary - Chart on Incremental Growth
Executive Summary - Data Table on Incremental Growth
Executive Summary - Chart on Company Market Positioning

2. Technavio Analysis

2.1 Analysis of price sensitivity, lifecycle, customer purchase basket, adoption rates, and purchase criteria

2.2 Criticality of inputs and Factors of differentiation

Chart on Overview on criticality of inputs and factors of differentiation

2.3 Factors of disruption

Chart on Overview on factors of disruption

2.4 Impact of drivers and challenges

Chart on Impact of drivers and challenges in 2025 and 2030

3. Market Landscape

3.1 Market ecosystem

Chart on Parent Market
Data Table on - Parent Market

3.2 Market characteristics

Chart on Market characteristics analysis

3.3 Value chain analysis

Chart on Value chain analysis

4. Market Sizing

4.1 Market definition

Data Table on Offerings of companies included in the market definition

4.2 Market segment analysis

Market segments

4.3 Market size 2025

4.4 Market outlook: Forecast for 2025-2030

Chart on Global - Market size and forecast 2025-2030 ($ million)
Data Table on Global - Market size and forecast 2025-2030 ($ million)
Chart on Global Market: Year-over-year growth 2025-2030 (%)
Data Table on Global Market: Year-over-year growth 2025-2030 (%)

5. Historic Market Size

5.1 Global CCUS Software Platforms Market 2020 - 2024

Historic Market Size - Data Table on Global CCUS Software Platforms Market 2020 - 2024 ($ million)

5.2 Deployment segment analysis 2020 - 2024

Historic Market Size - Deployment Segment 2020 - 2024 ($ million)

5.3 Type segment analysis 2020 - 2024

Historic Market Size - Type Segment 2020 - 2024 ($ million)

5.4 End-user segment analysis 2020 - 2024

Historic Market Size - End-user Segment 2020 - 2024 ($ million)

5.5 Geography segment analysis 2020 - 2024

Historic Market Size - Geography Segment 2020 - 2024 ($ million)

5.6 Country segment analysis 2020 - 2024

Historic Market Size - Country Segment 2020 - 2024 ($ million)

6. Qualitative Analysis

6.1 The AI impact on Global CCUS Software Platforms Market

7. Five Forces Analysis

7.1 Five forces summary

Five forces analysis - Comparison between 2025 and 2030

7.2 Bargaining power of buyers

Bargaining power of buyers - Impact of key factors 2025 and 2030

7.3 Bargaining power of suppliers

Bargaining power of suppliers - Impact of key factors in 2025 and 2030

7.4 Threat of new entrants

Threat of new entrants - Impact of key factors in 2025 and 2030

7.5 Threat of substitutes

Threat of substitutes - Impact of key factors in 2025 and 2030

7.6 Threat of rivalry

Threat of rivalry - Impact of key factors in 2025 and 2030

7.7 Market condition

Chart on Market condition - Five forces 2025 and 2030

8. Market Segmentation by Deployment

8.1 Market segments

Chart on Deployment - Market share 2025-2030 (%)
Data Table on Deployment - Market share 2025-2030 (%)

8.2 Comparison by Deployment

Chart on Comparison by Deployment
Data Table on Comparison by Deployment

8.3 Cloud based - Market size and forecast 2025-2030

Chart on Cloud based - Market size and forecast 2025-2030 ($ million)
Data Table on Cloud based - Market size and forecast 2025-2030 ($ million)
Chart on Cloud based - Year-over-year growth 2025-2030 (%)
Data Table on Cloud based - Year-over-year growth 2025-2030 (%)

8.4 On premises - Market size and forecast 2025-2030

Chart on On premises - Market size and forecast 2025-2030 ($ million)
Data Table on On premises - Market size and forecast 2025-2030 ($ million)
Chart on On premises - Year-over-year growth 2025-2030 (%)
Data Table on On premises - Year-over-year growth 2025-2030 (%)

8.5 Market opportunity by Deployment

Market opportunity by Deployment ($ million)
Data Table on Market opportunity by Deployment ($ million)

9. Market Segmentation by Type

9.1 Market segments

Chart on Type - Market share 2025-2030 (%)
Data Table on Type - Market share 2025-2030 (%)

9.2 Comparison by Type

Chart on Comparison by Type
Data Table on Comparison by Type

9.3 Monitoring and control platforms - Market size and forecast 2025-2030

Chart on Monitoring and control platforms - Market size and forecast 2025-2030 ($ million)
Data Table on Monitoring and control platforms - Market size and forecast 2025-2030 ($ million)
Chart on Monitoring and control platforms - Year-over-year growth 2025-2030 (%)
Data Table on Monitoring and control platforms - Year-over-year growth 2025-2030 (%)

9.4 Optimization and simulation software - Market size and forecast 2025-2030

Chart on Optimization and simulation software - Market size and forecast 2025-2030 ($ million)
Data Table on Optimization and simulation software - Market size and forecast 2025-2030 ($ million)
Chart on Optimization and simulation software - Year-over-year growth 2025-2030 (%)
Data Table on Optimization and simulation software - Year-over-year growth 2025-2030 (%)

9.5 Data analytics and reporting tools - Market size and forecast 2025-2030

Chart on Data analytics and reporting tools - Market size and forecast 2025-2030 ($ million)
Data Table on Data analytics and reporting tools - Market size and forecast 2025-2030 ($ million)
Chart on Data analytics and reporting tools - Year-over-year growth 2025-2030 (%)
Data Table on Data analytics and reporting tools - Year-over-year growth 2025-2030 (%)

9.6 Integration and management platforms - Market size and forecast 2025-2030

Chart on Integration and management platforms - Market size and forecast 2025-2030 ($ million)
Data Table on Integration and management platforms - Market size and forecast 2025-2030 ($ million)
Chart on Integration and management platforms - Year-over-year growth 2025-2030 (%)
Data Table on Integration and management platforms - Year-over-year growth 2025-2030 (%)

9.7 Market opportunity by Type

Market opportunity by Type ($ million)
Data Table on Market opportunity by Type ($ million)

10. Market Segmentation by End-user

10.1 Market segments

Chart on End-user - Market share 2025-2030 (%)
Data Table on End-user - Market share 2025-2030 (%)

10.2 Comparison by End-user

Chart on Comparison by End-user
Data Table on Comparison by End-user

10.3 Oil and gas - Market size and forecast 2025-2030

Chart on Oil and gas - Market size and forecast 2025-2030 ($ million)
Data Table on Oil and gas - Market size and forecast 2025-2030 ($ million)
Chart on Oil and gas - Year-over-year growth 2025-2030 (%)
Data Table on Oil and gas - Year-over-year growth 2025-2030 (%)

10.4 Power generation - Market size and forecast 2025-2030

Chart on Power generation - Market size and forecast 2025-2030 ($ million)
Data Table on Power generation - Market size and forecast 2025-2030 ($ million)
Chart on Power generation - Year-over-year growth 2025-2030 (%)
Data Table on Power generation - Year-over-year growth 2025-2030 (%)

10.5 Cement - Market size and forecast 2025-2030

Chart on Cement - Market size and forecast 2025-2030 ($ million)
Data Table on Cement - Market size and forecast 2025-2030 ($ million)
Chart on Cement - Year-over-year growth 2025-2030 (%)
Data Table on Cement - Year-over-year growth 2025-2030 (%)

10.6 Others - Market size and forecast 2025-2030

Chart on Others - Market size and forecast 2025-2030 ($ million)
Data Table on Others - Market size and forecast 2025-2030 ($ million)
Chart on Others - Year-over-year growth 2025-2030 (%)
Data Table on Others - Year-over-year growth 2025-2030 (%)

10.7 Market opportunity by End-user

Market opportunity by End-user ($ million)
Data Table on Market opportunity by End-user ($ million)

11. Customer Landscape

11.1 Customer landscape overview

Analysis of price sensitivity, lifecycle, customer purchase basket, adoption rates, and purchase criteria

12. Geographic Landscape

12.1 Geographic segmentation

Chart on Market share by geography 2025-2030 (%)
Data Table on Market share by geography 2025-2030 (%)

12.2 Geographic comparison

Chart on Geographic comparison
Data Table on Geographic comparison

12.3 North America - Market size and forecast 2025-2030

Chart on North America - Market size and forecast 2025-2030 ($ million)
Data Table on North America - Market size and forecast 2025-2030 ($ million)
Chart on North America - Year-over-year growth 2025-2030 (%)
Data Table on North America - Year-over-year growth 2025-2030 (%)
Chart on Regional Comparison - North America
Data Table on Regional Comparison - North America

12.3.1 US - Market size and forecast 2025-2030

Chart on US - Market size and forecast 2025-2030 ($ million)
Data Table on US - Market size and forecast 2025-2030 ($ million)
Chart on US - Year-over-year growth 2025-2030 (%)
Data Table on US - Year-over-year growth 2025-2030 (%)

12.3.2 Canada - Market size and forecast 2025-2030

Chart on Canada - Market size and forecast 2025-2030 ($ million)
Data Table on Canada - Market size and forecast 2025-2030 ($ million)
Chart on Canada - Year-over-year growth 2025-2030 (%)
Data Table on Canada - Year-over-year growth 2025-2030 (%)

12.3.3 Mexico - Market size and forecast 2025-2030

Chart on Mexico - Market size and forecast 2025-2030 ($ million)
Data Table on Mexico - Market size and forecast 2025-2030 ($ million)
Chart on Mexico - Year-over-year growth 2025-2030 (%)
Data Table on Mexico - Year-over-year growth 2025-2030 (%)

12.4 Europe - Market size and forecast 2025-2030

Chart on Europe - Market size and forecast 2025-2030 ($ million)
Data Table on Europe - Market size and forecast 2025-2030 ($ million)
Chart on Europe - Year-over-year growth 2025-2030 (%)
Data Table on Europe - Year-over-year growth 2025-2030 (%)
Chart on Regional Comparison - Europe
Data Table on Regional Comparison - Europe

12.4.1 Germany - Market size and forecast 2025-2030

Chart on Germany - Market size and forecast 2025-2030 ($ million)
Data Table on Germany - Market size and forecast 2025-2030 ($ million)
Chart on Germany - Year-over-year growth 2025-2030 (%)
Data Table on Germany - Year-over-year growth 2025-2030 (%)

12.4.2 UK - Market size and forecast 2025-2030

Chart on UK - Market size and forecast 2025-2030 ($ million)
Data Table on UK - Market size and forecast 2025-2030 ($ million)
Chart on UK - Year-over-year growth 2025-2030 (%)
Data Table on UK - Year-over-year growth 2025-2030 (%)

12.4.3 France - Market size and forecast 2025-2030

Chart on France - Market size and forecast 2025-2030 ($ million)
Data Table on France - Market size and forecast 2025-2030 ($ million)
Chart on France - Year-over-year growth 2025-2030 (%)
Data Table on France - Year-over-year growth 2025-2030 (%)

12.4.4 Italy - Market size and forecast 2025-2030

Chart on Italy - Market size and forecast 2025-2030 ($ million)
Data Table on Italy - Market size and forecast 2025-2030 ($ million)
Chart on Italy - Year-over-year growth 2025-2030 (%)
Data Table on Italy - Year-over-year growth 2025-2030 (%)

12.4.5 The Netherlands - Market size and forecast 2025-2030

Chart on The Netherlands - Market size and forecast 2025-2030 ($ million)
Data Table on The Netherlands - Market size and forecast 2025-2030 ($ million)
Chart on The Netherlands - Year-over-year growth 2025-2030 (%)
Data Table on The Netherlands - Year-over-year growth 2025-2030 (%)

12.4.6 Spain - Market size and forecast 2025-2030

Chart on Spain - Market size and forecast 2025-2030 ($ million)
Data Table on Spain - Market size and forecast 2025-2030 ($ million)
Chart on Spain - Year-over-year growth 2025-2030 (%)
Data Table on Spain - Year-over-year growth 2025-2030 (%)

12.5 APAC - Market size and forecast 2025-2030

Chart on APAC - Market size and forecast 2025-2030 ($ million)
Data Table on APAC - Market size and forecast 2025-2030 ($ million)
Chart on APAC - Year-over-year growth 2025-2030 (%)
Data Table on APAC - Year-over-year growth 2025-2030 (%)
Chart on Regional Comparison - APAC
Data Table on Regional Comparison - APAC

12.5.1 China - Market size and forecast 2025-2030

Chart on China - Market size and forecast 2025-2030 ($ million)
Data Table on China - Market size and forecast 2025-2030 ($ million)
Chart on China - Year-over-year growth 2025-2030 (%)
Data Table on China - Year-over-year growth 2025-2030 (%)

12.5.2 Japan - Market size and forecast 2025-2030

Chart on Japan - Market size and forecast 2025-2030 ($ million)
Data Table on Japan - Market size and forecast 2025-2030 ($ million)
Chart on Japan - Year-over-year growth 2025-2030 (%)
Data Table on Japan - Year-over-year growth 2025-2030 (%)

12.5.3 India - Market size and forecast 2025-2030

Chart on India - Market size and forecast 2025-2030 ($ million)
Data Table on India - Market size and forecast 2025-2030 ($ million)
Chart on India - Year-over-year growth 2025-2030 (%)
Data Table on India - Year-over-year growth 2025-2030 (%)

12.5.4 South Korea - Market size and forecast 2025-2030

Chart on South Korea - Market size and forecast 2025-2030 ($ million)
Data Table on South Korea - Market size and forecast 2025-2030 ($ million)
Chart on South Korea - Year-over-year growth 2025-2030 (%)
Data Table on South Korea - Year-over-year growth 2025-2030 (%)

12.5.5 Australia - Market size and forecast 2025-2030

Chart on Australia - Market size and forecast 2025-2030 ($ million)
Data Table on Australia - Market size and forecast 2025-2030 ($ million)
Chart on Australia - Year-over-year growth 2025-2030 (%)
Data Table on Australia - Year-over-year growth 2025-2030 (%)

12.5.6 Indonesia - Market size and forecast 2025-2030

Chart on Indonesia - Market size and forecast 2025-2030 ($ million)
Data Table on Indonesia - Market size and forecast 2025-2030 ($ million)
Chart on Indonesia - Year-over-year growth 2025-2030 (%)
Data Table on Indonesia - Year-over-year growth 2025-2030 (%)

12.6 Middle East and Africa - Market size and forecast 2025-2030

Chart on Middle East and Africa - Market size and forecast 2025-2030 ($ million)
Data Table on Middle East and Africa - Market size and forecast 2025-2030 ($ million)
Chart on Middle East and Africa - Year-over-year growth 2025-2030 (%)
Data Table on Middle East and Africa - Year-over-year growth 2025-2030 (%)
Chart on Regional Comparison - Middle East and Africa
Data Table on Regional Comparison - Middle East and Africa

12.6.1 Saudi Arabia - Market size and forecast 2025-2030

Chart on Saudi Arabia - Market size and forecast 2025-2030 ($ million)
Data Table on Saudi Arabia - Market size and forecast 2025-2030 ($ million)
Chart on Saudi Arabia - Year-over-year growth 2025-2030 (%)
Data Table on Saudi Arabia - Year-over-year growth 2025-2030 (%)

12.6.2 UAE - Market size and forecast 2025-2030

Chart on UAE - Market size and forecast 2025-2030 ($ million)
Data Table on UAE - Market size and forecast 2025-2030 ($ million)
Chart on UAE - Year-over-year growth 2025-2030 (%)
Data Table on UAE - Year-over-year growth 2025-2030 (%)

12.6.3 South Africa - Market size and forecast 2025-2030

Chart on South Africa - Market size and forecast 2025-2030 ($ million)
Data Table on South Africa - Market size and forecast 2025-2030 ($ million)
Chart on South Africa - Year-over-year growth 2025-2030 (%)
Data Table on South Africa - Year-over-year growth 2025-2030 (%)

12.6.4 Israel - Market size and forecast 2025-2030

Chart on Israel - Market size and forecast 2025-2030 ($ million)
Data Table on Israel - Market size and forecast 2025-2030 ($ million)
Chart on Israel - Year-over-year growth 2025-2030 (%)
Data Table on Israel - Year-over-year growth 2025-2030 (%)

12.6.5 Turkey - Market size and forecast 2025-2030

Chart on Turkey - Market size and forecast 2025-2030 ($ million)
Data Table on Turkey - Market size and forecast 2025-2030 ($ million)
Chart on Turkey - Year-over-year growth 2025-2030 (%)
Data Table on Turkey - Year-over-year growth 2025-2030 (%)

12.7 South America - Market size and forecast 2025-2030

Chart on South America - Market size and forecast 2025-2030 ($ million)
Data Table on South America - Market size and forecast 2025-2030 ($ million)
Chart on South America - Year-over-year growth 2025-2030 (%)
Data Table on South America - Year-over-year growth 2025-2030 (%)
Chart on Regional Comparison - South America
Data Table on Regional Comparison - South America

12.7.1 Brazil - Market size and forecast 2025-2030

Chart on Brazil - Market size and forecast 2025-2030 ($ million)
Data Table on Brazil - Market size and forecast 2025-2030 ($ million)
Chart on Brazil - Year-over-year growth 2025-2030 (%)
Data Table on Brazil - Year-over-year growth 2025-2030 (%)

12.7.2 Argentina - Market size and forecast 2025-2030

Chart on Argentina - Market size and forecast 2025-2030 ($ million)
Data Table on Argentina - Market size and forecast 2025-2030 ($ million)
Chart on Argentina - Year-over-year growth 2025-2030 (%)
Data Table on Argentina - Year-over-year growth 2025-2030 (%)

12.7.3 Colombia - Market size and forecast 2025-2030

Chart on Colombia - Market size and forecast 2025-2030 ($ million)
Data Table on Colombia - Market size and forecast 2025-2030 ($ million)
Chart on Colombia - Year-over-year growth 2025-2030 (%)
Data Table on Colombia - Year-over-year growth 2025-2030 (%)

12.8 Market opportunity by geography

Market opportunity by geography ($ million)
Data Tables on Market opportunity by geography ($ million)

13. Drivers, Challenges, and Opportunity

13.1 Market drivers

Stringent regulatory frameworks and evolution of carbon pricing mechanisms
Technological advancements in AI and high performance computing
Proliferation of multi user industrial clusters and shared carbon infrastructure

13.2 Market challenges

Technical interoperability and data standardization hurdles
Economic barriers and high initial capital investment for digital infrastructure
Long term liability and evolving regulatory compliance complexity

13.3 Impact of drivers and challenges

Impact of drivers and challenges in 2025 and 2030

13.4 Market opportunities

Integration of advanced digital twins and high fidelity physics based modeling
Expansion of cloud native collaborative ecosystems for industrial hubs
Utilization of AI and ML for subsurface monitoring

14. Competitive Landscape

14.1 Overview

14.2

Overview on criticality of inputs and factors of differentiation

14.3 Landscape disruption

Overview on factors of disruption

14.4 Industry risks

Impact of key risks on business

15. Competitive Analysis

15.1 Companies profiled

Companies covered

15.2 Company ranking index

15.3 Market positioning of companies

Matrix on companies position and classification

15.4 ANSYS Inc.

ANSYS Inc. - Overview
ANSYS Inc. - Business segments
ANSYS Inc. - Key news
ANSYS Inc. - Key offerings
ANSYS Inc. - Segment focus
SWOT

15.5 AVEVA Group Ltd.

AVEVA Group Ltd. - Overview
AVEVA Group Ltd. - Business segments
AVEVA Group Ltd. - Key offerings
AVEVA Group Ltd. - Segment focus
SWOT

15.6 Baker Hughes Co.

Baker Hughes Co. - Overview
Baker Hughes Co. - Business segments
Baker Hughes Co. - Key news
Baker Hughes Co. - Key offerings
Baker Hughes Co. - Segment focus
SWOT

15.7 Bentley Systems Inc.

Bentley Systems Inc. - Overview
Bentley Systems Inc. - Business segments
Bentley Systems Inc. - Key news
Bentley Systems Inc. - Key offerings
Bentley Systems Inc. - Segment focus
SWOT

15.8 CGG SA

CGG SA - Overview
CGG SA - Business segments
CGG SA - Key offerings
CGG SA - Segment focus
SWOT

15.9 Dassault Systemes SE

Dassault Systemes SE - Overview
Dassault Systemes SE - Business segments
Dassault Systemes SE - Key news
Dassault Systemes SE - Key offerings
Dassault Systemes SE - Segment focus
SWOT

15.10 DNV Group AS

DNV Group AS - Overview
DNV Group AS - Business segments
DNV Group AS - Key offerings
DNV Group AS - Segment focus
SWOT

15.11 Emerson Electric Co.

Emerson Electric Co. - Overview
Emerson Electric Co. - Business segments
Emerson Electric Co. - Key news
Emerson Electric Co. - Key offerings
Emerson Electric Co. - Segment focus
SWOT

15.12 Halliburton Co.

Halliburton Co. - Overview
Halliburton Co. - Business segments
Halliburton Co. - Key news
Halliburton Co. - Key offerings
Halliburton Co. - Segment focus
SWOT

15.13 Honeywell International Inc.

Honeywell International Inc. - Overview
Honeywell International Inc. - Business segments
Honeywell International Inc. - Key news
Honeywell International Inc. - Key offerings
Honeywell International Inc. - Segment focus
SWOT

15.14 IBM Corp.

IBM Corp. - Overview
IBM Corp. - Business segments
IBM Corp. - Key news
IBM Corp. - Key offerings
IBM Corp. - Segment focus
SWOT

15.15 Kongsberg Gruppen ASA

Kongsberg Gruppen ASA - Overview
Kongsberg Gruppen ASA - Business segments
Kongsberg Gruppen ASA - Key news
Kongsberg Gruppen ASA - Key offerings
Kongsberg Gruppen ASA - Segment focus
SWOT

15.16 Microsoft Corp.

Microsoft Corp. - Overview
Microsoft Corp. - Business segments
Microsoft Corp. - Key news
Microsoft Corp. - Key offerings
Microsoft Corp. - Segment focus
SWOT

15.17 Rockwell Automation Inc.

Rockwell Automation Inc. - Overview
Rockwell Automation Inc. - Business segments
Rockwell Automation Inc. - Key news
Rockwell Automation Inc. - Key offerings
Rockwell Automation Inc. - Segment focus
SWOT

15.18 SAP SE

SAP SE - Overview
SAP SE - Business segments
SAP SE - Key news
SAP SE - Key offerings
SAP SE - Segment focus
SWOT

16. Appendix

16.1 Scope of the report

Market definition
Objectives
Notes and caveats

16.2 Inclusions and exclusions checklist

Inclusions checklist
Exclusions checklist

16.3 Currency conversion rates for US$

16.4 Research methodology

16.5 Data procurement

Information sources

16.6 Data validation

16.7 Validation techniques employed for market sizing

16.8 Data synthesis

16.9 360 degree market analysis

16.10 List of abbreviations

Research Methodology

Technavio presents a detailed picture of the market by way of study, synthesis, and summation of data from multiple sources. The analysts have presented the various facets of the market with a particular focus on identifying the key industry influencers. The data thus presented is comprehensive, reliable, and the result of extensive research, both primary and secondary.

INFORMATION SOURCES

Primary sources

  • Manufacturers and suppliers
  • Channel partners
  • Industry experts
  • Strategic decision makers

Secondary sources

  • Industry journals and periodicals
  • Government data
  • Financial reports of key industry players
  • Historical data
  • Press releases

DATA ANALYSIS

Data Synthesis

  • Collation of data
  • Estimation of key figures
  • Analysis of derived insights

Data Validation

  • Triangulation with data models
  • Reference against proprietary databases
  • Corroboration with industry experts

REPORT WRITING

Qualitative

  • Market drivers
  • Market challenges
  • Market trends
  • Five forces analysis

Quantitative

  • Market size and forecast
  • Market segmentation
  • Geographical insights
  • Competitive landscape

Interested in this report?

Get your sample now to see our research methodology and insights!

Download Now

Frequently Asked Questions

CCUS Software Platforms market growth will increase by USD 583.3 million during 2026-2030.

The CCUS Software Platforms market is expected to grow at a CAGR of 11.8% during 2026-2030.

CCUS Software Platforms market is segmented by Deployment (Cloud based, On premises) Type (Monitoring and control platforms, Optimization and simulation software, Data analytics and reporting tools, Integration and management platforms) End-user (Oil and gas, Power generation, Cement, Others)

ANSYS Inc., AVEVA Group Ltd., Baker Hughes Co., Bentley Systems Inc., CGG SA, Dassault Systemes SE, DNV Group AS, Emerson Electric Co., Halliburton Co., Honeywell International Inc., IBM Corp., Kongsberg Gruppen ASA, Microsoft Corp., Rockwell Automation Inc., S and P Global Inc., SAP SE, Schlumberger Ltd., Siemens AG, TGS ASA, Yokogawa Electric Corp. are a few of the key vendors in the CCUS Software Platforms market.

North America will register the highest growth rate of 40.2% among the other regions. Therefore, the CCUS Software Platforms market in North America is expected to garner significant business opportunities for the vendors during the forecast period.

US, Canada, Mexico, Germany, UK, France, Italy, The Netherlands, Spain, China, Japan, India, South Korea, Australia, Indonesia, Saudi Arabia, UAE, South Africa, Israel, Turkey, Brazil, Argentina, Colombia

  • Stringent regulatory frameworks and evolution of carbon pricing mechanisms is the driving factor this market.

The CCUS Software Platforms market vendors should focus on grabbing business opportunities from the Deployment segment as it accounted for the largest market share in the base year.
RIA - Research AI Assistant
Ask RIA