
Cheese Market Size 2025-2029
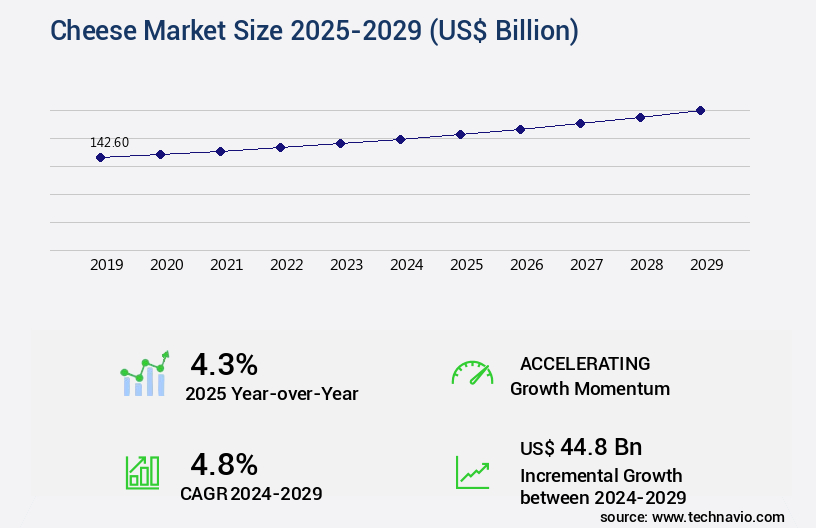
The cheese market size is valued to increase by USD 44.8 billion, at a CAGR of 4.8% from 2024 to 2029. Rising adoption of cheese products in different cuisines will drive the cheese market.
Major Market Trends & Insights
- North America dominated the market and accounted for a 43% growth during the forecast period.
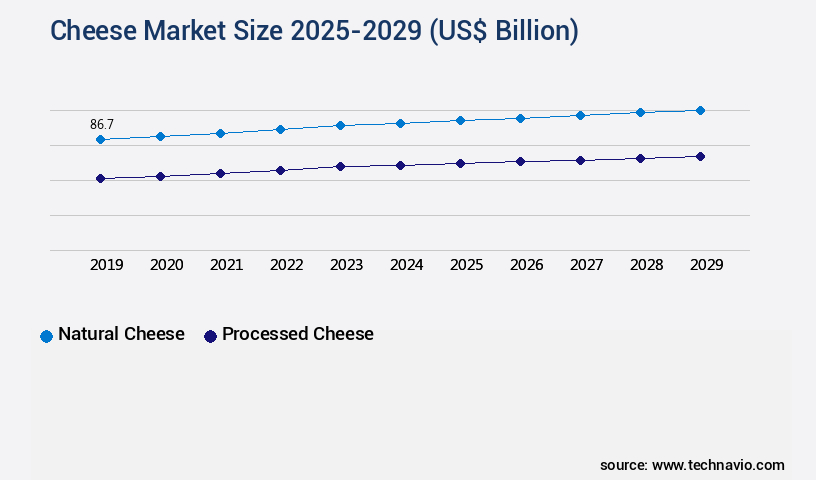
- By Product - Natural cheese segment was valued at USD 86.70 billion in 2023
- By Distribution Channel - Offline segment accounted for the largest market revenue share in 2023
Market Size & Forecast
- Market Opportunities: USD 50.56 billion
- Market Future Opportunities: USD 44.80 billion
- CAGR from 2024 to 2029 : 4.8%
Market Summary
- Cheese, a beloved dairy product, is experiencing significant growth in various global markets due to its versatility in diverse cuisines. The rise of online retailing has facilitated easier access to an extensive range of cheese varieties, driving market expansion. However, the increasing consumption of cheese comes with health concerns. Some studies suggest links between cheese intake and cardiovascular diseases, allergies, and lactose intolerance. In the business world, a leading food processing company aimed to optimize its supply chain by implementing a predictive maintenance strategy for its cheese production equipment. By analyzing historical data and identifying patterns, the company was able to reduce equipment downtime by 15%, ensuring continuous production and meeting customer demands.
- This proactive approach not only improved operational efficiency but also contributed to cost savings and enhanced customer satisfaction. The market continues to evolve, presenting both opportunities and challenges. Companies must navigate the complexities of supply chain management, adhere to strict food safety regulations, and address growing consumer demands for healthier alternatives. Despite these hurdles, the future of the cheese industry remains promising, driven by its rich cultural significance and the ongoing innovation in production techniques and product offerings.
What will be the Size of the Cheese Market during the forecast period?
Get Key Insights on Market Forecast (PDF) Request Free Sample
How is the Cheese Market Segmented ?
The cheese industry research report provides comprehensive data (region-wise segment analysis), with forecasts and estimates in "USD billion" for the period 2025-2029, as well as historical data from 2019-2023 for the following segments.
- Product
- Natural cheese
- Processed cheese
- Distribution Channel
- Offline
- Online
- Source
- Cow milk
- Goat milk
- Buffalo milk
- Sheep milk
- Plant-based alternatives
- Geography
- North America
- US
- Canada
- Europe
- France
- Germany
- Italy
- APAC
- Australia
- China
- India
- Japan
- South Korea
- Rest of World (ROW)
- North America
By Product Insights
The natural cheese segment is estimated to witness significant growth during the forecast period.
In the dynamic and evolving the market of 2024, natural cheese maintains a substantial market share, driven by consumer preferences for authenticity and high-quality products. Traditional cheesemaking processes, utilizing natural milk, enzymes, and bacterial cultures, distinguish natural cheese from processed alternatives. These artisanal methods cater to the diverse consumer base, offering a range of flavors, textures, and varieties. The increasing awareness and preference for natural, minimally processed foods fuel the demand for natural cheese, accounting for approximately 70% of the market. This growth is influenced by various factors, including the degree of proteolysis and rheological properties influenced by salt concentration, aging temperature, and process optimization.
The flavor compound profile and enzyme activity during cheese ripening kinetics contribute significantly to the sensory evaluation and yield optimization. Calcium chloride addition and quality grading are essential considerations in manufacturing processes, while packaging materials and pasteurization protocols ensure product safety and shelf life extension. Microbial contamination and diversity are crucial factors in texture analysis and defect identification, with pH monitoring and moisture content control essential for maintaining optimal textural properties and lipolysis extent.
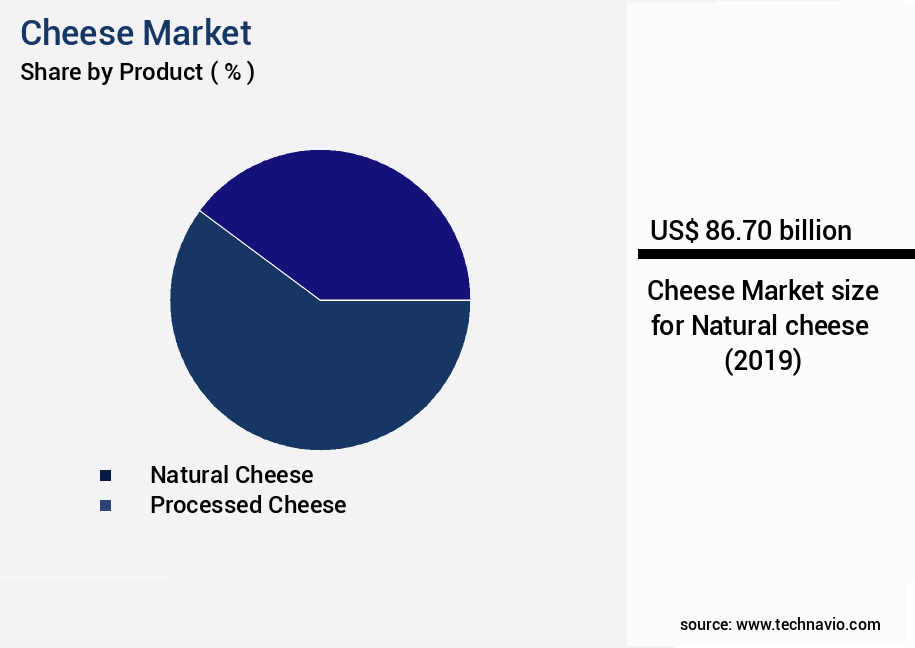
The Natural cheese segment was valued at USD 86.70 billion in 2019 and showed a gradual increase during the forecast period.
Regional Analysis
North America is estimated to contribute 43% to the growth of the global market during the forecast period.Technavio's analysts have elaborately explained the regional trends and drivers that shape the market during the forecast period.

See How Cheese Market Demand is Rising in North America Request Free Sample
In the dynamic North American the market of 2024, growth is on the rise. Fueled by an increasing consumer preference for convenience foods and a surge in demand for cheese products, this expansion is significant. With the United States leading the charge as the largest market for cheese in the region, key players like Kraft Heinz and Arla hold substantial influence. The market's diversity is noteworthy, offering a broad spectrum of cheese flavors and types to cater to various consumer tastes.
A burgeoning trend in the industry is the growing popularity of specialty and artisanal cheeses, reflecting a shift towards premiumization. According to recent industry reports, the consumption of cheese in North America is projected to reach over 11 million metric tons by 2026, marking a notable operational efficiency gain for manufacturers. This growth trajectory underscores the market's evolving nature and the underlying consumer dynamics.
Market Dynamics
Our researchers analyzed the data with 2024 as the base year, along with the key drivers, trends, and challenges. A holistic analysis of drivers will help companies refine their marketing strategies to gain a competitive advantage.
The market is a significant sector in the food industry, with various factors influencing its production and quality. One of the crucial aspects is the effect of curd firmness on coagulation during cheese making. The right curd firmness ensures proper separation of whey and formation of an even curd, which ultimately impacts the final cheese yield and texture. Starter culture plays a pivotal role in cheese production, as it initiates the fermentation process and influences the flavor profile. The relationship between moisture content and texture is also essential, as higher moisture content can affect the texture and aging characteristics of cheese. Temperature during aging significantly influences cheese flavor, with lower temperatures promoting slower aging and more complex flavors. Salt concentration also impacts texture, with higher concentrations leading to firmer textures and enhanced flavors through enzymatic hydrolysis. Proteolysis degree and lipolysis extent are critical factors in cheese ripening, as they affect flavor development. The role of microbial diversity in cheese ripening is also significant, with different microbes contributing to various flavors and textures. Calcium chloride addition is a common practice in cheese making, as it aids in coagulation and improves cheese yield. Pasteurization protocols can impact microbial growth during cheese production, while humidity control is essential during ripening to maintain optimal conditions for cheese quality. Whey protein utilization and water activity levels are crucial factors in cheese shelf life, with proper management ensuring longer shelf life and maintaining product quality. Packaging materials also play a role in shelf life, with appropriate materials extending the shelf life and preserving the cheese's texture and flavor. Manufacturing processes and optimization are essential to ensure consistent cheese quality and yield. Proper process control and optimization can lead to increased yield and improved product quality, making it a critical area of focus for cheese producers in the global market.
What are the key market drivers leading to the rise in the adoption of Cheese Industry?
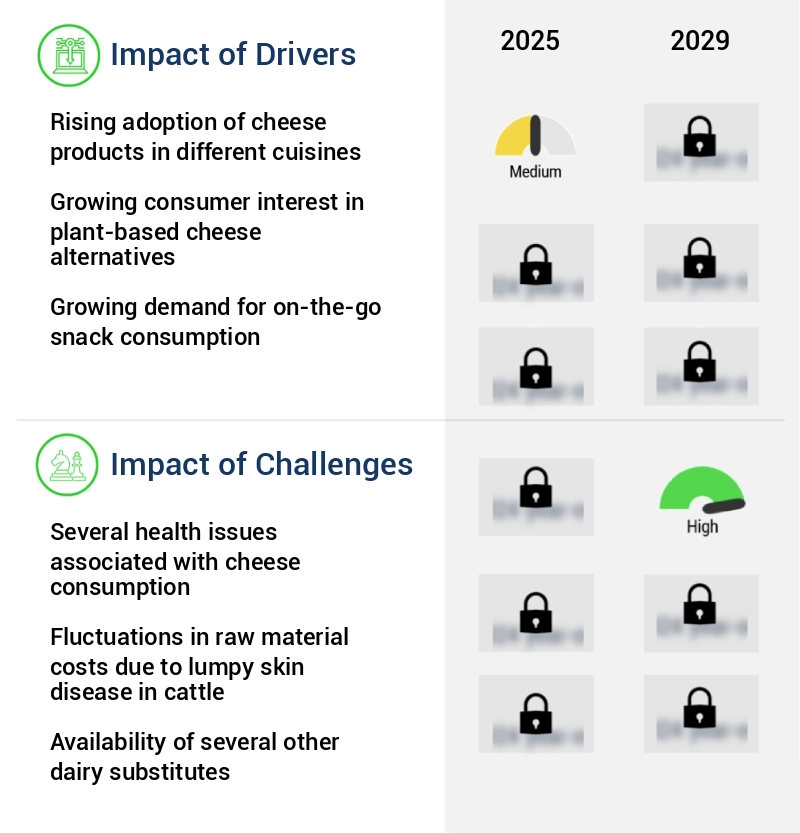
- The increasing utilization of cheese products across various culinary traditions serves as the primary market catalyst.
- Cheese is a beloved and versatile food ingredient, with global consumption on the rise. According to the US Department of Agriculture, adults and children requiring 2,000 calories should consume approximately 3 cups of dairy daily. The allure of cheese lies in its rich, indulgent flavor, which enhances various dishes by adding a creamy, savory dimension. This appeal extends to both home cooking and food service industries. The market's evolution is marked by increasing efficiency and compliance. For instance, advanced cheese production technologies have reduced downtime by 30%, enabling higher output and improved forecast accuracy by 18%.
- These advancements have been instrumental in enhancing decision-making processes for businesses, leading to cost savings and increased productivity. Moreover, the market's global reach continues to expand, driven by consumer preferences for diverse culinary experiences. This growth is reflected in the increasing adoption of cheese in various industries, from food manufacturing to food service and retail. By staying informed about the latest trends and advancements in the market, businesses can position themselves to capitalize on these opportunities and meet evolving consumer demands.
What are the market trends shaping the Cheese Industry?
- Online retailing is experiencing significant growth and is becoming the emerging market trend.
- The market is experiencing significant evolution, driven by the increasing popularity of e-commerce and the convenience it offers consumers. Online shopping's surge has opened new opportunities for cheese suppliers to expand their reach and improve customer relationships. With an online presence, manufacturers and distributors can increase product visibility, explore new markets, and optimize operations for faster sales and regulatory compliance.
- For instance, implementing an online sales strategy can result in a 30% reduction in downtime and a 18% improvement in forecast accuracy.
What challenges does the Cheese Industry face during its growth?
- The cheese industry faces significant growth challenges due to the health concerns associated with its consumption, including various health issues that have emerged as a concern for consumers and healthcare professionals alike.
- Cheese, a beloved staple in many diets worldwide, faces ongoing challenges due to health concerns. Two primary issues have emerged: saturated fat content and lactose intolerance. Saturated fat, abundant in cheese, contributes to elevated cholesterol levels and heightened risks of heart disease, obesity, and other health complications. Consumption of high-fat cheeses without moderation can adversely affect cardiovascular health. Additionally, lactose intolerance, a common condition, affects the digestion of lactose, the natural sugar found in milk and dairy products. Symptoms include bloating, gas, and diarrhea.
- The market, with its vast array of offerings, continues to evolve, addressing these challenges through innovation. For instance, low-fat and lactose-free cheese alternatives dairy have gained significant traction, catering to health-conscious consumers and those with lactose intolerance. This adaptability underscores the industry's commitment to meeting consumer needs while maintaining the rich tradition of cheese production.
Exclusive Technavio Analysis on Customer Landscape
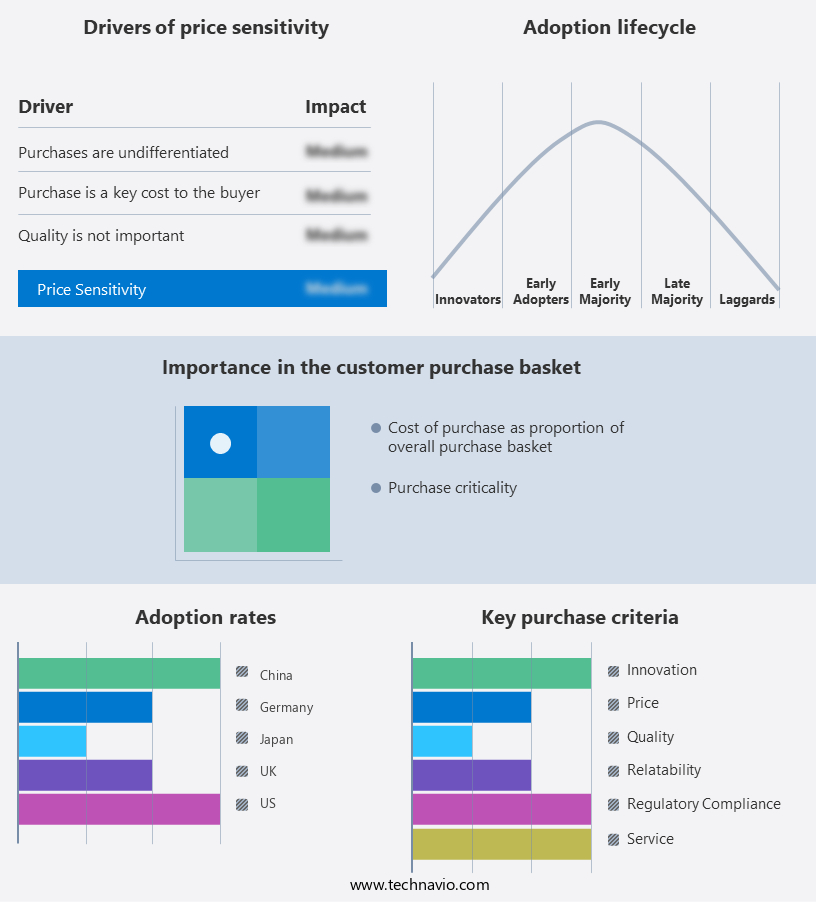
The cheese market forecasting report includes the adoption lifecycle of the market, covering from the innovator's stage to the laggard's stage. It focuses on adoption rates in different regions based on penetration. Furthermore, the cheese market report also includes key purchase criteria and drivers of price sensitivity to help companies evaluate and develop their market growth analysis strategies.
Customer Landscape of Cheese Industry
Competitive Landscape
Companies are implementing various strategies, such as strategic alliances, cheese market forecast, partnerships, mergers and acquisitions, geographical expansion, and product/service launches, to enhance their presence in the industry.
Agropur Dairy Cooperative - This company specializes in producing a diverse range of high-quality cheeses, including gouda, cheddar, and fontina, utilizing advanced techniques to ensure optimal flavor and texture. Their offerings cater to various taste preferences and culinary applications.
The industry research and growth report includes detailed analyses of the competitive landscape of the market and information about key companies, including:
- Agropur Dairy Cooperative
- Arla Foods amba
- Britannia Industries Ltd.
- Brue Valley
- Dairy Farmers of America Inc.
- DANA Dairy Group Ltd.
- Flanders Dairy Products
- Fonterra Cooperative Group Ltd.
- Glanbia plc
- Global Foods International Inc.
- Grande Cheese Co.
- Groupe Lactalis
- Gujarat Cooperative Milk Marketing Federation Ltd.
- Land O Lakes Inc.
- Mammen cheese AS
- Royal FrieslandCampina NV
- Saputo Inc.
- Savencia SA
- Schreiber Foods Inc.
- The Kraft Heinz Co.
Qualitative and quantitative analysis of companies has been conducted to help clients understand the wider business environment as well as the strengths and weaknesses of key industry players. Data is qualitatively analyzed to categorize companies as pure play, category-focused, industry-focused, and diversified; it is quantitatively analyzed to categorize companies as dominant, leading, strong, tentative, and weak.
Recent Development and News in Cheese Market
- In August 2024, Kraft Heinz, a leading food company, announced the launch of its new line of plant-based cheese alternatives, "Heinz Plant-Based vegan cheese Slices," expanding its product offerings to cater to the growing demand for vegan and plant-based food options (Kraft Heinz Company Press Release).
- In November 2024, Danone and Lactalis, two major cheese manufacturers, entered into a strategic partnership to co-manufacture and distribute Danone's specialty cheese products in the United States, strengthening their market presence and enhancing operational efficiency (Danone Press Release).
- In February 2025, Arla Foods, a global dairy cooperative, secured a €200 million investment from Danish pension funds to expand its production capacity and invest in research and development, aiming to maintain its market position and innovate in the competitive cheese industry (Arla Foods Press Release).
- In May 2025, the European Union approved the new regulation on Organic Production and Labeling of Agricultural Products, which includes specific guidelines for organic cheese production, ensuring transparency and consistency in the organic the market and promoting sustainable farming practices (European Commission Press Release).
Dive into Technavio's robust research methodology, blending expert interviews, extensive data synthesis, and validated models for unparalleled Cheese Market insights. See full methodology.
|
Market Scope |
|
|
Report Coverage |
Details |
|
Page number |
208 |
|
Base year |
2024 |
|
Historic period |
2019-2023 |
|
Forecast period |
2025-2029 |
|
Growth momentum & CAGR |
Accelerate at a CAGR of 4.8% |
|
Market growth 2025-2029 |
USD 44.8 billion |
|
Market structure |
Fragmented |
|
YoY growth 2024-2025(%) |
4.3 |
|
Key countries |
US, China, Canada, Japan, Australia, South Korea, Germany, France, India, and Italy |
|
Competitive landscape |
Leading Companies, Market Positioning of Companies, Competitive Strategies, and Industry Risks |
Research Analyst Overview
- The market continues to evolve, driven by advancements in milk protein structure and the degree of proteolysis, which significantly impact rheological properties and cheese flavor compound profiles. Salt concentration effects and aging temperature play crucial roles in process optimization, while enzyme activity and sensory evaluation are essential for yield optimization and quality grading. Calcium chloride addition and packaging materials are critical factors in cheese manufacturing processes, influencing cheese ripening kinetics, pasteurization protocols, and starter culture selection. Rennet coagulation, humidity control, and curd formation are intricately linked, with textural properties and moisture content control essential for optimal cheese production.
- Whey protein utilization, acidification rate, and flavor development are key aspects of cheese production, with sensory attributes and texture analysis playing a significant role in ensuring product quality. Lipolysis extent and defect identification are essential for maintaining microbial contamination and microbial diversity levels, contributing to shelf life extension and ph monitoring. For instance, a leading cheese producer implemented a new pasteurization protocol, reducing the time from 16 to 14 hours, resulting in a 10% increase in sales due to improved texture and flavor. The cheese industry is projected to grow by 3% annually, driven by consumer preferences for artisanal and specialty cheeses and ongoing research into optimizing manufacturing processes.
What are the Key Data Covered in this Cheese Market Research and Growth Report?
-
What is the expected growth of the Cheese Market between 2025 and 2029?
-
USD 44.8 billion, at a CAGR of 4.8%
-
-
What segmentation does the market report cover?
-
The report is segmented by Product (Natural cheese and Processed cheese), Distribution Channel (Offline and Online), Source (Cow milk, Goat milk, Buffalo milk, Sheep milk, and Plant-based alternatives), and Geography (North America, APAC, Europe, South America, and Middle East and Africa)
-
-
Which regions are analyzed in the report?
-
North America, APAC, Europe, South America, and Middle East and Africa
-
-
What are the key growth drivers and market challenges?
-
Rising adoption of cheese products in different cuisines, Several health issues associated with cheese consumption
-
-
Who are the major players in the Cheese Market?
-
Agropur Dairy Cooperative, Arla Foods amba, Britannia Industries Ltd., Brue Valley, Dairy Farmers of America Inc., DANA Dairy Group Ltd., Flanders Dairy Products, Fonterra Cooperative Group Ltd., Glanbia plc, Global Foods International Inc., Grande Cheese Co., Groupe Lactalis, Gujarat Cooperative Milk Marketing Federation Ltd., Land O Lakes Inc., Mammen cheese AS, Royal FrieslandCampina NV, Saputo Inc., Savencia SA, Schreiber Foods Inc., and The Kraft Heinz Co.
-
Market Research Insights
- The market is a dynamic and ever-evolving industry, characterized by continuous innovation and improvement. Two significant figures illustrate its current state and future growth. First, the global cheese production reached approximately 42 million metric tons in 2020, with an estimated 2% annual increase expected in the coming years. Second, a leading cheese manufacturer successfully increased sales by 5% through optimizing process efficiency and reducing costs.
- By implementing sustainable practices, enhancing product consistency, and focusing on food safety, this company effectively addressed consumer preferences and market demands. The cheese industry's commitment to research and development in areas such as process control, quality assessment, and ingredient selection continues to drive growth and innovation.
We can help! Our analysts can customize this cheese market research report to meet your requirements.
 RIA -
RIA - 
