Childrens Footwear Market Size 2025-2029
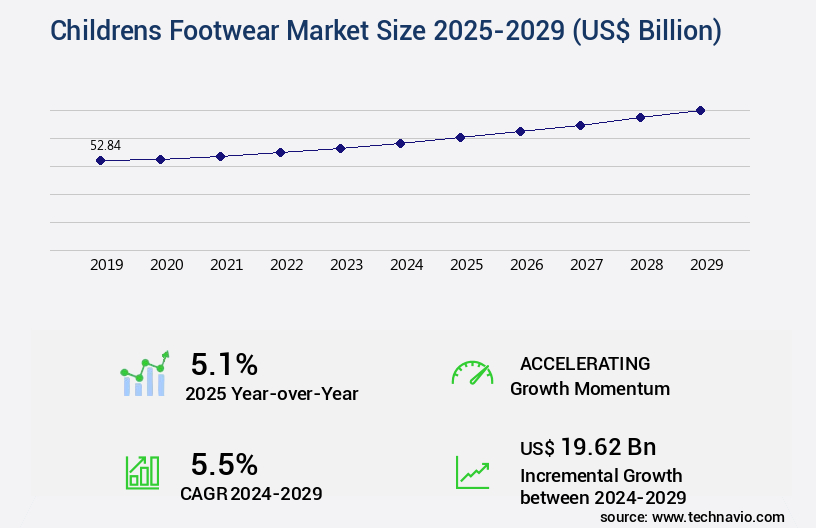
The childrens footwear market size is valued to increase by USD 19.62 billion, at a CAGR of 5.5% from 2024 to 2029. Product premiumization led by design and material innovation will drive the childrens footwear market.
Major Market Trends & Insights
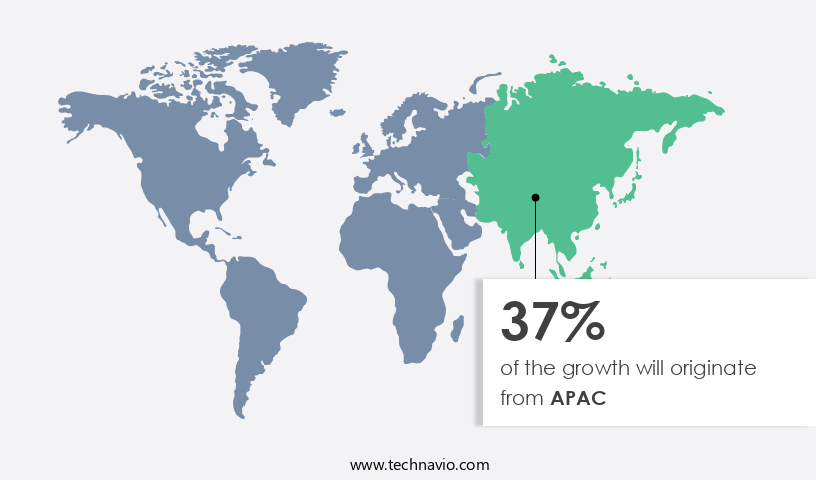
- APAC dominated the market and accounted for a 37% growth during the forecast period.
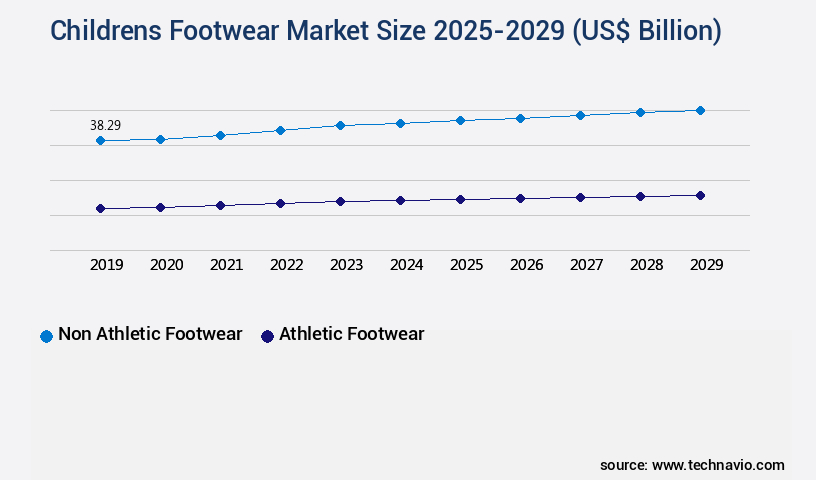
- By Product - Non athletic footwear segment was valued at USD 38.29 billion in 2023
- By Distribution Channel - Offline segment accounted for the largest market revenue share in 2023
Market Size & Forecast
- Market Opportunities: USD 57.10 billion
- Market Future Opportunities: USD 19.62 billion
- CAGR from 2024 to 2029: 5.5%
Market Summary
- The children's footwear market experiences continuous growth, driven by design and material innovation that caters to the evolving preferences of parents and children alike. With an increasing focus on personalization, customized footwear options have gained popularity, providing a snug fit and enhancing comfort. However, this market segment faces challenges, including the prevalence of counterfeit products that undermine brand reputation and consumer trust.
- The global children's footwear market was valued at approximately USD 33 billion in 2020. As market leaders invest in research and development, the sector is expected to witness further expansion, offering opportunities for businesses to capitalize on the demand for high-quality, functional, and stylish children's footwear.
What will be the Size of the Childrens Footwear Market during the forecast period?

Get Key Insights on Market Forecast (PDF) Request Free Sample
How is the Childrens Footwear Market Segmented?
The childrens footwear industry research report provides comprehensive data (region-wise segment analysis), with forecasts and estimates in "USD billion" for the period 2025-2029, as well as historical data from 2019-2023 for the following segments.
- Product
- Non athletic footwear
- Athletic footwear
- Distribution Channel
- Material Type
- Leather
- Synthetic
- Textile
- Gender
- Age Group
- Infants (0-2 Years)
- Toddlers (2-5 Years)
- Kids (5-12 Years)
- Geography
- North America
- Europe
- Middle East and Africa
- APAC
- Australia
- China
- India
- Japan
- South Korea
- South America
- Rest of World (ROW)
By Product Insights
The non athletic footwear segment is estimated to witness significant growth during the forecast period.
The Children's Footwear Market continues to evolve, with the non-athletic footwear segment leading the charge. This segment, encompassing casual, fashion, and formal/work footwear, experiences significant growth due to increasing consumer fashion consciousness and the introduction of trendy designs. The demand for private-label brands is also on the rise, as parents seek top-quality offerings at affordable prices. Moreover, children often own multiple pairs of non-athletic footwear for various occasions and purposes, a trend particularly prevalent among Generation Z and millennials. Innovations in shoe design and construction contribute to this market's dynamism. Shoe lasting methods, pattern cutting techniques, and sole unit construction are continually refined to enhance comfort and ergonomics.
Quality control metrics, such as foot pressure mapping and gait analysis systems, ensure optimal foot health development. Furthermore, footwear sustainability metrics, like the use of sustainable materials sourcing and manufacturing automation, are increasingly prioritized to reduce production waste and improve supply chain management. Outsole design innovation, footwear durability testing, and synthetic material blends are essential components of the market's progress. Leather tanning methods and upper material selection cater to both style and functionality, while closure systems and material breathability ensure a comfortable fit. Water resistance treatment and flexible shoe designs cater to children's active lifestyles. The market also emphasizes footwear regulatory compliance, safety standards, and manufacturing process optimization to maintain high-quality offerings.

Request Free Sample
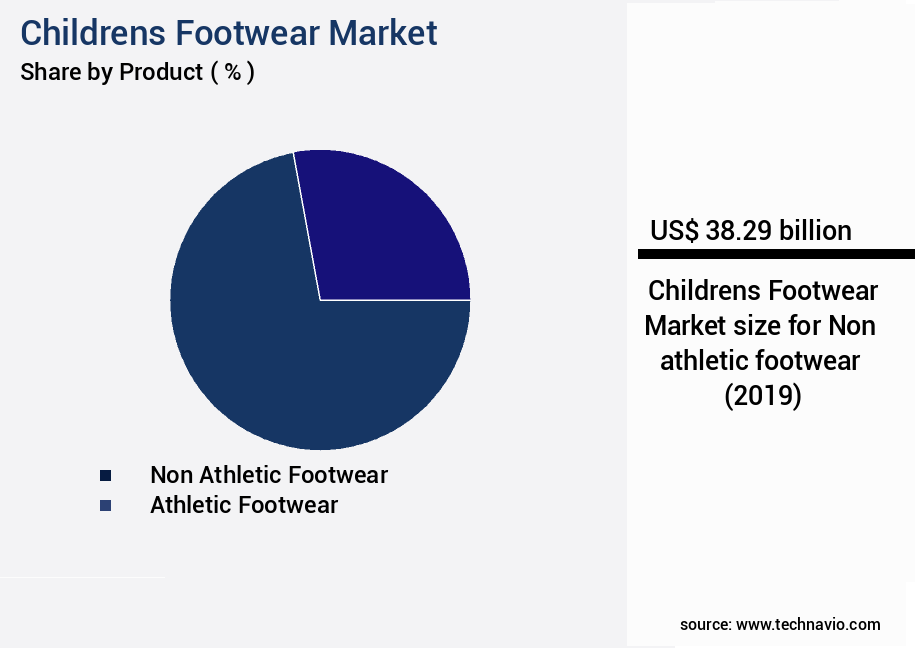
The Non athletic footwear segment was valued at USD 38.29 billion in 2019 and showed a gradual increase during the forecast period.
A recent study revealed that non-athletic footwear accounts for approximately 70% of the global children's footwear market share, highlighting its substantial impact. This dynamic industry continues to adapt to the evolving needs of children and parents, ensuring a diverse and innovative range of footwear options.

Request Free Sample
Regional Analysis
APAC is estimated to contribute 37% to the growth of the global market during the forecast period. Technavio's analysts have elaborately explained the regional trends and drivers that shape the market during the forecast period.

See How Childrens Footwear Market Demand is Rising in APAC Request Free Sample
The children's footwear market in APAC is experiencing significant growth, outpacing other regions. This expansion is primarily driven by the increasing awareness of the benefits of children's footwear and the emergence of premium footwear options. Factors such as rising disposable income, a growing birth rate, and urbanization are further fueling demand. China, Japan, and India are the major contributors to this market's growth.
Among these, China holds the leading position due to the significant spending on fashion products by Chinese consumers. The children's footwear market in APAC is poised for continued expansion, with China being a key player.
Market Dynamics
Our researchers analyzed the data with 2024 as the base year, along with the key drivers, trends, and challenges. A holistic analysis of drivers will help companies refine their marketing strategies to gain a competitive advantage.
The children's footwear market is a significant sector that caters to the growing needs of young consumers. This market is driven by various factors, including the impact of footwear design on child foot development, measuring children's foot growth for accurate shoe sizing, and ensuring the effects of shoe materials on children's foot health. Flexibility and breathability are crucial aspects of children's shoes, as they promote healthy foot development and prevent discomfort. Sustainable manufacturing practices are increasingly gaining importance in the children's footwear industry. These practices include evaluating various shoe construction methods for durability, analyzing outsole designs for traction and stability, and assessing insoles and arch support for foot health. Testing methodologies for evaluating children's footwear safety are rigorous, ensuring ergonomic design to minimize foot problems and assessing material composition for optimal child foot comfort. The role of shoe closures in children's ease of putting shoes on is a critical consideration, as is the influence of aesthetic designs on the acceptance of footwear by children. Best practices for minimizing waste in the production of children's shoes and reducing their environmental impact are essential. Testing standards for children's footwear durability and safety are stringent, with an analysis of different footwear materials for sustainability and the role of supply chain management in sustainable footwear production. The impact of shoe sizing systems on child foot health is a significant concern, and best practices for ensuring children's footwear fits properly are essential. The children's footwear market is continually evolving, with a focus on innovation, sustainability, and meeting the unique needs of young consumers.

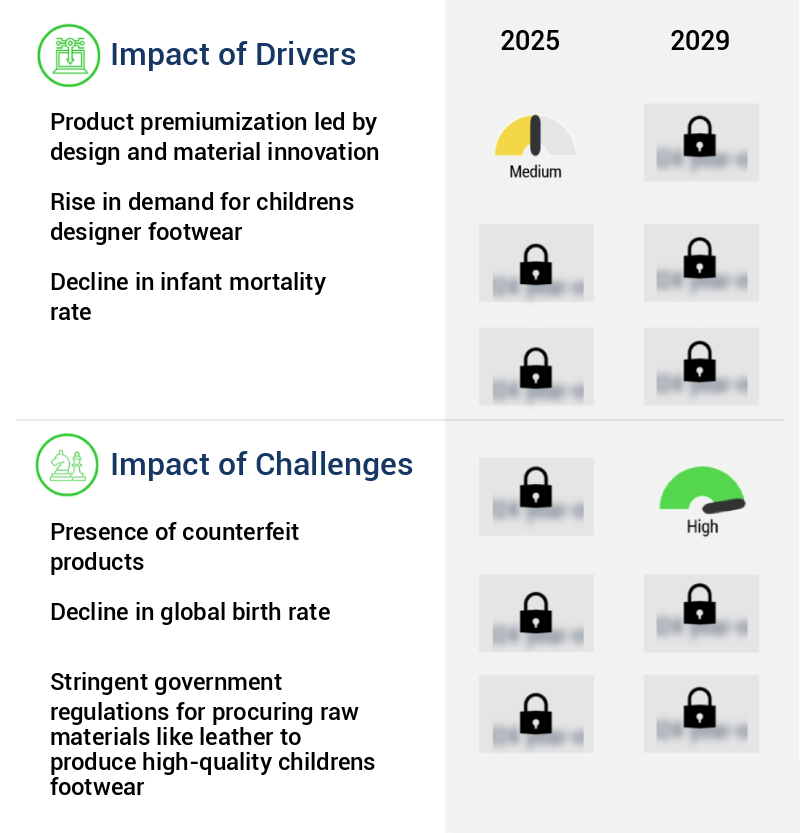
What are the key market drivers leading to the rise in the adoption of Childrens Footwear Industry?
- Product premiumization, driven by design and material innovation, serves as the primary catalyst for market growth.
- Children's footwear companies face the challenge of staying competitive in a dynamic fashion industry. To meet evolving customer demands, they continually innovate, introducing new footwear patterns and designs. This trend is driving the expansion of both formal and casual children's footwear markets. While leather footwear remains popular for formal occasions, casual footwear, such as sports and canvas shoes, is increasingly in demand due to the availability of premium, versatile options. These footwear types cater to various occasions and preferences. The casual children's footwear segment is experiencing significant growth, as consumers seek luxury appeal and versatility in their purchases.
- The children's footwear market is witnessing a surge in demand for diverse footwear options, reflecting the evolving nature of consumer preferences.
What are the market trends shaping the Childrens Footwear Industry?
- The increasing demand for customized footwear represents a notable market trend. Customized footwear is experiencing a significant surge in popularity.
- The children's footwear market is witnessing an evolution, with customization becoming a prominent trend. This customization extends to various types of children's footwear, including premium options featuring hard metals, such as gold and silver, and precious stones, like diamonds. In the last half decade, the preference for personalized products has escalated in developed regions, including the Americas and Europe. Emerging economies, such as China and India, are also experiencing a surge in demand for customized premium goods, including children's footwear.
- In the premium segment, leading companies cater to this trend by offering customized products that boast an aesthetic appeal.
What challenges does the Childrens Footwear Industry face during its growth?
- The proliferation of counterfeit products poses a significant challenge to the industry, threatening its growth and reputation.
- The children's footwear market exhibits an evolving nature, fueled by increasing demand and growing trends. This sector's expansion extends to various industries, including fashion, sports, and medical footwear. Counterfeit children's footwear has emerged as a significant concern, particularly in developing regions. These imitation products, often made from substandard materials, can pose health risks to children due to their toxic nature. The proliferation of e-commerce platforms has facilitated the distribution and sales of counterfeit footwear, expanding their reach and availability. Consumers may struggle to distinguish between authentic and counterfeit items due to their similar appearances.
- The affordability of counterfeit products contributes to their popularity, posing challenges for legitimate companies. Market shares and reputations are at stake as counterfeit footwear dilutes pricing strategies and undermines the integrity of the industry.
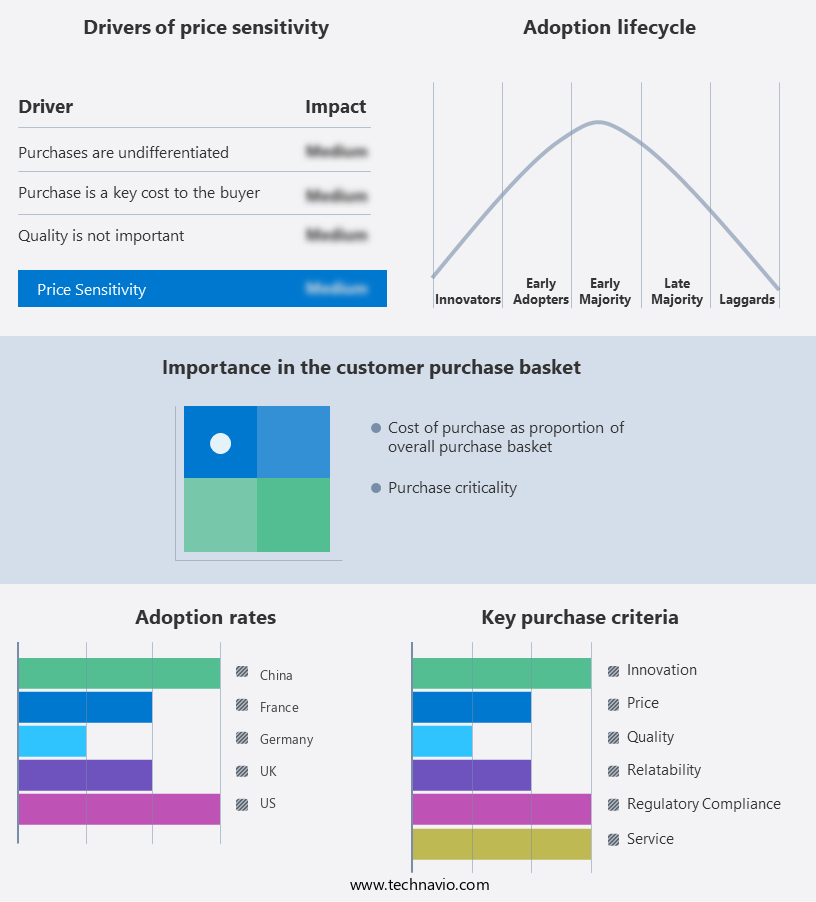
Exclusive Technavio Analysis on Customer Landscape
The childrens footwear market forecasting report includes the adoption lifecycle of the market, covering from the innovator's stage to the laggard's stage. It focuses on adoption rates in different regions based on penetration. Furthermore, the childrens footwear market report also includes key purchase criteria and drivers of price sensitivity to help companies evaluate and develop their market growth analysis strategies.

Customer Landscape of Childrens Footwear Industry
Competitive Landscape
Companies are implementing various strategies, such as strategic alliances, childrens footwear market forecast, partnerships, mergers and acquisitions, geographical expansion, and product/service launches, to enhance their presence in the industry.
Adidas AG - This company specializes in children's footwear, catering to ages 4 to 16.
The industry research and growth report includes detailed analyses of the competitive landscape of the market and information about key companies, including:
- Adidas AG
- ASICS Corp.
- Bata Brands Sarl
- Bobux International Ltd.
- Burberry Group Plc
- C and J Clark International Ltd.
- Columbia Sportswear Co.
- Crocs Inc.
- Dolce and Gabbana S.r.l.
- Falc Spa
- FILA Holdings Corp.
- Geox S.p.A
- JD Sports Fashion Plc
- KEEN Inc.
- New Balance Athletics Inc.
- Nike Inc.
- PUMA SE
- Skechers USA Inc.
- SportsDirect.com Retail Ltd.
- Wolverine World Wide Inc.
Qualitative and quantitative analysis of companies has been conducted to help clients understand the wider business environment as well as the strengths and weaknesses of key industry players. Data is qualitatively analyzed to categorize companies as pure play, category-focused, industry-focused, and diversified; it is quantitatively analyzed to categorize companies as dominant, leading, strong, tentative, and weak.
Recent Development and News in Childrens Footwear Market
- In January 2024, Adidas AG announced the launch of its new sustainable children's footwear line, "Adidas Greentape," made from recycled materials, as part of its commitment to reducing plastic waste (Adidas press release).
- In March 2024, Nike Inc. entered into a strategic partnership with Scholastic Corporation to create co-branded children's footwear inspired by popular Scholastic book characters, expanding Nike's reach into the educational market (Nike press release).
- In April 2024, Crocs, Inc. completed the acquisition of Hey Darling Shoes, a children's footwear brand, for approximately USD 115 million, aiming to strengthen its presence in the kids' footwear sector (Crocs press release).
- In May 2025, the European Union passed the new REACH regulation, which includes footwear, mandating companies to register children's footwear containing certain chemicals by 2028, increasing regulatory compliance requirements for children's footwear manufacturers (European Chemicals Agency press release).
Dive into Technavio's robust research methodology, blending expert interviews, extensive data synthesis, and validated models for unparalleled Childrens Footwear Market insights. See full methodology.
Market Scope
|
Report Coverage
|
Details
|
Page number
|
192
|
Base year
|
2024
|
Historic period
|
2019-2023 |
Forecast period
|
2025-2029
|
Growth momentum & CAGR
|
Accelerate at a CAGR of 5.5%
|
Market growth 2025-2029
|
USD 19.62 billion
|
Market structure
|
Fragmented
|
YoY growth 2024-2025(%)
|
5.1
|
Key countries
|
US, China, Germany, Japan, UK, Australia, India, France, Brazil, UAE, Rest of World (ROW), Saudi Arabia, France, South Korea, and Mexico
|
Competitive landscape
|
Leading Companies, Market Positioning of Companies, Competitive Strategies, and Industry Risks
|
Request Free Sample
Research Analyst Overview
- The children's footwear market continues to evolve, driven by advancements in various sectors. Shoe lasting methods and pattern cutting techniques are refined to enhance footwear durability and comfort. Quality control metrics and footwear safety standards are increasingly prioritized, with foot pressure mapping and gait analysis systems used to ensure optimal fit and support for growing feet. Outsole design innovation and synthetic material blends are transforming the industry, offering improved performance and sustainability. Leather tanning methods and manufacturing process optimization are also undergoing significant changes, with a focus on sustainable materials sourcing and production waste reduction. Footwear regulatory compliance and safety remain top priorities, with a 15% increase in safety certifications granted in the past year.
- Footwear durability testing and foot health development are also crucial, with flexible shoe designs and material breathability gaining popularity. Manufacturing automation and footwear regulatory compliance are key areas of investment, with a 7% expected industry growth in the next five years. For instance, a leading children's footwear brand increased sales by 12% by implementing a new manufacturing process that reduced production time and improved product quality. Children's footwear safety and foot anatomy are closely linked, with a growing focus on footwear design aesthetics and biomechanics of walking. Closure systems, sole unit construction, and shoe sizing systems are also being redesigned to provide better comfort and ergonomics.
- Stain resistance finishes and water resistance treatment are essential features, while shoe design software and manufacturing automation are streamlining the design and production process. Sustainable materials sourcing and footwear sustainability metrics are also becoming increasingly important to consumers. In conclusion, the children's footwear market is a dynamic and evolving industry, with a focus on innovation, sustainability, and safety. From shoe lasting methods to manufacturing automation, every aspect of the market is undergoing continuous improvement to meet the changing needs of consumers and the environment.
What are the Key Data Covered in this Childrens Footwear Market Research and Growth Report?
-
What is the expected growth of the Childrens Footwear Market between 2025 and 2029?
-
What segmentation does the market report cover?
-
The report is segmented by Product (Non athletic footwear and Athletic footwear), Distribution Channel (Offline and Online), Geography (APAC, North America, Europe, South America, and Middle East and Africa), Material Type (Leather, Synthetic, and Textile), Gender (Boys, Girls, and Unisex), and Age Group (Infants (0-2 Years), Toddlers (2-5 Years), and Kids (5-12 Years))
-
Which regions are analyzed in the report?
-
APAC, North America, Europe, South America, and Middle East and Africa
-
What are the key growth drivers and market challenges?
-
Who are the major players in the Childrens Footwear Market?
-
Adidas AG, ASICS Corp., Bata Brands Sarl, Bobux International Ltd., Burberry Group Plc, C and J Clark International Ltd., Columbia Sportswear Co., Crocs Inc., Dolce and Gabbana S.r.l., Falc Spa, FILA Holdings Corp., Geox S.p.A, JD Sports Fashion Plc, KEEN Inc., New Balance Athletics Inc., Nike Inc., PUMA SE, Skechers USA Inc., SportsDirect.com Retail Ltd., and Wolverine World Wide Inc.
Market Research Insights
- The children's footwear market is a continually evolving industry, with ongoing advancements in design, materials, and manufacturing processes. Two notable trends include footwear component selection for improved product life extension and the integration of sustainable materials. For instance, a leading brand successfully increased sales by 15% by incorporating longer-lasting rubber soles and reinforced stitching in their product line. Additionally, industry growth is anticipated to reach 5% annually over the next five years, driven by consumer demand for eco-friendly options and innovative designs.
We can help! Our analysts can customize this childrens footwear market research report to meet your requirements.
Get in touch
1 Executive Summary
- 1.1 Market overview
- Executive Summary - Chart on Market Overview
- Executive Summary - Data Table on Market Overview
- Executive Summary - Chart on Global Market Characteristics
- Executive Summary - Chart on Market by Geography
- Executive Summary - Chart on Market Segmentation by Product
- Executive Summary - Chart on Market Segmentation by Distribution Channel
- Executive Summary - Chart on Incremental Growth
- Executive Summary - Data Table on Incremental Growth
- Executive Summary - Chart on Company Market Positioning
2 Technavio Analysis
- 2.1 Analysis of price sensitivity, lifecycle, customer purchase basket, adoption rates, and purchase criteria
- Analysis of price sensitivity, lifecycle, customer purchase basket, adoption rates, and purchase criteria
- 2.2 Criticality of inputs and Factors of differentiation
- Overview on criticality of inputs and factors of differentiation
- 2.3 Factors of disruption
- Overview on factors of disruption
- 2.4 Impact of drivers and challenges
- Impact of drivers and challenges in 2024 and 2029
3 Market Landscape
- 3.1 Market ecosystem
- Parent Market
- Data Table on - Parent Market
- 3.2 Market characteristics
- Market characteristics analysis
4 Market Sizing
- 4.1 Market definition
- Offerings of companies included in the market definition
- 4.2 Market segment analysis
- 4.4 Market outlook: Forecast for 2024-2029
- Chart on Global - Market size and forecast 2024-2029 ($ million)
- Data Table on Global - Market size and forecast 2024-2029 ($ million)
- Chart on Global Market: Year-over-year growth 2024-2029 (%)
- Data Table on Global Market: Year-over-year growth 2024-2029 (%)
5 Historic Market Size
- 5.1 Global Childrens Footwear Market 2019 - 2023
- Historic Market Size - Data Table on Global Childrens Footwear Market 2019 - 2023 ($ million)
- 5.2 Product segment analysis 2019 - 2023
- Historic Market Size - Product Segment 2019 - 2023 ($ million)
- 5.3 Distribution Channel segment analysis 2019 - 2023
- Historic Market Size - Distribution Channel Segment 2019 - 2023 ($ million)
- 5.4 Geography segment analysis 2019 - 2023
- Historic Market Size - Geography Segment 2019 - 2023 ($ million)
- 5.5 Country segment analysis 2019 - 2023
- Historic Market Size - Country Segment 2019 - 2023 ($ million)
6 Qualitative Analysis
- 6.1 Impact of AI on global childrens footwear market
7 Five Forces Analysis
- 7.1 Five forces summary
- Five forces analysis - Comparison between 2024 and 2029
- 7.2 Bargaining power of buyers
- Bargaining power of buyers - Impact of key factors 2024 and 2029
- 7.3 Bargaining power of suppliers
- Bargaining power of suppliers - Impact of key factors in 2024 and 2029
- 7.4 Threat of new entrants
- Threat of new entrants - Impact of key factors in 2024 and 2029
- 7.5 Threat of substitutes
- Threat of substitutes - Impact of key factors in 2024 and 2029
- 7.6 Threat of rivalry
- Threat of rivalry - Impact of key factors in 2024 and 2029
- 7.7 Market condition
- Chart on Market condition - Five forces 2024 and 2029
8 Market Segmentation by Product
- 8.1 Market segments
- Chart on Product - Market share (2024-2029) (%)
- Data Table on Product - Market share (2024-2029) (%)
- 8.2 Comparison by Product
- Chart on Comparison by Product
- Data Table on Comparison by Product
- 8.3 Non athletic footwear - Market size and forecast (2024-2029)
- Chart on Non athletic footwear - Market size and forecast (2024-2029) ($ million)
- Data Table on Non athletic footwear - Market size and forecast (2024-2029) ($ million)
- Chart on Non athletic footwear - Year-over-year growth (2024-2029) (%)
- Data Table on Non athletic footwear - Year-over-year growth (2024-2029) (%)
- 8.4 Athletic footwear - Market size and forecast (2024-2029)
- Chart on Athletic footwear - Market size and forecast (2024-2029) ($ million)
- Data Table on Athletic footwear - Market size and forecast (2024-2029) ($ million)
- Chart on Athletic footwear - Year-over-year growth (2024-2029) (%)
- Data Table on Athletic footwear - Year-over-year growth (2024-2029) (%)
- 8.5 Market opportunity by Product
- Market opportunity by Product ($ million)
- Data Table on Market opportunity by Product ($ million)
9 Market Segmentation by Distribution Channel
- 9.1 Market segments
- Chart on Distribution Channel - Market share (2024-2029) (%)
- Data Table on Distribution Channel - Market share (2024-2029) (%)
- 9.2 Comparison by Distribution Channel
- Chart on Comparison by Distribution Channel
- Data Table on Comparison by Distribution Channel
- 9.3 Offline - Market size and forecast (2024-2029)
- Chart on Offline - Market size and forecast (2024-2029) ($ million)
- Data Table on Offline - Market size and forecast (2024-2029) ($ million)
- Chart on Offline - Year-over-year growth (2024-2029) (%)
- Data Table on Offline - Year-over-year growth (2024-2029) (%)
- 9.4 Online - Market size and forecast (2024-2029)
- Chart on Online - Market size and forecast (2024-2029) ($ million)
- Data Table on Online - Market size and forecast (2024-2029) ($ million)
- Chart on Online - Year-over-year growth (2024-2029) (%)
- Data Table on Online - Year-over-year growth (2024-2029) (%)
- 9.5 Market opportunity by Distribution Channel
- Market opportunity by Distribution Channel ($ million)
- Data Table on Market opportunity by Distribution Channel ($ million)
10 Market Segmentation by Material Type
- 10.1 Market segments
- Chart on Material Type - Market share (2024-2029) (%)
- Data Table on Material Type - Market share (2024-2029) (%)
- 10.2 Comparison by Material Type
- Chart on Comparison by Material Type
- Data Table on Comparison by Material Type
- 10.3 Leather - Market size and forecast (2024-2029)
- Chart on Leather - Market size and forecast (2024-2029) ($ million)
- Data Table on Leather - Market size and forecast (2024-2029) ($ million)
- Chart on Leather - Year-over-year growth (2024-2029) (%)
- Data Table on Leather - Year-over-year growth (2024-2029) (%)
- 10.4 Synthetic - Market size and forecast (2024-2029)
- Chart on Synthetic - Market size and forecast (2024-2029) ($ million)
- Data Table on Synthetic - Market size and forecast (2024-2029) ($ million)
- Chart on Synthetic - Year-over-year growth (2024-2029) (%)
- Data Table on Synthetic - Year-over-year growth (2024-2029) (%)
- 10.5 Textile - Market size and forecast (2024-2029)
- Chart on Textile - Market size and forecast (2024-2029) ($ million)
- Data Table on Textile - Market size and forecast (2024-2029) ($ million)
- Chart on Textile - Year-over-year growth (2024-2029) (%)
- Data Table on Textile - Year-over-year growth (2024-2029) (%)
- 10.6 Market opportunity by Material Type
- Market opportunity by Material Type ($ million)
- Data Table on Market opportunity by Material Type ($ million)
11 Market Segmentation by Gender
- 11.1 Market segments
- Chart on Gender - Market share (2024-2029) (%)
- Data Table on Gender - Market share (2024-2029) (%)
- 11.2 Comparison by Gender
- Chart on Comparison by Gender
- Data Table on Comparison by Gender
- 11.3 Boys - Market size and forecast (2024-2029)
- Chart on Boys - Market size and forecast (2024-2029) ($ million)
- Data Table on Boys - Market size and forecast (2024-2029) ($ million)
- Chart on Boys - Year-over-year growth (2024-2029) (%)
- Data Table on Boys - Year-over-year growth (2024-2029) (%)
- 11.4 Girls - Market size and forecast (2024-2029)
- Chart on Girls - Market size and forecast (2024-2029) ($ million)
- Data Table on Girls - Market size and forecast (2024-2029) ($ million)
- Chart on Girls - Year-over-year growth (2024-2029) (%)
- Data Table on Girls - Year-over-year growth (2024-2029) (%)
- 11.5 Unisex - Market size and forecast (2024-2029)
- Chart on Unisex - Market size and forecast (2024-2029) ($ million)
- Data Table on Unisex - Market size and forecast (2024-2029) ($ million)
- Chart on Unisex - Year-over-year growth (2024-2029) (%)
- Data Table on Unisex - Year-over-year growth (2024-2029) (%)
- 11.6 Market opportunity by Gender
- Market opportunity by Gender ($ million)
- Data Table on Market opportunity by Gender ($ million)
12 Market Segmentation by Age Group
- 12.1 Market segments
- Chart on Age Group - Market share (2024-2029) (%)
- Data Table on Age Group - Market share (2024-2029) (%)
- 12.2 Comparison by Age Group
- Chart on Comparison by Age Group
- Data Table on Comparison by Age Group
- 12.3 Infants (0-2 Years) - Market size and forecast (2024-2029)
- Chart on Infants (0-2 Years) - Market size and forecast (2024-2029) ($ million)
- Data Table on Infants (0-2 Years) - Market size and forecast (2024-2029) ($ million)
- Chart on Infants (0-2 Years) - Year-over-year growth (2024-2029) (%)
- Data Table on Infants (0-2 Years) - Year-over-year growth (2024-2029) (%)
- 12.4 Toddlers (2-5 Years) - Market size and forecast (2024-2029)
- Chart on Toddlers (2-5 Years) - Market size and forecast (2024-2029) ($ million)
- Data Table on Toddlers (2-5 Years) - Market size and forecast (2024-2029) ($ million)
- Chart on Toddlers (2-5 Years) - Year-over-year growth (2024-2029) (%)
- Data Table on Toddlers (2-5 Years) - Year-over-year growth (2024-2029) (%)
- 12.5 Kids (5-12 Years) - Market size and forecast (2024-2029)
- Chart on Kids (5-12 Years) - Market size and forecast (2024-2029) ($ million)
- Data Table on Kids (5-12 Years) - Market size and forecast (2024-2029) ($ million)
- Chart on Kids (5-12 Years) - Year-over-year growth (2024-2029) (%)
- Data Table on Kids (5-12 Years) - Year-over-year growth (2024-2029) (%)
- 12.6 Market opportunity by Age Group
- Market opportunity by Age Group ($ million)
- Data Table on Market opportunity by Age Group ($ million)
13 Customer Landscape
- 13.1 Customer landscape overview
- Analysis of price sensitivity, lifecycle, customer purchase basket, adoption rates, and purchase criteria
14 Geographic Landscape
- 14.1 Geographic segmentation
- Chart on Market share by geography 2024-2029 (%)
- Data Table on Market share by geography 2024-2029 (%)
- 14.2 Geographic comparison
- Chart on Geographic comparison
- Data Table on Geographic comparison
- 14.3 APAC - Market size and forecast 2024-2029
- Chart on APAC - Market size and forecast 2024-2029 ($ million)
- Data Table on APAC - Market size and forecast 2024-2029 ($ million)
- Chart on APAC - Year-over-year growth 2024-2029 (%)
- Data Table on APAC - Year-over-year growth 2024-2029 (%)
- 14.4 North America - Market size and forecast 2024-2029
- Chart on North America - Market size and forecast 2024-2029 ($ million)
- Data Table on North America - Market size and forecast 2024-2029 ($ million)
- Chart on North America - Year-over-year growth 2024-2029 (%)
- Data Table on North America - Year-over-year growth 2024-2029 (%)
- 14.5 Europe - Market size and forecast 2024-2029
- Chart on Europe - Market size and forecast 2024-2029 ($ million)
- Data Table on Europe - Market size and forecast 2024-2029 ($ million)
- Chart on Europe - Year-over-year growth 2024-2029 (%)
- Data Table on Europe - Year-over-year growth 2024-2029 (%)
- 14.6 South America - Market size and forecast 2024-2029
- Chart on South America - Market size and forecast 2024-2029 ($ million)
- Data Table on South America - Market size and forecast 2024-2029 ($ million)
- Chart on South America - Year-over-year growth 2024-2029 (%)
- Data Table on South America - Year-over-year growth 2024-2029 (%)
- 14.7 Middle East and Africa - Market size and forecast 2024-2029
- Chart on Middle East and Africa - Market size and forecast 2024-2029 ($ million)
- Data Table on Middle East and Africa - Market size and forecast 2024-2029 ($ million)
- Chart on Middle East and Africa - Year-over-year growth 2024-2029 (%)
- Data Table on Middle East and Africa - Year-over-year growth 2024-2029 (%)
- 14.8 US - Market size and forecast 2024-2029
- Chart on US - Market size and forecast 2024-2029 ($ million)
- Data Table on US - Market size and forecast 2024-2029 ($ million)
- Chart on US - Year-over-year growth 2024-2029 (%)
- Data Table on US - Year-over-year growth 2024-2029 (%)
- 14.9 China - Market size and forecast 2024-2029
- Chart on China - Market size and forecast 2024-2029 ($ million)
- Data Table on China - Market size and forecast 2024-2029 ($ million)
- Chart on China - Year-over-year growth 2024-2029 (%)
- Data Table on China - Year-over-year growth 2024-2029 (%)
- 14.10 Germany - Market size and forecast 2024-2029
- Chart on Germany - Market size and forecast 2024-2029 ($ million)
- Data Table on Germany - Market size and forecast 2024-2029 ($ million)
- Chart on Germany - Year-over-year growth 2024-2029 (%)
- Data Table on Germany - Year-over-year growth 2024-2029 (%)
- 14.11 Canada - Market size and forecast 2024-2029
- Chart on Canada - Market size and forecast 2024-2029 ($ million)
- Data Table on Canada - Market size and forecast 2024-2029 ($ million)
- Chart on Canada - Year-over-year growth 2024-2029 (%)
- Data Table on Canada - Year-over-year growth 2024-2029 (%)
- 14.12 France - Market size and forecast 2024-2029
- Chart on France - Market size and forecast 2024-2029 ($ million)
- Data Table on France - Market size and forecast 2024-2029 ($ million)
- Chart on France - Year-over-year growth 2024-2029 (%)
- Data Table on France - Year-over-year growth 2024-2029 (%)
- 14.13 UK - Market size and forecast 2024-2029
- Chart on UK - Market size and forecast 2024-2029 ($ million)
- Data Table on UK - Market size and forecast 2024-2029 ($ million)
- Chart on UK - Year-over-year growth 2024-2029 (%)
- Data Table on UK - Year-over-year growth 2024-2029 (%)
- 14.14 Japan - Market size and forecast 2024-2029
- Chart on Japan - Market size and forecast 2024-2029 ($ million)
- Data Table on Japan - Market size and forecast 2024-2029 ($ million)
- Chart on Japan - Year-over-year growth 2024-2029 (%)
- Data Table on Japan - Year-over-year growth 2024-2029 (%)
- 14.15 Brazil - Market size and forecast 2024-2029
- Chart on Brazil - Market size and forecast 2024-2029 ($ million)
- Data Table on Brazil - Market size and forecast 2024-2029 ($ million)
- Chart on Brazil - Year-over-year growth 2024-2029 (%)
- Data Table on Brazil - Year-over-year growth 2024-2029 (%)
- 14.16 India - Market size and forecast 2024-2029
- Chart on India - Market size and forecast 2024-2029 ($ million)
- Data Table on India - Market size and forecast 2024-2029 ($ million)
- Chart on India - Year-over-year growth 2024-2029 (%)
- Data Table on India - Year-over-year growth 2024-2029 (%)
- 14.17 UAE - Market size and forecast 2024-2029
- Chart on UAE - Market size and forecast 2024-2029 ($ million)
- Data Table on UAE - Market size and forecast 2024-2029 ($ million)
- Chart on UAE - Year-over-year growth 2024-2029 (%)
- Data Table on UAE - Year-over-year growth 2024-2029 (%)
- 14.18 Market opportunity by geography
- Market opportunity by geography ($ million)
- Data Tables on Market opportunity by geography ($ million)
- 14.19 US - Market size and forecast (2024-2029)
- Chart on US - Market size and forecast (2024-2029) ($ million)
- Data Table on US - Market size and forecast (2024-2029) ($ million)
- Chart on US - Year-over-year growth (2024-2029) (%)
- Data Table on US - Year-over-year growth (2024-2029) (%)
- 14.20 Australia - Market size and forecast (2024-2029)
- Chart on Australia - Market size and forecast (2024-2029) ($ million)
- Data Table on Australia - Market size and forecast (2024-2029) ($ million)
- Chart on Australia - Year-over-year growth (2024-2029) (%)
- Data Table on Australia - Year-over-year growth (2024-2029) (%)
- 14.21 Rest of World (ROW) - Market size and forecast (2024-2029)
- Chart on Rest of World (ROW) - Market size and forecast (2024-2029) ($ million)
- Data Table on Rest of World (ROW) - Market size and forecast (2024-2029) ($ million)
- Chart on Rest of World (ROW) - Year-over-year growth (2024-2029) (%)
- Data Table on Rest of World (ROW) - Year-over-year growth (2024-2029) (%)
- 14.22 Saudi Arabia - Market size and forecast (2024-2029)
- Chart on Saudi Arabia - Market size and forecast (2024-2029) ($ million)
- Data Table on Saudi Arabia - Market size and forecast (2024-2029) ($ million)
- Chart on Saudi Arabia - Year-over-year growth (2024-2029) (%)
- Data Table on Saudi Arabia - Year-over-year growth (2024-2029) (%)
- 14.23 South Korea - Market size and forecast (2024-2029)
- Chart on South Korea - Market size and forecast (2024-2029) ($ million)
- Data Table on South Korea - Market size and forecast (2024-2029) ($ million)
- Chart on South Korea - Year-over-year growth (2024-2029) (%)
- Data Table on South Korea - Year-over-year growth (2024-2029) (%)
- 14.24 Mexico - Market size and forecast (2024-2029)
- Chart on Mexico - Market size and forecast (2024-2029) ($ million)
- Data Table on Mexico - Market size and forecast (2024-2029) ($ million)
- Chart on Mexico - Year-over-year growth (2024-2029) (%)
- Data Table on Mexico - Year-over-year growth (2024-2029) (%)
15 Drivers, Challenges, and Opportunity/Restraints
- 15.3 Impact of drivers and challenges
- Impact of drivers and challenges in 2024 and 2029
- 15.4 Market opportunities/restraints
16 Competitive Landscape
- 16.2 Competitive Landscape
- Overview on criticality of inputs and factors of differentiation
- 16.3 Landscape disruption
- Overview on factors of disruption
- 16.4 Industry risks
- Impact of key risks on business
17 Competitive Analysis
- 17.2 Company ranking index
- 17.3 Market positioning of companies
- Matrix on companies position and classification
- 17.4 Adidas AG
- Adidas AG - Overview
- Adidas AG - Business segments
- Adidas AG - Key news
- Adidas AG - Key offerings
- Adidas AG - Segment focus
- SWOT
- 17.5 ASICS Corp.
- ASICS Corp. - Overview
- ASICS Corp. - Product / Service
- ASICS Corp. - Key news
- ASICS Corp. - Key offerings
- SWOT
- 17.6 Bata Brands Sarl
- Bata Brands Sarl - Overview
- Bata Brands Sarl - Product / Service
- Bata Brands Sarl - Key offerings
- SWOT
- 17.7 Bobux International Ltd.
- Bobux International Ltd. - Overview
- Bobux International Ltd. - Product / Service
- Bobux International Ltd. - Key offerings
- SWOT
- 17.8 Burberry Group Plc
- Burberry Group Plc - Overview
- Burberry Group Plc - Business segments
- Burberry Group Plc - Key offerings
- Burberry Group Plc - Segment focus
- SWOT
- 17.9 C and J Clark International Ltd.
- C and J Clark International Ltd. - Overview
- C and J Clark International Ltd. - Product / Service
- C and J Clark International Ltd. - Key offerings
- SWOT
- 17.10 Columbia Sportswear Co.
- Columbia Sportswear Co. - Overview
- Columbia Sportswear Co. - Business segments
- Columbia Sportswear Co. - Key news
- Columbia Sportswear Co. - Key offerings
- Columbia Sportswear Co. - Segment focus
- SWOT
- 17.11 Crocs Inc.
- Crocs Inc. - Overview
- Crocs Inc. - Business segments
- Crocs Inc. - Key offerings
- Crocs Inc. - Segment focus
- SWOT
- 17.12 Dolce and Gabbana S.r.l.
- Dolce and Gabbana S.r.l. - Overview
- Dolce and Gabbana S.r.l. - Product / Service
- Dolce and Gabbana S.r.l. - Key offerings
- SWOT
- 17.13 Falc Spa
- Falc Spa - Overview
- Falc Spa - Product / Service
- Falc Spa - Key offerings
- SWOT
- 17.14 FILA Holdings Corp.
- FILA Holdings Corp. - Overview
- FILA Holdings Corp. - Product / Service
- FILA Holdings Corp. - Key offerings
- SWOT
- 17.15 Geox S.p.A
- Geox S.p.A - Overview
- Geox S.p.A - Business segments
- Geox S.p.A - Key offerings
- Geox S.p.A - Segment focus
- SWOT
- 17.16 JD Sports Fashion Plc
- JD Sports Fashion Plc - Overview
- JD Sports Fashion Plc - Product / Service
- JD Sports Fashion Plc - Key offerings
- SWOT
- 17.17 KEEN Inc.
- KEEN Inc. - Overview
- KEEN Inc. - Product / Service
- KEEN Inc. - Key offerings
- SWOT
- 17.18 New Balance Athletics Inc.
- New Balance Athletics Inc. - Overview
- New Balance Athletics Inc. - Product / Service
- New Balance Athletics Inc. - Key news
- New Balance Athletics Inc. - Key offerings
- SWOT
18 Appendix
- 18.2 Inclusions and exclusions checklist
- Inclusions checklist
- Exclusions checklist
- 18.3 Currency conversion rates for US$
- Currency conversion rates for US$
- 18.4 Research methodology
- 18.7 Validation techniques employed for market sizing
- Validation techniques employed for market sizing
- 18.9 360 degree market analysis
- 360 degree market analysis
- 18.10 List of abbreviations