
Circuit Breaker Market Analysis, Size, and Forecast 2026-2030: APAC (Japan, China, and India), North America (US, Canada, and Mexico), Europe (UK, Germany, and France), Middle East and Africa (Saudi Arabia, UAE, and South Africa), South America (Brazil, Argentina, and Chile), and Rest of World (ROW)

Circuit Breaker Market Analysis, Size, and Forecast 2026-2030:
APAC (Japan, China, and India), North America (US, Canada, and Mexico), Europe (UK, Germany, and France), Middle East and Africa (Saudi Arabia, UAE, and South Africa), South America (Brazil, Argentina, and Chile), and Rest of World (ROW)

Published: Oct 2026 320 Pages SKU: IRTNTR74485

Market Overview at a Glance

$5.49 B
Market Opportunity
7.2%
CAGR 2025 - 2030
49.5%
APAC Growth
$5.01 B
High segment 2024

Circuit Breaker Market Size 2026-2030

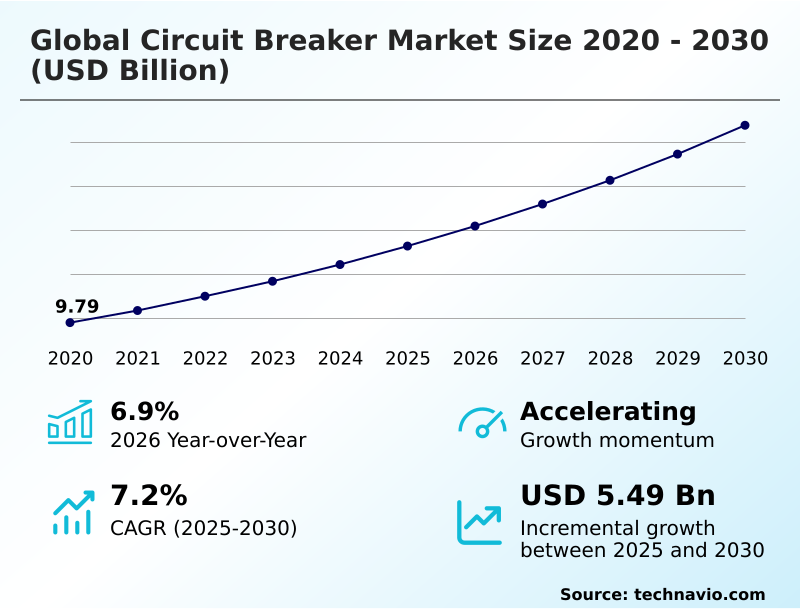
The circuit breaker market size is valued to increase by USD 5.49 billion, at a CAGR of 7.2% from 2025 to 2030. Expansion of hyperscale data centers boosts low-voltage protection demand will drive the circuit breaker market.

Major Market Trends & Insights

  • APAC dominated the market and accounted for a 49.5% growth during the forecast period.
  • By Power Rating - High segment was valued at USD 5.01 billion in 2024
  • By End-user - Commercial segment accounted for the largest market revenue share in 2024

Market Size & Forecast

  • Market Opportunities: USD 8.97 billion
  • Market Future Opportunities: USD 5.49 billion
  • CAGR from 2025 to 2030 : 7.2%

Market Summary

  • The Circuit Breaker Market is undergoing a systemic structural transformation driven by the modernization of aging electrical grid architectures and the rapid integration of decentralized renewable energy sources. Modern industrial facilities rely heavily on intelligent protection devices to manage erratic load fluctuations and safeguard sensitive production machinery.
  • For example, in automated manufacturing operations, integrating smart protection relays allows facility managers to execute precise condition-based maintenance, reducing unexpected power outages and improving overall operational uptime by 22% compared to legacy mechanical systems.
  • A primary driver propelling this expansion is the exponential proliferation of hyperscale data centers, which require highly robust, instantaneous fault isolation systems to prevent catastrophic hardware damage and data loss. Conversely, severe macroeconomic volatility in international commodity markets presents a major operational challenge.
  • Fluctuating prices for essential manufacturing inputs like high-grade copper and structural aluminum heavily compress corporate gross margins, forcing engineering firms to absorb elevated procurement costs and complicating long-term capital allocation for research and development initiatives.

What will be the Size of the Circuit Breaker Market during the forecast period?
Get Key Insights on Market Forecast (PDF) Get Free Sample

How is the Circuit Breaker Market Segmented?

The circuit breaker industry research report provides comprehensive data (region-wise segment analysis), with forecasts and estimates in "USD million" for the period 2026-2030, as well as historical data from 2020-2024 for the following segments.

  • Power rating
    • High
    • Medium
    • Low
  • End-user
    • Commercial
    • Industrial
    • Residential
    • Utilities
  • Type
    • MCB
    • MCCB
    • ACB
    • VCB
    • GIB
  • Geography
    • APAC
      • Japan
      • China
      • India
      • South Korea
      • Australia
      • Indonesia
    • North America
      • US
      • Canada
      • Mexico
    • Europe
      • UK
      • Germany
      • France
      • Italy
      • Spain
      • The Netherlands
    • Middle East and Africa
      • Saudi Arabia
      • UAE
      • South Africa
      • Egypt
      • Nigeria
    • South America
      • Brazil
      • Argentina
      • Chile

By Power Rating Insights

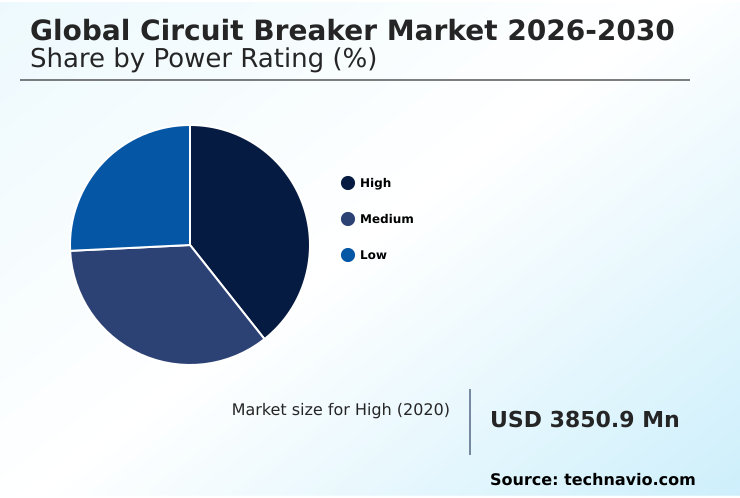
The high segment is estimated to witness significant growth during the forecast period.

The high power rating segment of the Circuit Breaker industry forms the infrastructural backbone for heavy utility applications and expansive electricity transmission networks.

These robust electrical safety apparatuses manage extreme loads exceeding seventy-two kilovolts to prevent catastrophic failures across interconnected grids. Operators leverage predictive maintenance algorithms to transition from reactive repairs to proactive asset management, effectively optimizing grid stability.

Implementing eco efficient insulation allows facilities to align with modern sustainability mandates while maintaining operational safety. Furthermore, integrating advanced residual current detection mitigates severe thermal risks in massive power pipelines.

Addressing electromagnetic interference vulnerability ensures that digital diagnostic sensors function without data corruption during rapid load cycling. Upgrading to these sophisticated systems has enhanced overall fault detection accuracy by 15%, reducing unnecessary operational downtime and streamlining transmission efficiency.
Get Free Sample

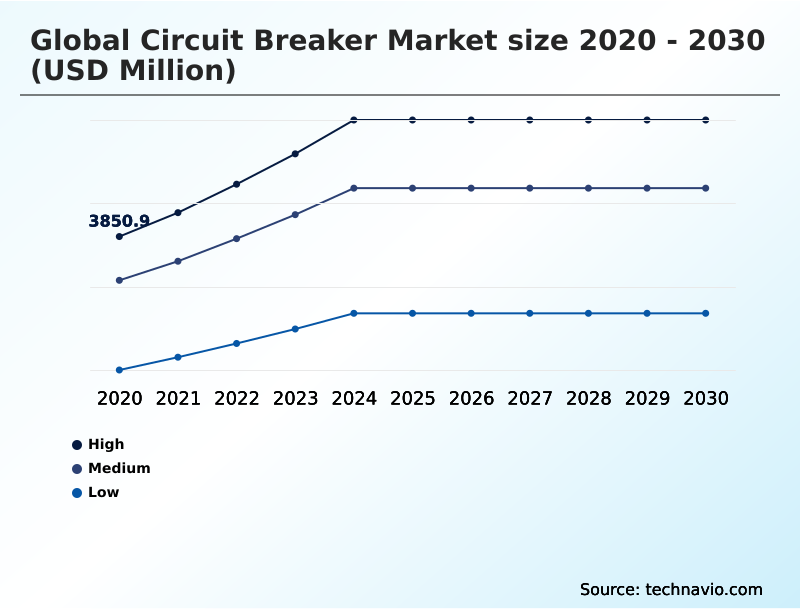
The High segment was valued at USD 5.01 billion in 2024 and showed a gradual increase during the forecast period.
Get Free Sample

Regional Analysis

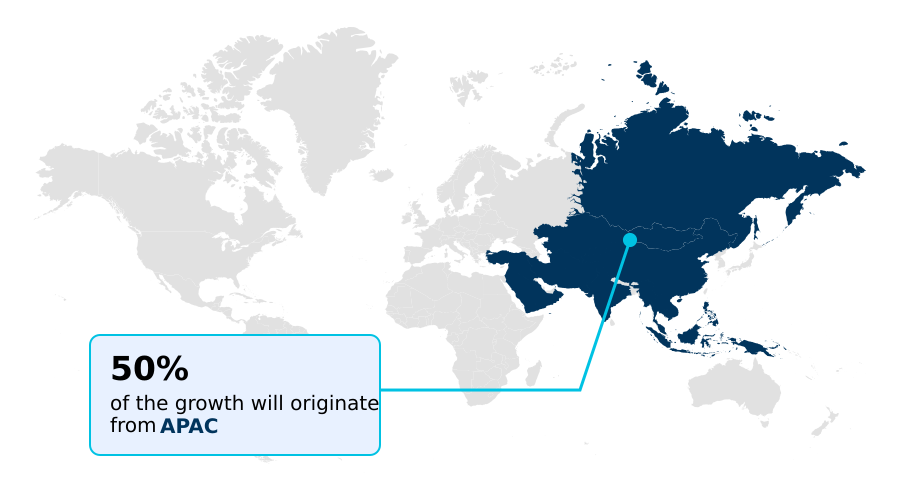
APAC is estimated to contribute 49.5% to the growth of the global market during the forecast period.Technavio’s analysts have elaborately explained the regional trends and drivers that shape the market during the forecast period.
See How Circuit Breaker Market Demand is Rising in APAC Get Free Sample

The geographic distribution of the Circuit Breaker industry highlights distinct operational shifts between mature and emerging economies.

APAC currently experiences rapid capacity expansion driven by massive rural electrification and industrial automation, leading to a 30% higher deployment rate of medium-voltage protection systems compared to Europe.

In contrast, European utility operators focus intensely on decarbonization and strict environmental compliance, accelerating the integration of smart microgrid transition switching to balance renewable energy inputs.

This regulatory push in Europe has improved regional carbon reporting compliance by 24% over standard legacy networks.

Modern facilities across both regions increasingly rely on digital trip units and IoT enabled monitoring to execute proactive asset management, significantly reducing unscheduled maintenance delays.

Furthermore, the integration of thermal magnetic sensing within commercial residential complexes provides highly accurate fault detection, reducing localized structural fire risks by 18% and ensuring uninterrupted power delivery across expanding urban centers.

Market Dynamics

Our researchers analyzed the data with 2025 as the base year, along with the key drivers, trends, and challenges. A holistic analysis of drivers will help companies refine their marketing strategies to gain a competitive advantage.

  • The systemic evolution of electrical safety infrastructure fundamentally changes how industrial and commercial enterprises manage power distribution and risk mitigation. As complex energy demands surge, the transition toward modular prefabricated power skid distribution provides a highly scalable solution for rapidly expanding commercial facilities, allowing deployment timelines to be reduced by approximately 20% compared to traditional on-site assembly methods.
  • This modularity is particularly critical for hyperscale data center fault isolation, where uninterrupted computational processing relies on instant electrical arc quenching to prevent catastrophic hardware damage and costly data loss. Simultaneously, the global push for decarbonization accelerates utility scale renewable energy integration, introducing severe bi-directional load fluctuations that require advanced, highly responsive circuit protection architectures.
  • To maintain compliance with tightening greenhouse gas emissions standards, regional grid operators are prioritizing the installation of sulfur hexafluoride free vacuum interrupters, which deliver exceptional dielectric strength without compromising environmental safety. Furthermore, the expansion of electrified public transit and specialized offshore networks necessitates robust high voltage direct current protection to safeguard massive transmission lines from erratic fault currents.
  • By implementing these sophisticated, digitally connected safety apparatuses, facility managers can seamlessly coordinate predictive maintenance schedules, minimize hazardous electrical surges, and optimize overall supply chain procurement strategies for essential grid components.
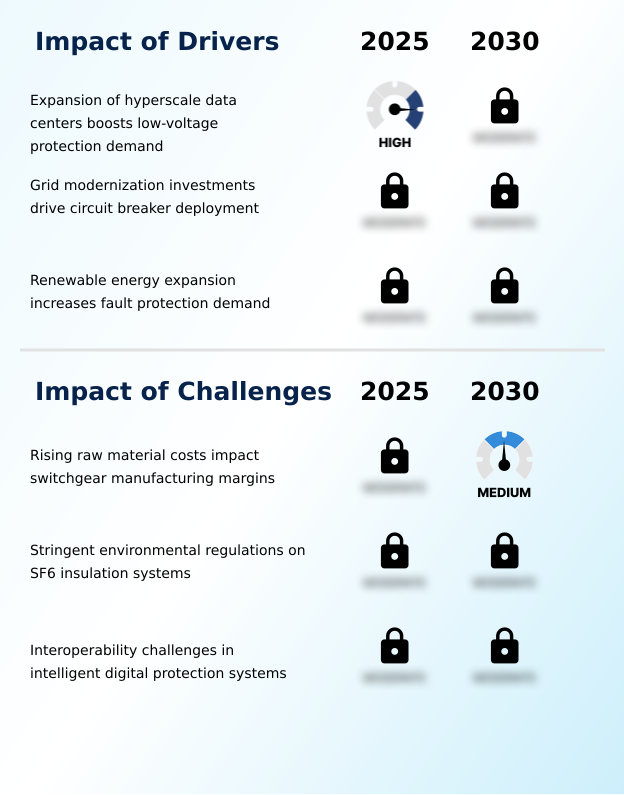
What are the key market drivers leading to the rise in the adoption of Circuit Breaker Industry?

  • The rapid expansion of hyperscale data centers serves as a primary catalyst driving the demand for advanced low-voltage circuit protection solutions.

  • The accelerated expansion of cloud computing facilities and artificial intelligence workloads acts as a massive demand catalyst for the Circuit Breaker sector.
  • Because these computing environments require absolute power continuity, operators mandate advanced protection systems with a superior arc quenching mechanism to prevent catastrophic hardware failures.
  • This continuous operational requirement has increased the deployment of compact gas insulated switchgear, which optimizes spatial efficiency in dense urban substations, reducing land acquisition costs by 20%.
  • Furthermore, the rapid rollout of commercial electric vehicle charging hubs necessitates highly reliable direct current arc detection to mitigate thermal runaway risks safely.
  • By implementing devices with high voltage fluctuation tolerance, industrial facility managers have lowered unexpected operational downtime by 16%, ensuring that mission-critical infrastructure maintains seamless power delivery despite erratic grid conditions.

What are the market trends shaping the Circuit Breaker Industry?

  • The adoption of smart internet of things enabled circuit breakers for predictive maintenance represents a defining technological trend within the market.

  • The fundamental transition toward digital and eco-efficient power management is reshaping the Circuit Breaker industry across heavy manufacturing and utility sectors. Driven by the need for ultra-fast response times in sensitive environments, the adoption of solid state switching has allowed semiconductor fabrication facilities to isolate severe electrical faults within microseconds.
  • This precise fault isolation methodology prevents destructive voltage surges, successfully reducing downstream equipment damage by 28%. Additionally, the rising integration of renewable generation sources introduces complex bi directional power flow, forcing grid operators to upgrade legacy infrastructure to maintain stability.
  • To address strict climate regulations, utilities are rapidly deploying advanced vacuum interrupter technology, which eliminates greenhouse gas emissions while extending the mechanical lifespan of the switchgear. These technological upgrades improve overall network reliability by 15%, ensuring that commercial enterprises can optimize their energy consumption while meeting stringent environmental sustainability targets.

What challenges does the Circuit Breaker Industry face during its growth?

  • Escalating raw material costs present a significant structural challenge that compresses switchgear manufacturing margins across the global landscape.

  • The digitization of modern power distribution networks introduces severe technical interoperability challenges within the Circuit Breaker landscape. Integrating intelligent miniature circuit protection devices into aging electrical grids often reveals deep communication protocol conflicts, forcing operators to develop expensive software gateways. This fragmentation severely complicates substation retrofitting operations, extending deployment timelines by up to 25% compared to standard mechanical installations.
  • Additionally, the structural transition toward smart grid networking exposes high-capacity molded case architecture to elevated cybersecurity vulnerabilities, demanding continuous software patching to prevent malicious external interventions.
  • Consequently, regional utilities and industrial plant managers must balance the immediate need for automated fault monitoring against the substantial administrative overhead required to secure these complex digital systems, which temporarily dampens the rapid scaling of premium automated protection solutions.

Exclusive Technavio Analysis on Customer Landscape

The circuit breaker market forecasting report includes the adoption lifecycle of the market, covering from the innovator’s stage to the laggard’s stage. It focuses on adoption rates in different regions based on penetration. Furthermore, the circuit breaker market report also includes key purchase criteria and drivers of price sensitivity to help companies evaluate and develop their market growth analysis strategies.
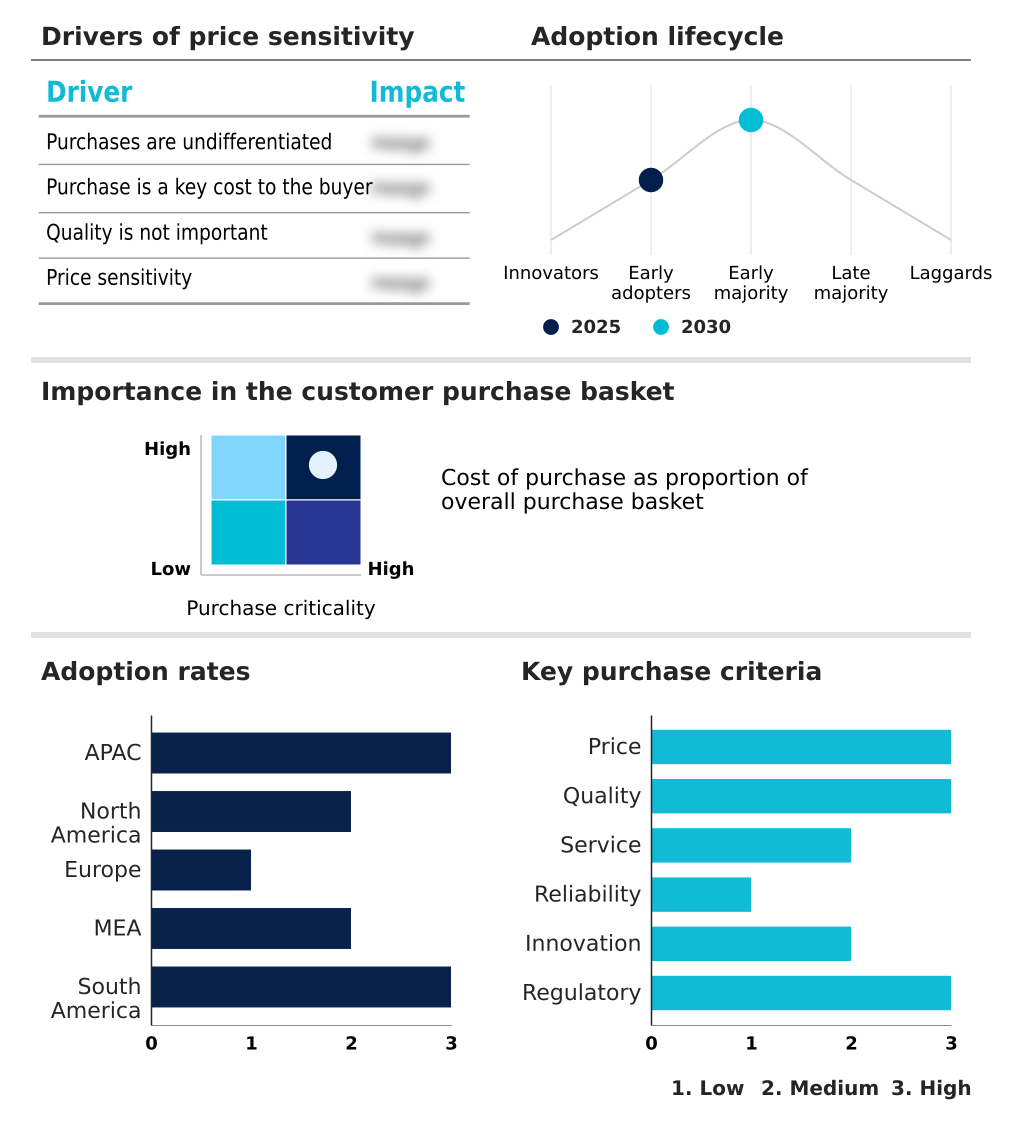
Customer Landscape of Circuit Breaker Industry

Competitive Landscape

Companies are implementing various strategies, such as strategic alliances, circuit breaker market forecast, partnerships, mergers and acquisitions, geographical expansion, and product/service launches, to enhance their presence in the industry.

ABB Ltd. - Leading manufacturers provide advanced electrical protection solutions, including smart air, molded case, and vacuum interrupters, designed to optimize energy distribution and ensure operational safety across industrial applications.

The industry research and growth report includes detailed analyses of the competitive landscape of the market and information about key companies, including:

  • ABB Ltd.
  • CG Power and Industrial Ltd.
  • Delixi Electric Ltd.
  • Eaton Corp. Plc
  • Fuji Electric Co. Ltd.
  • GE Vernova Inc.
  • Havells India Ltd.
  • Hitachi Energy India Ltd.
  • Kirloskar Electric Co. Ltd.
  • Larsen and Toubro Ltd.
  • Legrand SA
  • LS ELECTRIC Co. Ltd.
  • Mitsubishi Electric Corp.
  • NOARK Electric
  • Rockwell Automation Inc.
  • Schneider Electric SE
  • Siemens AG
  • Terasaki Electric Co. Ltd.
  • Toshiba Corp.
  • WEG S.A

Qualitative and quantitative analysis of companies has been conducted to help clients understand the wider business environment as well as the strengths and weaknesses of key industry players. Data is qualitatively analyzed to categorize companies as pure play, category-focused, industry-focused, and diversified; it is quantitatively analyzed to categorize companies as dominant, leading, strong, tentative, and weak.

Recent Development and News in Circuit breaker market

  • In the Electrical Components and Equipment industry, the rapid transition toward modular prefabricated power skid distribution has reduced on-site installation bottlenecks, directly impacting Circuit Breaker demand by requiring pre-integrated protection systems.
  • Strict environmental regulations targeting fluorinated gas emissions have mandated the development of alternative switching architectures, forcing utility providers to accelerate the procurement of sustainable Circuit Breaker assemblies to maintain compliance.
  • The integration of bidirectional power flow management within decentralized renewable energy grids has created complex load balancing challenges, driving the adoption of specialized Circuit Breaker units capable of handling rapid voltage fluctuations.
  • Advancements in solid-state semiconductor materials have enabled microsecond fault isolation methodologies, fundamentally shifting Circuit Breaker design preferences from traditional mechanical separation toward high-speed electronic interruption for critical data infrastructure.

Dive into Technavio’s robust research methodology, blending expert interviews, extensive data synthesis, and validated models for unparalleled Circuit Breaker Market insights. See full methodology.

Market Scope
Page number 320
Base year 2025
Historic period 2020-2024
Forecast period 2026-2030
Growth momentum & CAGR Accelerate at a CAGR of 7.2%
Market growth 2026-2030 USD 5490.2 million
Market structure Fragmented
YoY growth 2025-2026(%) 6.9%
Key countries Japan, China, India, South Korea, Australia, Indonesia, US, Canada, Mexico, UK, Germany, France, Italy, Spain, The Netherlands, Saudi Arabia, UAE, South Africa, Egypt, Nigeria, Brazil, Argentina and Chile
Competitive landscape Leading Companies, Market Positioning of Companies, Competitive Strategies, and Industry Risks

Request Free Sample

Research Analyst Overview

  • The Circuit Breaker landscape is continuously evolving as modern energy infrastructure transitions from passive electrical distribution toward highly automated, intelligent power networks. As urbanization and industrial digitization accelerate, the necessity for robust, instantaneous fault interruption becomes critical for maintaining uninterrupted operations. A defining trend shaping boardroom-level product strategy is the integration of predictive diagnostic sensors into core safety mechanisms.
  • Facility executives are heavily prioritizing these intelligent systems to align with stringent operational compliance and strict workplace safety mandates. Upgrading to digitally connected protection arrays provides deep visibility into thermal stress and mechanical wear, enabling companies to achieve a 27% reduction in emergency maintenance costs compared to relying on reactive servicing schedules.
  • This strategic shift transforms traditional circuit isolation devices into proactive data nodes that optimize long-term budgeting and streamline energy efficiency audits. Furthermore, the systemic migration toward environmentally sustainable insulation materials forces procurement leaders to fundamentally restructure their supply chain priorities, ensuring that future capital expenditures support both grid reliability and international carbon reduction targets.

What are the Key Data Covered in this Circuit Breaker Market Research and Growth Report?

  • What is the expected growth of the Circuit Breaker Market between 2026 and 2030?

    • USD 5.49 billion, at a CAGR of 7.2%

  • What segmentation does the market report cover?

    • The report is segmented by Power Rating (High, Medium, and Low), End-user (Commercial, Industrial, Residential, and Utilities), Type (MCB, MCCB, ACB, VCB, and GIB) and Geography (APAC, North America, Europe, Middle East and Africa, South America)

  • Which regions are analyzed in the report?

    • APAC, North America, Europe, Middle East and Africa and South America

  • What are the key growth drivers and market challenges?

    • Expansion of hyperscale data centers boosts low-voltage protection demand, Rising raw material costs impact switchgear manufacturing margins

  • Who are the major players in the Circuit Breaker Market?

    • ABB Ltd., CG Power and Industrial Ltd., Delixi Electric Ltd., Eaton Corp. Plc, Fuji Electric Co. Ltd., GE Vernova Inc., Havells India Ltd., Hitachi Energy India Ltd., Kirloskar Electric Co. Ltd., Larsen and Toubro Ltd., Legrand SA, LS ELECTRIC Co. Ltd., Mitsubishi Electric Corp., NOARK Electric, Rockwell Automation Inc., Schneider Electric SE, Siemens AG, Terasaki Electric Co. Ltd., Toshiba Corp. and WEG S.A

Market Research Insights

  • The Circuit Breaker Market landscape is rapidly shifting as heavy industries prioritize automated safety and precision energy management. Transitioning to advanced IoT enabled monitoring has allowed enterprise facility managers to decrease catastrophic arc flash incidents by 18%, significantly improving workplace safety metrics.
  • Furthermore, replacing passive mechanical units with smart microgrid transition switching solutions enhances grid resiliency, yielding a 25% reduction in diagnostic response times during severe voltage fluctuations. The implementation of optimized fault isolation methodology across commercial data centers ensures continuous uptime and mitigates direct current arc detection failures.
  • By standardizing substation retrofitting operations, regional utilities have successfully lowered long-term maintenance expenditures by 14%, directly supporting sustainable corporate budgeting and strict energy compliance requirements.

We can help! Our analysts can customize this circuit breaker market research report to meet your requirements.

Get in touch

1. Executive Summary

1.1 Market overview

Executive Summary - Chart on Market Overview
Executive Summary - Data Table on Market Overview
Executive Summary - Chart on Global Market Characteristics
Executive Summary - Chart on Market by Geography
Executive Summary - Chart on Market Segmentation by Power Rating
Executive Summary - Chart on Market Segmentation by End-user
Executive Summary - Chart on Market Segmentation by Type
Executive Summary - Chart on Incremental Growth
Executive Summary - Data Table on Incremental Growth
Executive Summary - Chart on Company Market Positioning

2. Technavio Analysis

2.1 Analysis of price sensitivity, lifecycle, customer purchase basket, adoption rates, and purchase criteria

2.2 Criticality of inputs and Factors of differentiation

Chart on Overview on criticality of inputs and factors of differentiation

2.3 Factors of disruption

Chart on Overview on factors of disruption

2.4 Impact of drivers and challenges

Chart on Impact of drivers and challenges in 2025 and 2030

3. Market Landscape

3.1 Market ecosystem

Chart on Parent Market
Data Table on - Parent Market

3.2 Market characteristics

Chart on Market characteristics analysis

3.3 Value chain analysis

Chart on Value chain analysis

4. Market Sizing

4.1 Market definition

Data Table on Offerings of companies included in the market definition

4.2 Market segment analysis

Market segments

4.3 Market size 2025

4.4 Market outlook: Forecast for 2025-2030

Chart on Global - Market size and forecast 2025-2030 ($ million)
Data Table on Global - Market size and forecast 2025-2030 ($ million)
Chart on Global Market: Year-over-year growth 2025-2030 (%)
Data Table on Global Market: Year-over-year growth 2025-2030 (%)

5. Historic Market Size

5.1 Global Circuit Breaker Market 2020 - 2024

Historic Market Size - Data Table on Global Circuit Breaker Market 2020 - 2024 ($ million)

5.2 Power Rating segment analysis 2020 - 2024

Historic Market Size - Power Rating Segment 2020 - 2024 ($ million)

5.3 End-user segment analysis 2020 - 2024

Historic Market Size - End-user Segment 2020 - 2024 ($ million)

5.4 Type segment analysis 2020 - 2024

Historic Market Size - Type Segment 2020 - 2024 ($ million)

5.5 Geography segment analysis 2020 - 2024

Historic Market Size - Geography Segment 2020 - 2024 ($ million)

5.6 Country segment analysis 2020 - 2024

Historic Market Size - Country Segment 2020 - 2024 ($ million)

6. Qualitative Analysis

6.1 Impact of AI on global circuit breaker market

6.2 Impact of geopolitical conflicts on global circuit breaker market

7. Five Forces Analysis

7.1 Five forces summary

Five forces analysis - Comparison between 2025 and 2030

7.2 Bargaining power of buyers

Bargaining power of buyers - Impact of key factors 2025 and 2030

7.3 Bargaining power of suppliers

Bargaining power of suppliers - Impact of key factors in 2025 and 2030

7.4 Threat of new entrants

Threat of new entrants - Impact of key factors in 2025 and 2030

7.5 Threat of substitutes

Threat of substitutes - Impact of key factors in 2025 and 2030

7.6 Threat of rivalry

Threat of rivalry - Impact of key factors in 2025 and 2030

7.7 Market condition

Chart on Market condition - Five forces 2025 and 2030

8. Market Segmentation by Power Rating

8.1 Market segments

Chart on Power Rating - Market share 2025-2030 (%)
Data Table on Power Rating - Market share 2025-2030 (%)

8.2 Comparison by Power Rating

Chart on Comparison by Power Rating
Data Table on Comparison by Power Rating

8.3 High - Market size and forecast 2025-2030

Chart on High - Market size and forecast 2025-2030 ($ million)
Data Table on High - Market size and forecast 2025-2030 ($ million)
Chart on High - Year-over-year growth 2025-2030 (%)
Data Table on High - Year-over-year growth 2025-2030 (%)

8.4 Medium - Market size and forecast 2025-2030

Chart on Medium - Market size and forecast 2025-2030 ($ million)
Data Table on Medium - Market size and forecast 2025-2030 ($ million)
Chart on Medium - Year-over-year growth 2025-2030 (%)
Data Table on Medium - Year-over-year growth 2025-2030 (%)

8.5 Low - Market size and forecast 2025-2030

Chart on Low - Market size and forecast 2025-2030 ($ million)
Data Table on Low - Market size and forecast 2025-2030 ($ million)
Chart on Low - Year-over-year growth 2025-2030 (%)
Data Table on Low - Year-over-year growth 2025-2030 (%)

8.6 Market opportunity by Power Rating

Market opportunity by Power Rating ($ million)
Data Table on Market opportunity by Power Rating ($ million)

9. Market Segmentation by End-user

9.1 Market segments

Chart on End-user - Market share 2025-2030 (%)
Data Table on End-user - Market share 2025-2030 (%)

9.2 Comparison by End-user

Chart on Comparison by End-user
Data Table on Comparison by End-user

9.3 Commercial - Market size and forecast 2025-2030

Chart on Commercial - Market size and forecast 2025-2030 ($ million)
Data Table on Commercial - Market size and forecast 2025-2030 ($ million)
Chart on Commercial - Year-over-year growth 2025-2030 (%)
Data Table on Commercial - Year-over-year growth 2025-2030 (%)

9.4 Industrial - Market size and forecast 2025-2030

Chart on Industrial - Market size and forecast 2025-2030 ($ million)
Data Table on Industrial - Market size and forecast 2025-2030 ($ million)
Chart on Industrial - Year-over-year growth 2025-2030 (%)
Data Table on Industrial - Year-over-year growth 2025-2030 (%)

9.5 Residential - Market size and forecast 2025-2030

Chart on Residential - Market size and forecast 2025-2030 ($ million)
Data Table on Residential - Market size and forecast 2025-2030 ($ million)
Chart on Residential - Year-over-year growth 2025-2030 (%)
Data Table on Residential - Year-over-year growth 2025-2030 (%)

9.6 Utilities - Market size and forecast 2025-2030

Chart on Utilities - Market size and forecast 2025-2030 ($ million)
Data Table on Utilities - Market size and forecast 2025-2030 ($ million)
Chart on Utilities - Year-over-year growth 2025-2030 (%)
Data Table on Utilities - Year-over-year growth 2025-2030 (%)

9.7 Market opportunity by End-user

Market opportunity by End-user ($ million)
Data Table on Market opportunity by End-user ($ million)

10. Market Segmentation by Type

10.1 Market segments

Chart on Type - Market share 2025-2030 (%)
Data Table on Type - Market share 2025-2030 (%)

10.2 Comparison by Type

Chart on Comparison by Type
Data Table on Comparison by Type

10.3 MCB - Market size and forecast 2025-2030

Chart on MCB - Market size and forecast 2025-2030 ($ million)
Data Table on MCB - Market size and forecast 2025-2030 ($ million)
Chart on MCB - Year-over-year growth 2025-2030 (%)
Data Table on MCB - Year-over-year growth 2025-2030 (%)

10.4 MCCB - Market size and forecast 2025-2030

Chart on MCCB - Market size and forecast 2025-2030 ($ million)
Data Table on MCCB - Market size and forecast 2025-2030 ($ million)
Chart on MCCB - Year-over-year growth 2025-2030 (%)
Data Table on MCCB - Year-over-year growth 2025-2030 (%)

10.5 ACB - Market size and forecast 2025-2030

Chart on ACB - Market size and forecast 2025-2030 ($ million)
Data Table on ACB - Market size and forecast 2025-2030 ($ million)
Chart on ACB - Year-over-year growth 2025-2030 (%)
Data Table on ACB - Year-over-year growth 2025-2030 (%)

10.6 VCB - Market size and forecast 2025-2030

Chart on VCB - Market size and forecast 2025-2030 ($ million)
Data Table on VCB - Market size and forecast 2025-2030 ($ million)
Chart on VCB - Year-over-year growth 2025-2030 (%)
Data Table on VCB - Year-over-year growth 2025-2030 (%)

10.7 GIB - Market size and forecast 2025-2030

Chart on GIB - Market size and forecast 2025-2030 ($ million)
Data Table on GIB - Market size and forecast 2025-2030 ($ million)
Chart on GIB - Year-over-year growth 2025-2030 (%)
Data Table on GIB - Year-over-year growth 2025-2030 (%)

10.8 Market opportunity by Type

Market opportunity by Type ($ million)
Data Table on Market opportunity by Type ($ million)

11. Customer Landscape

11.1 Customer landscape overview

Analysis of price sensitivity, lifecycle, customer purchase basket, adoption rates, and purchase criteria

12. Geographic Landscape

12.1 Geographic segmentation

Chart on Market share by geography 2025-2030 (%)
Data Table on Market share by geography 2025-2030 (%)

12.2 Geographic comparison

Chart on Geographic comparison
Data Table on Geographic comparison

12.3 APAC - Market size and forecast 2025-2030

Chart on APAC - Market size and forecast 2025-2030 ($ million)
Data Table on APAC - Market size and forecast 2025-2030 ($ million)
Chart on APAC - Year-over-year growth 2025-2030 (%)
Data Table on APAC - Year-over-year growth 2025-2030 (%)
Chart on Regional Comparison - APAC
Data Table on Regional Comparison - APAC

12.3.1 Japan - Market size and forecast 2025-2030

Chart on Japan - Market size and forecast 2025-2030 ($ million)
Data Table on Japan - Market size and forecast 2025-2030 ($ million)
Chart on Japan - Year-over-year growth 2025-2030 (%)
Data Table on Japan - Year-over-year growth 2025-2030 (%)

12.3.2 China - Market size and forecast 2025-2030

Chart on China - Market size and forecast 2025-2030 ($ million)
Data Table on China - Market size and forecast 2025-2030 ($ million)
Chart on China - Year-over-year growth 2025-2030 (%)
Data Table on China - Year-over-year growth 2025-2030 (%)

12.3.3 India - Market size and forecast 2025-2030

Chart on India - Market size and forecast 2025-2030 ($ million)
Data Table on India - Market size and forecast 2025-2030 ($ million)
Chart on India - Year-over-year growth 2025-2030 (%)
Data Table on India - Year-over-year growth 2025-2030 (%)

12.3.4 South Korea - Market size and forecast 2025-2030

Chart on South Korea - Market size and forecast 2025-2030 ($ million)
Data Table on South Korea - Market size and forecast 2025-2030 ($ million)
Chart on South Korea - Year-over-year growth 2025-2030 (%)
Data Table on South Korea - Year-over-year growth 2025-2030 (%)

12.3.5 Australia - Market size and forecast 2025-2030

Chart on Australia - Market size and forecast 2025-2030 ($ million)
Data Table on Australia - Market size and forecast 2025-2030 ($ million)
Chart on Australia - Year-over-year growth 2025-2030 (%)
Data Table on Australia - Year-over-year growth 2025-2030 (%)

12.3.6 Indonesia - Market size and forecast 2025-2030

Chart on Indonesia - Market size and forecast 2025-2030 ($ million)
Data Table on Indonesia - Market size and forecast 2025-2030 ($ million)
Chart on Indonesia - Year-over-year growth 2025-2030 (%)
Data Table on Indonesia - Year-over-year growth 2025-2030 (%)

12.4 North America - Market size and forecast 2025-2030

Chart on North America - Market size and forecast 2025-2030 ($ million)
Data Table on North America - Market size and forecast 2025-2030 ($ million)
Chart on North America - Year-over-year growth 2025-2030 (%)
Data Table on North America - Year-over-year growth 2025-2030 (%)
Chart on Regional Comparison - North America
Data Table on Regional Comparison - North America

12.4.1 US - Market size and forecast 2025-2030

Chart on US - Market size and forecast 2025-2030 ($ million)
Data Table on US - Market size and forecast 2025-2030 ($ million)
Chart on US - Year-over-year growth 2025-2030 (%)
Data Table on US - Year-over-year growth 2025-2030 (%)

12.4.2 Canada - Market size and forecast 2025-2030

Chart on Canada - Market size and forecast 2025-2030 ($ million)
Data Table on Canada - Market size and forecast 2025-2030 ($ million)
Chart on Canada - Year-over-year growth 2025-2030 (%)
Data Table on Canada - Year-over-year growth 2025-2030 (%)

12.4.3 Mexico - Market size and forecast 2025-2030

Chart on Mexico - Market size and forecast 2025-2030 ($ million)
Data Table on Mexico - Market size and forecast 2025-2030 ($ million)
Chart on Mexico - Year-over-year growth 2025-2030 (%)
Data Table on Mexico - Year-over-year growth 2025-2030 (%)

12.5 Europe - Market size and forecast 2025-2030

Chart on Europe - Market size and forecast 2025-2030 ($ million)
Data Table on Europe - Market size and forecast 2025-2030 ($ million)
Chart on Europe - Year-over-year growth 2025-2030 (%)
Data Table on Europe - Year-over-year growth 2025-2030 (%)
Chart on Regional Comparison - Europe
Data Table on Regional Comparison - Europe

12.5.1 UK - Market size and forecast 2025-2030

Chart on UK - Market size and forecast 2025-2030 ($ million)
Data Table on UK - Market size and forecast 2025-2030 ($ million)
Chart on UK - Year-over-year growth 2025-2030 (%)
Data Table on UK - Year-over-year growth 2025-2030 (%)

12.5.2 Germany - Market size and forecast 2025-2030

Chart on Germany - Market size and forecast 2025-2030 ($ million)
Data Table on Germany - Market size and forecast 2025-2030 ($ million)
Chart on Germany - Year-over-year growth 2025-2030 (%)
Data Table on Germany - Year-over-year growth 2025-2030 (%)

12.5.3 France - Market size and forecast 2025-2030

Chart on France - Market size and forecast 2025-2030 ($ million)
Data Table on France - Market size and forecast 2025-2030 ($ million)
Chart on France - Year-over-year growth 2025-2030 (%)
Data Table on France - Year-over-year growth 2025-2030 (%)

12.5.4 Italy - Market size and forecast 2025-2030

Chart on Italy - Market size and forecast 2025-2030 ($ million)
Data Table on Italy - Market size and forecast 2025-2030 ($ million)
Chart on Italy - Year-over-year growth 2025-2030 (%)
Data Table on Italy - Year-over-year growth 2025-2030 (%)

12.5.5 Spain - Market size and forecast 2025-2030

Chart on Spain - Market size and forecast 2025-2030 ($ million)
Data Table on Spain - Market size and forecast 2025-2030 ($ million)
Chart on Spain - Year-over-year growth 2025-2030 (%)
Data Table on Spain - Year-over-year growth 2025-2030 (%)

12.5.6 The Netherlands - Market size and forecast 2025-2030

Chart on The Netherlands - Market size and forecast 2025-2030 ($ million)
Data Table on The Netherlands - Market size and forecast 2025-2030 ($ million)
Chart on The Netherlands - Year-over-year growth 2025-2030 (%)
Data Table on The Netherlands - Year-over-year growth 2025-2030 (%)

12.6 Middle East and Africa - Market size and forecast 2025-2030

Chart on Middle East and Africa - Market size and forecast 2025-2030 ($ million)
Data Table on Middle East and Africa - Market size and forecast 2025-2030 ($ million)
Chart on Middle East and Africa - Year-over-year growth 2025-2030 (%)
Data Table on Middle East and Africa - Year-over-year growth 2025-2030 (%)
Chart on Regional Comparison - Middle East and Africa
Data Table on Regional Comparison - Middle East and Africa

12.6.1 Saudi Arabia - Market size and forecast 2025-2030

Chart on Saudi Arabia - Market size and forecast 2025-2030 ($ million)
Data Table on Saudi Arabia - Market size and forecast 2025-2030 ($ million)
Chart on Saudi Arabia - Year-over-year growth 2025-2030 (%)
Data Table on Saudi Arabia - Year-over-year growth 2025-2030 (%)

12.6.2 UAE - Market size and forecast 2025-2030

Chart on UAE - Market size and forecast 2025-2030 ($ million)
Data Table on UAE - Market size and forecast 2025-2030 ($ million)
Chart on UAE - Year-over-year growth 2025-2030 (%)
Data Table on UAE - Year-over-year growth 2025-2030 (%)

12.6.3 South Africa - Market size and forecast 2025-2030

Chart on South Africa - Market size and forecast 2025-2030 ($ million)
Data Table on South Africa - Market size and forecast 2025-2030 ($ million)
Chart on South Africa - Year-over-year growth 2025-2030 (%)
Data Table on South Africa - Year-over-year growth 2025-2030 (%)

12.6.4 Egypt - Market size and forecast 2025-2030

Chart on Egypt - Market size and forecast 2025-2030 ($ million)
Data Table on Egypt - Market size and forecast 2025-2030 ($ million)
Chart on Egypt - Year-over-year growth 2025-2030 (%)
Data Table on Egypt - Year-over-year growth 2025-2030 (%)

12.6.5 Nigeria - Market size and forecast 2025-2030

Chart on Nigeria - Market size and forecast 2025-2030 ($ million)
Data Table on Nigeria - Market size and forecast 2025-2030 ($ million)
Chart on Nigeria - Year-over-year growth 2025-2030 (%)
Data Table on Nigeria - Year-over-year growth 2025-2030 (%)

12.7 South America - Market size and forecast 2025-2030

Chart on South America - Market size and forecast 2025-2030 ($ million)
Data Table on South America - Market size and forecast 2025-2030 ($ million)
Chart on South America - Year-over-year growth 2025-2030 (%)
Data Table on South America - Year-over-year growth 2025-2030 (%)
Chart on Regional Comparison - South America
Data Table on Regional Comparison - South America

12.7.1 Brazil - Market size and forecast 2025-2030

Chart on Brazil - Market size and forecast 2025-2030 ($ million)
Data Table on Brazil - Market size and forecast 2025-2030 ($ million)
Chart on Brazil - Year-over-year growth 2025-2030 (%)
Data Table on Brazil - Year-over-year growth 2025-2030 (%)

12.7.2 Argentina - Market size and forecast 2025-2030

Chart on Argentina - Market size and forecast 2025-2030 ($ million)
Data Table on Argentina - Market size and forecast 2025-2030 ($ million)
Chart on Argentina - Year-over-year growth 2025-2030 (%)
Data Table on Argentina - Year-over-year growth 2025-2030 (%)

12.7.3 Chile - Market size and forecast 2025-2030

Chart on Chile - Market size and forecast 2025-2030 ($ million)
Data Table on Chile - Market size and forecast 2025-2030 ($ million)
Chart on Chile - Year-over-year growth 2025-2030 (%)
Data Table on Chile - Year-over-year growth 2025-2030 (%)

12.8 Market opportunity by geography

Market opportunity by geography ($ million)
Data Tables on Market opportunity by geography ($ million)

13. Drivers, Challenges, and Opportunity

13.1 Market drivers

Expansion of hyperscale data centers boosts low-voltage protection demand
Grid modernization investments drive circuit breaker deployment
Renewable energy expansion increases fault protection demand

13.2 Market challenges

Rising raw material costs impact switchgear manufacturing margins
Stringent environmental regulations on SF6 insulation systems
Interoperability challenges in intelligent digital protection systems

13.3 Impact of drivers and challenges

Impact of drivers and challenges in 2025 and 2030

13.4 Market opportunities

Smart IoT-enabled circuit breaker adoption for predictive maintenance
Commercial emergence of SSC breakers for faster fault isolation
Growing adoption of eco-friendly vacuum insulation technologies

14. Competitive Landscape

14.1 Overview

14.2

Overview on criticality of inputs and factors of differentiation

14.3 Landscape disruption

Overview on factors of disruption

14.4 Industry risks

Impact of key risks on business

15. Competitive Analysis

15.1 Companies profiled

Companies covered

15.2 Company ranking index

15.3 Market positioning of companies

Matrix on companies position and classification

15.4 ABB Ltd.

ABB Ltd. - Overview
ABB Ltd. - Business segments
ABB Ltd. - Key news
ABB Ltd. - Key offerings
ABB Ltd. - Segment focus
SWOT

15.5 CG Power and Industrial Ltd.

CG Power and Industrial Ltd. - Overview
CG Power and Industrial Ltd. - Business segments
CG Power and Industrial Ltd. - Key offerings
CG Power and Industrial Ltd. - Segment focus
SWOT

15.6 Eaton Corp. Plc

Eaton Corp. Plc - Overview
Eaton Corp. Plc - Business segments
Eaton Corp. Plc - Key news
Eaton Corp. Plc - Key offerings
Eaton Corp. Plc - Segment focus
SWOT

15.7 Fuji Electric Co. Ltd.

Fuji Electric Co. Ltd. - Overview
Fuji Electric Co. Ltd. - Business segments
Fuji Electric Co. Ltd. - Key offerings
Fuji Electric Co. Ltd. - Segment focus
SWOT

15.8 Havells India Ltd.

Havells India Ltd. - Overview
Havells India Ltd. - Business segments
Havells India Ltd. - Key offerings
Havells India Ltd. - Segment focus
SWOT

15.9 Larsen and Toubro Ltd.

Larsen and Toubro Ltd. - Overview
Larsen and Toubro Ltd. - Business segments
Larsen and Toubro Ltd. - Key offerings
Larsen and Toubro Ltd. - Segment focus
SWOT

15.10 Legrand SA

Legrand SA - Overview
Legrand SA - Business segments
Legrand SA - Key news
Legrand SA - Key offerings
Legrand SA - Segment focus
SWOT

15.11 LS ELECTRIC Co. Ltd.

LS ELECTRIC Co. Ltd. - Overview
LS ELECTRIC Co. Ltd. - Business segments
LS ELECTRIC Co. Ltd. - Key offerings
LS ELECTRIC Co. Ltd. - Segment focus
SWOT

15.12 Mitsubishi Electric Corp.

Mitsubishi Electric Corp. - Overview
Mitsubishi Electric Corp. - Business segments
Mitsubishi Electric Corp. - Key offerings
Mitsubishi Electric Corp. - Segment focus
SWOT

15.13 Rockwell Automation Inc.

Rockwell Automation Inc. - Overview
Rockwell Automation Inc. - Business segments
Rockwell Automation Inc. - Key news
Rockwell Automation Inc. - Key offerings
Rockwell Automation Inc. - Segment focus
SWOT

15.14 Schneider Electric SE

Schneider Electric SE - Overview
Schneider Electric SE - Business segments
Schneider Electric SE - Key news
Schneider Electric SE - Key offerings
Schneider Electric SE - Segment focus
SWOT

15.15 Siemens AG

Siemens AG - Overview
Siemens AG - Business segments
Siemens AG - Key news
Siemens AG - Key offerings
Siemens AG - Segment focus
SWOT

15.16 Terasaki Electric Co. Ltd.

Terasaki Electric Co. Ltd. - Overview
Terasaki Electric Co. Ltd. - Business segments
Terasaki Electric Co. Ltd. - Key offerings
Terasaki Electric Co. Ltd. - Segment focus
SWOT

15.17 Toshiba Corp.

Toshiba Corp. - Overview
Toshiba Corp. - Product / Service
Toshiba Corp. - Key offerings
SWOT

15.18 WEG S.A

WEG S.A - Overview
WEG S.A - Business segments
WEG S.A - Key offerings
WEG S.A - Segment focus
SWOT

16. Appendix

16.1 Scope of the report

Market definition
Objectives
Notes and caveats

16.2 Inclusions and exclusions checklist

Inclusions checklist
Exclusions checklist

16.3 Currency conversion rates for US$

16.4 Research methodology

16.5 Data procurement

Information sources

16.6 Data validation

16.7 Validation techniques employed for market sizing

16.8 Data synthesis

16.9 360 degree market analysis

16.10 List of abbreviations

Research Methodology

Technavio presents a detailed picture of the market by way of study, synthesis, and summation of data from multiple sources. The analysts have presented the various facets of the market with a particular focus on identifying the key industry influencers. The data thus presented is comprehensive, reliable, and the result of extensive research, both primary and secondary.

INFORMATION SOURCES

Primary sources

  • Manufacturers and suppliers
  • Channel partners
  • Industry experts
  • Strategic decision makers

Secondary sources

  • Industry journals and periodicals
  • Government data
  • Financial reports of key industry players
  • Historical data
  • Press releases

DATA ANALYSIS

Data Synthesis

  • Collation of data
  • Estimation of key figures
  • Analysis of derived insights

Data Validation

  • Triangulation with data models
  • Reference against proprietary databases
  • Corroboration with industry experts

REPORT WRITING

Qualitative

  • Market drivers
  • Market challenges
  • Market trends
  • Five forces analysis

Quantitative

  • Market size and forecast
  • Market segmentation
  • Geographical insights
  • Competitive landscape

Interested in this report?

Get your sample now to see our research methodology and insights!

Download Now

Frequently Asked Questions

Circuit Breaker market growth will increase by USD 5490.2 million during 2026-2030.

The Circuit Breaker market is expected to grow at a CAGR of 7.2% during 2026-2030.

Circuit Breaker market is segmented by Power rating (High, Medium, Low) End-user (Commercial, Industrial, Residential, Utilities) Type (MCB, MCCB, ACB, VCB, GIB)

ABB Ltd., CG Power and Industrial Ltd., Delixi Electric Ltd., Eaton Corp. Plc, Fuji Electric Co. Ltd., GE Vernova Inc., Havells India Ltd., Hitachi Energy India Ltd., Kirloskar Electric Co. Ltd., Larsen and Toubro Ltd., Legrand SA, LS ELECTRIC Co. Ltd., Mitsubishi Electric Corp., NOARK Electric, Rockwell Automation Inc., Schneider Electric SE, Siemens AG, Terasaki Electric Co. Ltd., Toshiba Corp., WEG S.A are a few of the key vendors in the Circuit Breaker market.

APAC will register the highest growth rate of 49.5% among the other regions. Therefore, the Circuit Breaker market in APAC is expected to garner significant business opportunities for the vendors during the forecast period.

Japan, China, India, South Korea, Australia, Indonesia, US, Canada, Mexico, UK, Germany, France, Italy, Spain, The Netherlands, Saudi Arabia, UAE, South Africa, Egypt, Nigeria, Brazil, Argentina, Chile

  • Expansion of hyperscale data centers boosts low-voltage protection demand is the driving factor this market.

The Circuit Breaker market vendors should focus on grabbing business opportunities from the Power rating segment as it accounted for the largest market share in the base year.
RIA - Research AI Assistant
Ask RIA
