Circular Economy Enablement Platforms Market Size and Growth Forecast 2026-2030
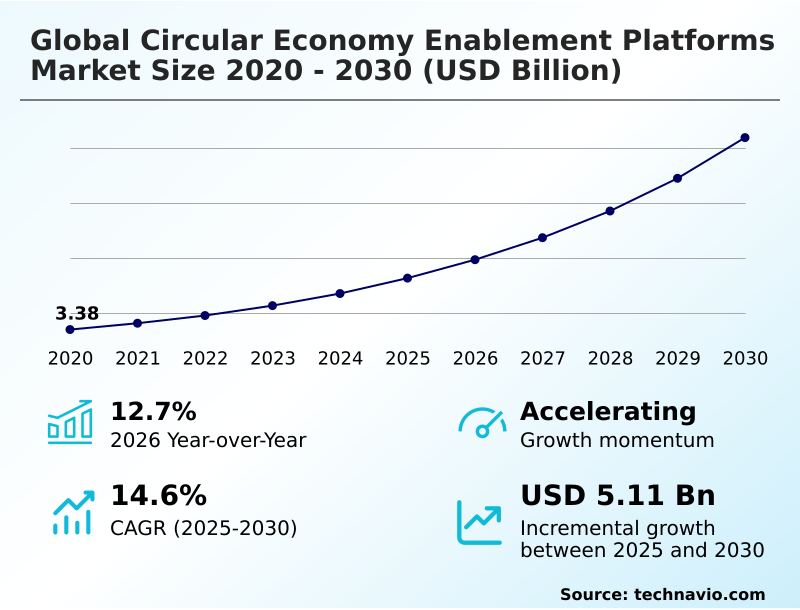
The Circular Economy Enablement Platforms Market size was valued at USD 5.25 billion in 2025 growing at a CAGR of 14.6% during the forecast period 2026-2030.
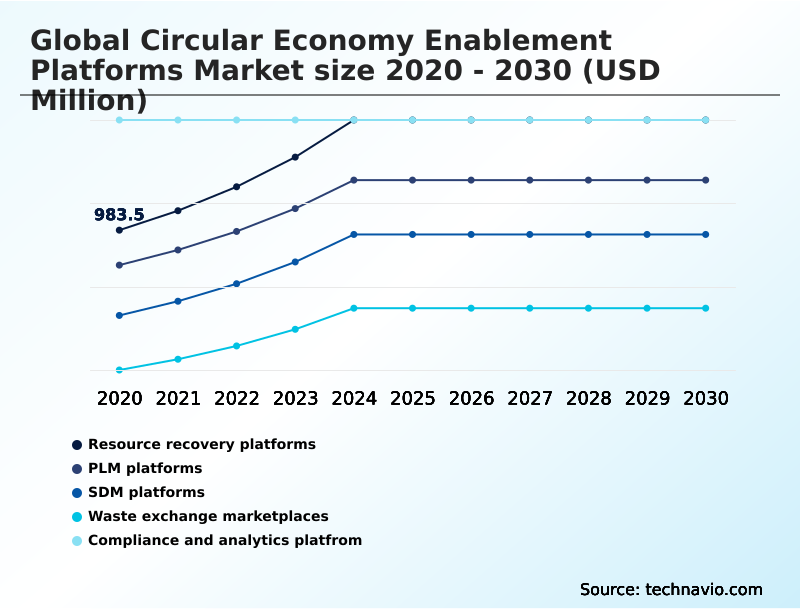
Europe accounts for 32.1% of incremental growth during the forecast period. The Resource recovery platforms segment by Platform was valued at USD 1.37 billion in 2024, while the Cloud segment holds the largest revenue share by Deployment.
The market is projected to grow by USD 6.98 billion from 2020 to 2030, with USD 5.11 billion of the growth expected during the forecast period of 2025 to 2030.
Get Key Insights on Market Forecast (PDF) Request Free Sample
Circular Economy Enablement Platforms Market Overview
The Circular Economy Enablement Platforms Market is defined by a systemic shift toward resource efficiency, with adoption accelerating due to stringent environmental policies and corporate ESG commitments. With a year-over-year growth of 12.7%, the market reflects a strong push for supply chain transparency and regulatory compliance automation. Platforms are evolving to incorporate predictive analytics for waste, enabling better industrial symbiosis and supporting product-as-a-service models. For instance, a large-scale consumer electronics refurbisher utilizes a platform with smart sensor integration to automate its e-waste tracking process. This system, which provides detailed material composition data, has allowed the facility to improve its material recovery rate by over 15%, ensuring compliance with WEEE Directive requirements while enhancing the value of its secondary material markets. This level of granular insight, facilitated by cloud-based data aggregation, is becoming a standard operational requirement across regions, with Europe accounting for 32% of incremental growth.
Drivers, Trends, and Challenges in the Circular Economy Enablement Platforms Market
The global Circular Economy Enablement Platforms Market is advancing beyond conceptual frameworks into operational necessities, driven by mandates like the EU's Digital Product Passport EU regulation. Enterprises are now seeking tangible ROI on circular economy software by implementing solutions for tracking e-waste with blockchain technology, ensuring both compliance and value recovery.
A key application is in reverse logistics platform for electronics, where platforms are used to manage the take-back, refurbishment, and resale of devices. For example, a specialized e-waste processing facility using an AI for secondary materials marketplace can increase the recovery yield of precious metals by up to 10% compared to manual sorting methods.
The digital product passport implementation strategy has become a central component of this shift, providing the data infrastructure for a functional circular economy. As a result, businesses are increasingly focused on their SaaS platform for ESG reporting, which integrates data from these operational platforms to provide auditable sustainability metrics for investors and regulators.
The success of these initiatives depends heavily on robust reverse logistics optimization software features and the effective use of blockchain for supply chain traceability.
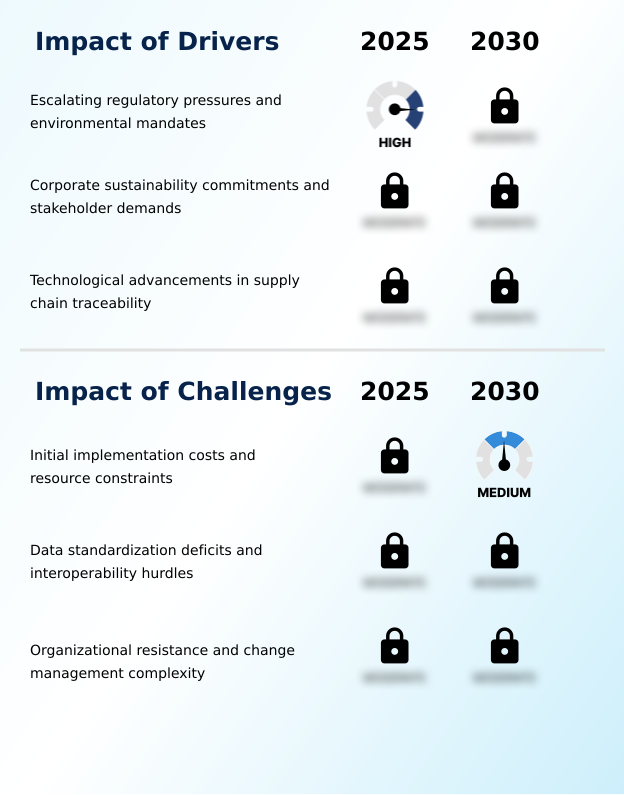
Primary Growth Driver: Escalating regulatory pressures and environmental mandates are a key driver for the adoption of circular economy enablement platforms.
Regulatory pressures and stakeholder demands for accountability are primary market drivers. Mandates for extended producer responsibility and frameworks like the EU Green Deal compel organizations to adopt platforms for regulatory compliance automation.
These systems provide the tools for detailed lifecycle assessment and accurate carbon footprint calculation, which are essential for avoiding accusations of greenwashing.
The strategic push toward a circular supply chain is also driven by the economic benefits of resource optimization and risk mitigation.
By implementing platforms that enable robust sustainability data management, companies can substantiate their ESG claims, improve their standing with investors, and unlock operational efficiencies, making sustainability a competitive advantage rather than a cost center.
Emerging Market Trend: A key market trend is the integration of digital product passports with blockchain verification. This combination provides immutable, transparent data on material composition, repairability, and lifecycle carbon footprint.
Key trends are moving platforms beyond simple tracking to becoming engines of value creation. The fusion of financial technology integration with logistics is enabling viable product-as-a-service models, where a platform manages billing, maintenance, and asset recovery. Concurrently, the use of AI-driven material matching is transforming waste exchange marketplaces from static listings into dynamic, efficient brokerage services.
The development of digital product passports, underpinned by blockchain verification, is becoming a standard for ensuring supply chain transparency. This creates trusted secondary material markets and allows for accurate circular business model valuation. These advancements are critical for sectors like electronics and fashion, where complex material compositions have historically hindered recycling and reuse efforts.
Key Industry Challenge: Initial implementation costs and resource constraints present a key challenge affecting the growth of the circular economy enablement platforms industry.
Significant challenges hinder widespread platform adoption, primarily centered on technical and organizational friction. The lack of data standardization across industries and regions creates major hurdles for platform interoperability, forcing costly custom integrations. While immutable data ledgers offer a solution for trust, getting all supply chain partners to adopt a unified standard remains difficult.
Furthermore, effective cloud-based data aggregation requires significant upfront investment in smart sensor integration and IT infrastructure, which can be prohibitive for smaller enterprises. These technical barriers are compounded by organizational resistance to change, as shifting from linear to circular models requires a fundamental overhaul of established processes and performance metrics.
Explore Full Market Dynamics Analysis Request Free Sample
Circular Economy Enablement Platforms Market Segmentation
The circular economy enablement platforms industry research report provides comprehensive data including region-wise segment analysis, with forecasts and analysis for the period 2026-2030, as well as historical data from 2020-2024 for the following segments.
Platform Segment Analysis
The resource recovery platforms segment is estimated to witness significant growth during the forecast period.
Resource recovery platforms are essential for extracting value from end-of-life products, enabling enterprises to close material loops. These systems facilitate the identification, sorting, and redistribution of materials, transforming waste streams into revenue.
Core functionalities include advanced asset recovery tracking and detailed material flow analysis to monitor waste across geographies. The architecture often incorporates product lifecycle management principles to optimize reverse logistics and meet regulatory standards like the EU's Waste Framework Directive.
This segment accounts for a significant portion of the market, with adoption driven by the need to turn waste liabilities into valuable assets for industrial symbiosis, representing nearly 30% of platform deployments in 2025.
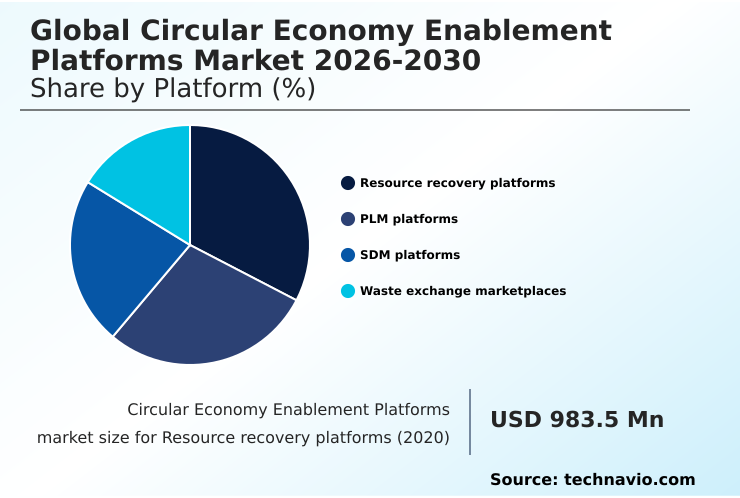
The Resource recovery platforms segment was valued at USD 1.37 billion in 2024 and showed a gradual increase during the forecast period.
Circular Economy Enablement Platforms Market by Region: Europe Leads with 32.1% Growth Share
Europe is estimated to contribute 32.1% to the growth of the global market during the forecast period.
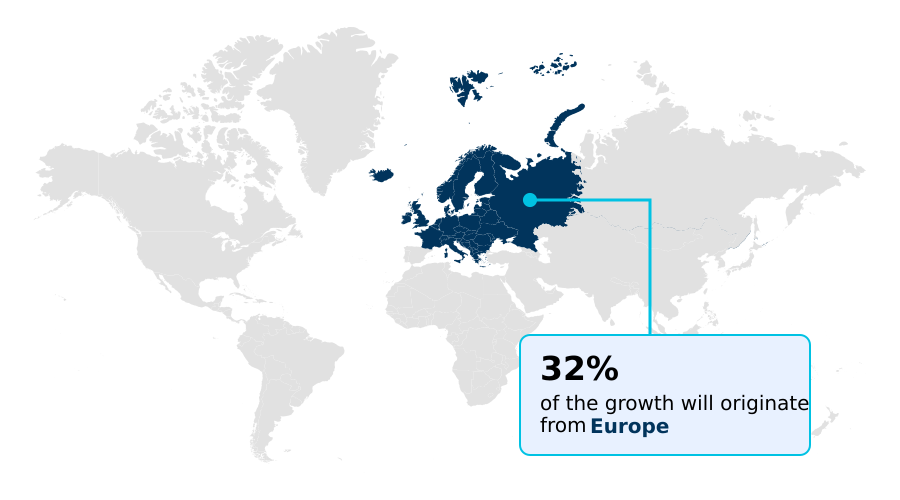
The geographic landscape is characterized by varied adoption drivers, with Europe leading due to a stringent regulatory environment that includes mandates like the Digital Product Passport.
The region contributes over 32% of the market's growth, with a strong focus on industrial symbiosis and platform interoperability.
North America follows, driven by corporate-led initiatives demanding enhanced supply chain transparency and solutions for e-waste tracking, accounting for over 30% of growth opportunity.
In APAC, representing nearly 26% of the opportunity, the push is toward integrating material traceability into large-scale manufacturing to manage industrial waste and build resilient closed-loop systems.
Across all regions, the goal is to leverage platforms for resource optimization, but the path to implementation is shaped by local economic priorities and regulatory maturity.
Customer Landscape Analysis for the Circular Economy Enablement Platforms Market
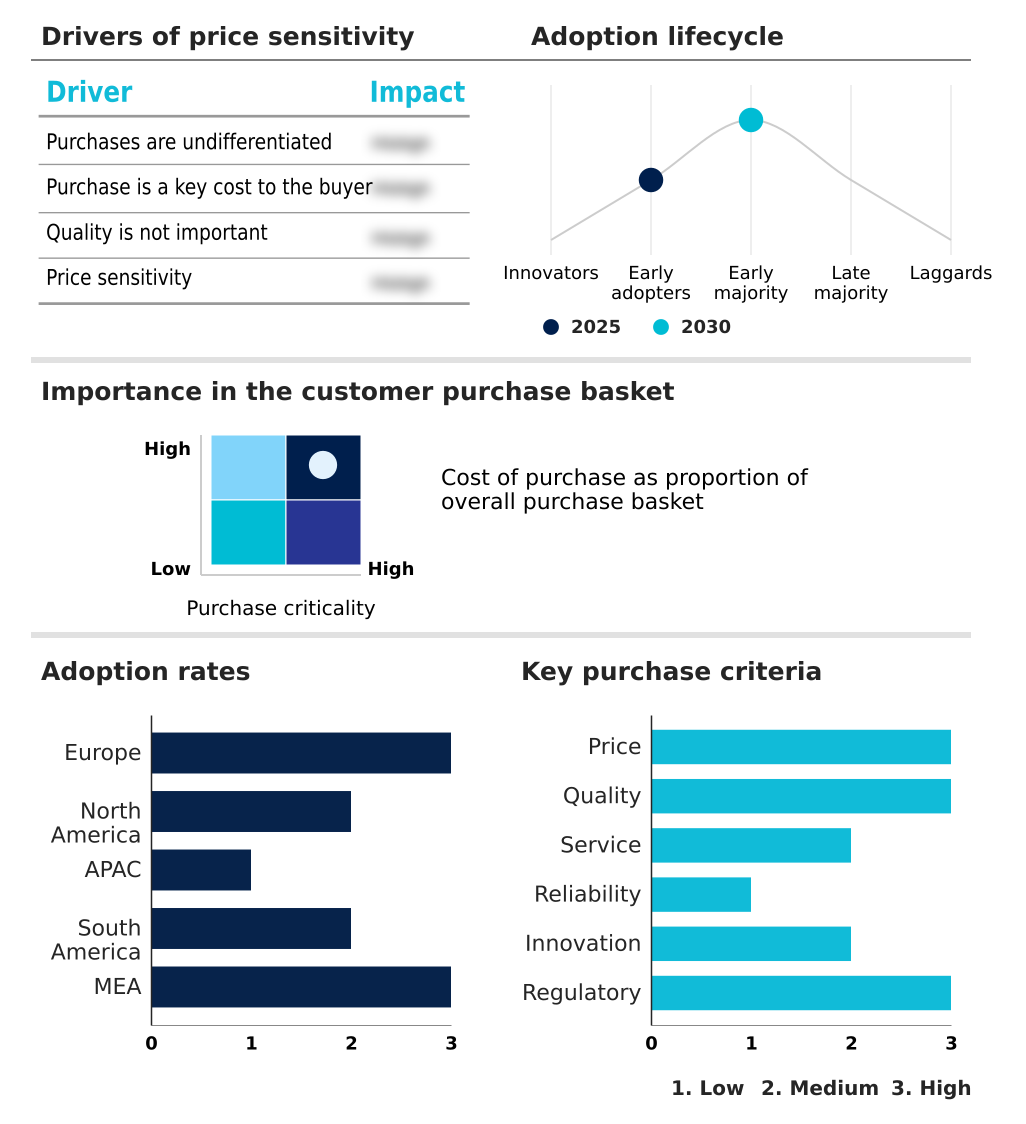
The circular economy enablement platforms market forecasting report includes the adoption lifecycle of the market, covering from the innovator’s stage to the laggard’s stage. It focuses on adoption rates in different regions based on penetration. Furthermore, the circular economy enablement platforms market report also includes key purchase criteria and drivers of price sensitivity to help companies evaluate and develop their market growth analysis strategies.
Competitive Landscape of the Circular Economy Enablement Platforms Market
Companies are implementing various strategies, such as strategic alliances, partnerships, mergers and acquisitions, geographical expansion, and product/service launches, to enhance their presence in the circular economy enablement platforms market industry.
BACK MARKET Inc. - Specializes in blockchain-based Digital Product Passports, enabling secure material data sharing across supply chains while protecting intellectual property.
The industry research and growth report includes detailed analyses of the competitive landscape of the market and information about key companies, including:
- BACK MARKET Inc.
- Circularise
- Circulor
- EON Group Holding Inc.
- Everledger Limited
- Excess Materials Exchange
- Grover Deutschland GmbH
- IBM Corp.
- iFixit
- Optel Group
- Oracle Corp.
- Rebuy recommerce GmbH
- Refurbed Marketplace GmbH
- Rheaply
- RTS Holding Inc.
- SAP SE
- TerraCycle Inc.
- ThredUp Inc.
- Trove Recommerce Inc.
- Winnow Solutions Ltd.
Qualitative and quantitative analysis of companies has been conducted to help clients understand the wider business environment as well as the strengths and weaknesses of key industry players. Data is qualitatively analyzed to categorize companies as pure play, category-focused, industry-focused, and diversified; it is quantitatively analyzed to categorize companies as dominant, leading, strong, tentative, and weak.
Recent Developments in the Circular Economy Enablement Platforms Market
- In October 2024, German startup aevoloop secured approximately USD 8.9 million in seed funding and public grants to advance chemically recyclable plastics engineered for true circularity, aiming to support closed-loop plastic systems.
- In November 2024, Splitstone Capital acquired Ecobats UK battery recycling division, a transaction that strengthens the infrastructure for circular material recovery within the United Kingdom's industrial market.
- In January 2025, Circulate Capital expanded its Southeast Asia portfolio with strategic investments in Indonesian recycling companies Pelita Mekar Semesta and Polindo Utama to enhance regional plastic waste processing infrastructure.
- In September 2024, Una Terra launched an approximately USD 50 million early-growth investment fund focused on circular economy technologies, including waste reduction, decarbonization, and resource-efficiency platforms.
Research Analyst Overview: Circular Economy Enablement Platforms Market
The market's trajectory is defined by the operationalization of sustainability, moving from reporting exercises to core business strategy. Boardroom decisions are increasingly shaped by the need for verifiable resource optimization, with platforms providing the necessary sustainability data management and lifecycle assessment tools.
The EU's Carbon Border Adjustment Mechanism (CBAM) is forcing companies to adopt sophisticated carbon footprint calculation methods, making platform adoption a matter of market access, not just corporate responsibility. We see this in practice where automotive manufacturers leverage product lifecycle management platforms that integrate design for disassembly principles, enabling efficient asset recovery tracking at end-of-life.
This ensures a predictable supply for secondary material markets. The integration of blockchain verification with digital product passports creates an immutable record for material traceability, which is critical for validating claims and preventing greenwashing.
This shift toward a circular supply chain is not uniform; while Europe leads in regulatory-driven adoption, North America shows strong growth in voluntary corporate initiatives focused on industrial symbiosis and building resilient, closed-loop systems.
Dive into Technavio’s robust research methodology, blending expert interviews, extensive data synthesis, and validated models for unparalleled Circular Economy Enablement Platforms Market insights. See full methodology.
| Market Scope | |
|---|---|
| Page number | 305 |
| Base year | 2025 |
| Historic period | 2020-2024 |
| Forecast period | 2026-2030 |
| Growth momentum & CAGR | Accelerate at a CAGR of 14.6% |
| Market growth 2026-2030 | USD 5107.8 million |
| Market structure | Fragmented |
| YoY growth 2025-2026(%) | 12.7% |
| Key countries | Germany, UK, France, Italy, The Netherlands, Spain, US, Canada, Mexico, China, India, Japan, Australia, South Korea, Indonesia, Brazil, Argentina, Colombia, Saudi Arabia, UAE, South Africa, Israel and Turkey |
| Competitive landscape | Leading Companies, Market Positioning of Companies, Competitive Strategies, and Industry Risks |
Circular Economy Enablement Platforms Market: Key Questions Answered in This Report
-
What is the expected growth of the Circular Economy Enablement Platforms Market between 2026 and 2030?
-
The Circular Economy Enablement Platforms Market is expected to grow by USD 5.11 billion during 2026-2030, registering a CAGR of 14.6%. Year-over-year growth in 2026 is estimated at 12.7%%. This acceleration is shaped by escalating regulatory pressures and environmental mandates, which is intensifying demand across multiple end-use verticals covered in the report.
-
-
What segmentation does the market report cover?
-
The report is segmented by Platform (Resource recovery platforms, PLM platforms, SDM platforms, Waste exchange marketplaces, and Compliance and analytics platfrom), Deployment (Cloud, On-premises, and Hybrid), Component (Software, and Services) and Geography (Europe, North America, APAC, South America, Middle East and Africa). Among these, the Resource recovery platforms segment is estimated to witness significant growth during the forecast period, driven by rising adoption across key application areas. Each segment includes detailed qualitative and quantitative analysis, along with historical data from 2020-2024 and forecasts through 2030 with year-over-year growth rates.
-
-
Which regions are analyzed in the report?
-
The report covers Europe, North America, APAC, South America and Middle East and Africa. Europe is estimated to contribute 32.1% to market growth during the forecast period. Country-level analysis includes Germany, UK, France, Italy, The Netherlands, Spain, US, Canada, Mexico, China, India, Japan, Australia, South Korea, Indonesia, Brazil, Argentina, Colombia, Saudi Arabia, UAE, South Africa, Israel and Turkey, with dedicated market size tables and year-over-year growth for each.
-
-
What are the key growth drivers and market challenges?
-
The primary driver is escalating regulatory pressures and environmental mandates, which is accelerating investment and industry demand. The main challenge is initial implementation costs and resource constraints, creating operational barriers for key market participants. The report quantifies the impact of each driver and challenge across 2026 and 2030 with comparative analysis.
-
-
Who are the major players in the Circular Economy Enablement Platforms Market?
-
Key vendors include BACK MARKET Inc., Circularise, Circulor, EON Group Holding Inc., Everledger Limited, Excess Materials Exchange, Grover Deutschland GmbH, IBM Corp., iFixit, Optel Group, Oracle Corp., Rebuy recommerce GmbH, Refurbed Marketplace GmbH, Rheaply, RTS Holding Inc., SAP SE, TerraCycle Inc., ThredUp Inc., Trove Recommerce Inc. and Winnow Solutions Ltd.. The report provides qualitative and quantitative analysis categorizing companies as dominant, leading, strong, tentative, and weak based on their market positioning. Company profiles include business segment analysis, SWOT assessment, key offerings, and recent strategic developments.
-
Circular Economy Enablement Platforms Market Research Insights
The market's momentum is heavily influenced by corporate sustainability goals and the demand for verifiable green credentials, pushing beyond simple compliance. The convergence of financial technology integration with reverse logistics is creating new circular business model valuation metrics.
As outlined in frameworks like the EU's Circular Economy Action Plan, the ability to provide auditable, end-of-life processing data is becoming a prerequisite for market access.
A tangible use case involves automotive component remanufacturers using platforms that combine digital twin simulation with material traceability to certify the performance of refurbished parts, often achieving over 90% of the efficiency of new units. This capability for greenwashing avoidance is critical as investors and consumers demand proof of regenerative economic models.
This dynamic is most pronounced in Europe, which is set to contribute over 32% of the market's incremental growth.
We can help! Our analysts can customize this circular economy enablement platforms market research report to meet your requirements.
 RIA -
RIA - 
