Cleanroom Apparels Market Analysis Asia, North America, Europe, Rest of World (ROW) - US, Germany, UK, China, Japan - Size and Forecast 2024-2028

Cleanroom Apparels Market Analysis Asia, North America, Europe, Rest of World (ROW) - US, Germany, UK, China, Japan - Size and Forecast 2024-2028

Published: Oct 2023 169 Pages SKU: IRTNTR46534

Market Overview at a Glance

$149.53 Mn
Market Opportunity
5.22%
CAGR
4.14
YoY growth 2023-2024(%)

Cleanroom Apparels Market Size 2024-2028

The cleanroom apparels market size is forecast to increase by USD 149.53 million, at a CAGR of 5.22% between 2023 and 2028.

  • The market is experiencing significant growth, driven by increasing investments in fabrication facilities, particularly in the semiconductor and pharmaceutical industries, and the adoption of eco-friendly disposables. The expansion of these facilities necessitates the use of high-quality cleanroom apparels to maintain stringent hygiene standards and ensure product integrity. Moreover, the shift towards eco-friendly disposables is gaining momentum due to growing environmental concerns and regulatory pressures. However, the market also faces challenges. The high cost of producing advanced cleanroom apparels and the need for frequent replacement pose significant financial burdens.
  • Additionally, the complex nature of cleanroom environments necessitates specialized knowledge and expertise to design and manufacture effective apparel solutions. Companies seeking to capitalize on market opportunities must focus on innovation and sustainability, while addressing these challenges through strategic partnerships, technological advancements, and cost optimization measures. The market's strategic landscape is dynamic, requiring agility and adaptability to stay competitive and meet evolving customer needs.

What will be the Size of the Cleanroom Apparels Market during the forecast period?

Cleanroom Apparels Market Size

Explore in-depth regional segment analysis with market size data - historical 2018-2022 and forecasts 2024-2028 - in the full report.  
Request Free Sample

The market continues to evolve, driven by the ever-increasing demand for advanced contamination control solutions across various industries. Particle filtration efficiency remains a key focus, with ongoing research and development in cleanroom garment materials and protective hood designs. Sterile apparel construction and electrostatic discharge protection are also crucial elements, ensuring the integrity of critical environments. Cleanroom apparel logistics and storage solutions have gained significance, as organizations seek to optimize their supply chains and minimize contamination risks. Comfort is another essential factor, with garment sizing and fabric breathability levels being carefully considered to enhance wearer satisfaction and productivity.

Microbiological barrier fabrics and laminar airflow protection are increasingly being adopted to address the challenges of contamination control. Cleanroom garment maintenance, testing, and inspection are integral parts of the overall solution, ensuring the continued effectiveness of protective apparel. The market dynamics of cleanroom apparels are continually unfolding, with new innovations in protective apparel fabrics, barrier technology apparel, and personal protective equipment. Fiber shedding reduction and antistatic properties are becoming essential features, as organizations strive to maintain the highest levels of cleanliness and safety in their operations. Cleanroom apparel standards continue to evolve, reflecting the latest research and best practices in contamination control.

As the market continues to grow and adapt, it will be essential for organizations to stay informed and responsive to the latest trends and developments.

How is this Cleanroom Apparels Industry segmented?

The cleanroom apparels industry research report provides comprehensive data (region-wise segment analysis), with forecasts and estimates in "USD million" for the period 2024-2028, as well as historical data from 2018-2022 for the following segments.

  • Type
    • Reusable
    • Disposable
  • End-user
    • Medical
    • Semiconductor
    • Others
  • Geography
    • North America
      • US
    • Europe
      • Germany
      • UK
    • APAC
      • China
      • Japan
    • Rest of World (ROW)

By Type Insights

The reusable segment is estimated to witness significant growth during the forecast period.

Reusable cleanroom apparel, including garments with high efficiency particulate filtration and chemical splash protection, is gaining popularity due to its cost-effectiveness and durability. Semiconductor and electronics industries are significant end-users, as the sterility and bioburden concerns are minimal in their manufacturing processes. In contrast, the medical research and manufacturing industries prioritize disposable garments due to stringent sterility requirements. The cost of purchasing and maintaining cleanroom apparel is a critical factor influencing the market's dynamics. Reusable apparel offers a solution by reducing overall operational and maintenance costs. Cleanroom shoe covers, garment materials, and protective hood designs ensure comfort and compliance with contamination control standards.

Sterile apparel construction, microbiological barrier fabrics, and electrostatic discharge protection further enhance the functionality of these garments. Cleanroom garment storage, logistics, and inspection are essential aspects ensuring the continuous availability of cleanroom apparel. Fabric breathability levels, laundering, and maintenance are crucial factors impacting the market trends. Barrier technology apparel, laminar airflow protection, and personal protective equipment with fiber shedding reduction are emerging trends. Cleanroom apparel standards, such as antistatic cleanroom suits, ensure consistent quality and performance.

Cleanroom Apparels Market Size

Request Free Sample

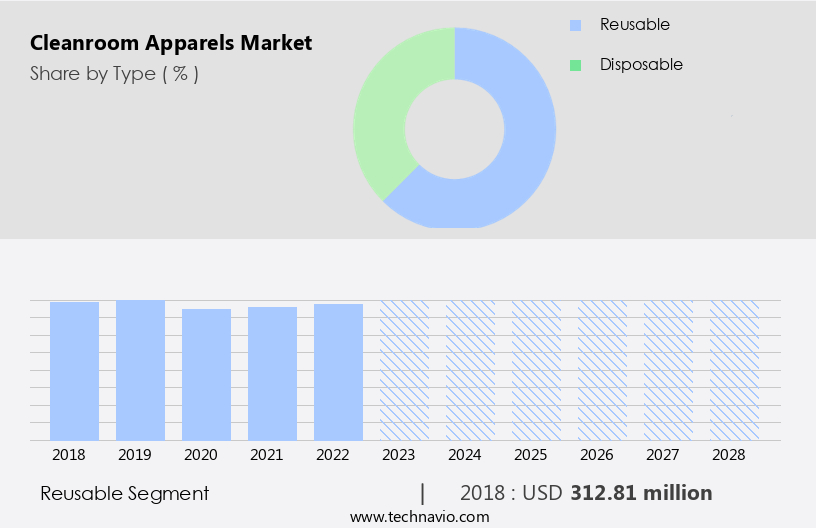
The Reusable segment was valued at USD 312.81 million in 2018 and showed a gradual increase during the forecast period.

Regional Analysis

Asia is estimated to contribute 56% to the growth of the global market during the forecast period. Technavio's analysts have elaborately explained the regional trends and drivers that shape the market during the forecast period.

Cleanroom Apparels Market Share by Geography

 Request Free Sample

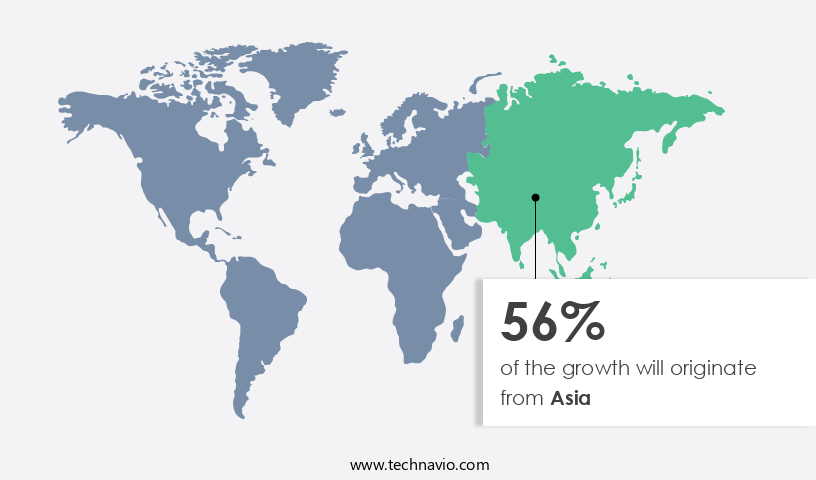
The cleanroom apparel market in Asia is experiencing significant growth due to the expansion of the end-user industries, particularly the medical and semiconductor sectors. Asia's dominance in semiconductor manufacturing, with major players located in Taiwan, China, Japan, and South Korea, significantly contributes to the market's growth. The region is also the fastest-growing market for electronic devices, driven by economic growth and technology adoption. Semiconductor manufacturing outsourcing from developed countries and the growing semiconductor assembly and testing services (SATS) market further fuel this trend. Cleanroom apparel plays a crucial role in maintaining high particle filtration efficiency, chemical splash protection, and garment sterility assurance in these industries.

The market demand is driven by the need for contamination control garments, cleanroom shoe covers, and protective hood designs. Cleanroom garment materials, such as microbiological barrier fabrics and antistatic cleanroom suits, are essential to prevent fiber shedding and electrostatic discharge. Cleanroom apparel logistics and storage, fabric breathability levels, and laundering are essential considerations for ensuring cleanroom garment durability and comfort. Laminar airflow protection and cleanroom garment testing are crucial to maintaining a sterile environment and ensuring compliance with cleanroom apparel standards. The market for barrier technology apparel and airborne particle barriers is also growing, as personal protective equipment (PPE) requirements become increasingly stringent.

In conclusion, the cleanroom apparel market in Asia is driven by the expansion of end-user industries, particularly semiconductor manufacturing, and the growing demand for electronic devices. The market's growth is underpinned by the need for high-performance cleanroom garments that offer particle filtration efficiency, chemical splash protection, sterility assurance, and durability. Cleanroom apparel design, sizing, and inspection are also essential considerations to ensure compliance with industry standards and maintain a contamination-free environment.

Market Dynamics

Our researchers analyzed the data with 2023 as the base year, along with the key drivers, trends, and challenges. A holistic analysis of drivers will help companies refine their marketing strategies to gain a competitive advantage.

The market encompasses a wide range of garments specifically designed to maintain cleanroom environments, ensuring the preservation of product quality and safety in various industries. These industries, such as pharmaceuticals, electronics, and semiconductors, focus on maintaining stringent cleanroom standards to prevent contamination. Cleanroom apparels include coveralls, hoods, boot covers, and gloves, all manufactured from materials that minimize particle generation and retention. Long-term advancements in fabric technology have led to the development of innovative solutions, including antimicrobial and flame-resistant fabrics, further expanding the market's applications. Moreover, cleanroom apparels are essential in areas with high-risk contamination, such as in the production of biopharmaceuticals and advanced electronics. Including these industries, the market is witnessing significant growth, driven by the increasing demand for stringent cleanroom regulations and the need for enhanced product protection. Furthermore, the integration of automation and robotics in manufacturing processes necessitates the use of cleanroom apparels to ensure the equipment remains free from contamination. This trend is particularly prominent in the semiconductor industry, where the production of microchips requires an ultra-clean environment. In conclusion, the market continues to evolve, offering innovative solutions to meet the unique demands of various industries. Long-term advancements in fabric technology and the increasing importance of maintaining stringent cleanroom standards will further drive market growth.

What are the key market drivers leading to the rise in the adoption of Cleanroom Apparels Industry?

  • The significant expansion of investment in fabrication facilities serves as the primary catalyst for market growth. 
  • The semiconductor industry's ongoing expansion and the increasing demand for advanced memory technologies, such as 3D NAND, have led to significant investments in next-generation fabrication facilities. Companies like Samsung Electronics, Western Digital, Micron Technology, Toshiba, SK Hynix, and Intel are enhancing their production capacity to stay competitive. This trend is driven by the rising need for 3D NAND, which presents opportunities for various supply chain members, including chipmakers, equipment manufacturers, and material suppliers. One such pioneer in this field is NEO Semiconductor, which unveiled its groundbreaking technology, 3D X-DRAMTM, in May 2023. This innovation aims to address the growing demand for high-performance, high-density memory solutions.
  • In the realm of cleanroom apparel, this development underscores the importance of contamination control garments in ensuring the integrity of advanced manufacturing processes. Disposable cleanroom garments, cleanroom shoe covers, and garment sterility assurance are crucial components of this process. The selection of appropriate cleanroom garment materials, such as polyester or polypropylene, is vital for both contamination control and garment durability. These materials offer excellent cleanroom performance, chemical splash protection, and are easy to clean and sterilize. In conclusion, the semiconductor industry's growth and the subsequent investments in advanced fabrication facilities highlight the significance of cleanroom apparel in maintaining a contamination-free environment.

What are the market trends shaping the Cleanroom Apparels Industry?

  • Eco-friendly disposables are gaining popularity as the new market trend. This shift towards sustainable options is a significant development in the disposables industry.
  • Cleanroom apparels play a crucial role in maintaining a particle-free environment in industries such as pharmaceuticals and chemicals. However, disposable cleanroom apparels, which are commonly used due to the risk of contamination from hazardous compounds, pose challenges in terms of sustainability. To address this issue, several companies are innovating eco-friendly alternatives. For instance, Valtek, a prominent player in the market, has initiated a recycling program to minimize environmental impact. Used disposable cleanroom apparels are collected in recycling boxes and subsequently recycled by the company.
  • Moreover, comfort and protection are essential considerations in cleanroom apparel design. Protective hoods and sterile apparel construction ensure particle filtration efficiency. Protective apparel fabrics offer electrostatic discharge protection, ensuring the cleanroom environment remains uncontaminated. Effective cleanroom apparel logistics and storage systems further ensure the integrity of the cleanroom environment. These advancements underscore the industry's commitment to continuous improvement and innovation.

What challenges does the Cleanroom Apparels Industry face during its growth?

  • The increasing implementation of automation technology in cleanrooms poses a significant challenge to the industry's growth trajectory. 
  • The global cleanroom apparel market is experiencing significant growth due to the increasing adoption of automation in various industries, including medicine, semiconductors, pharmaceuticals, and food and beverage. Automation has become a crucial requirement in these sectors to ensure precise, contamination-free, and error-free manufacturing processes. However, the use of automation poses a challenge for the cleanroom apparel market, as maintaining the integrity of cleanroom environments is essential to prevent contamination. Microbiological barrier fabrics, cleanroom garment maintenance, laminar airflow protection, and cleanroom glove materials are key considerations for the design and sizing of cleanroom apparel. Fabric breathability levels are also important to ensure the comfort and productivity of workers.
  • The need to maintain a sterile environment and minimize contaminants is a significant factor driving the growth of the cleanroom apparel market. Additionally, the cost and efficiency benefits of automation are also contributing to the market's expansion. Cleanroom garment testing is a critical process to ensure the effectiveness of the protective clothing in preventing contamination. Proper cleaning and maintenance of cleanroom garments are essential to maintain their functionality and extend their lifespan. The use of advanced materials and technologies in cleanroom apparel is also driving innovation in the market. Overall, the global cleanroom apparel market is poised for continued growth as industries increasingly prioritize contamination control and automation.

Exclusive Customer Landscape

The cleanroom apparels market forecasting report includes the adoption lifecycle of the market, covering from the innovator's stage to the laggard's stage. It focuses on adoption rates in different regions based on penetration. Furthermore, the cleanroom apparels market report also includes key purchase criteria and drivers of price sensitivity to help companies evaluate and develop their market growth analysis strategies.

Cleanroom Apparels Market Share by Geography

 Customer Landscape

Key Companies & Market Insights

Companies are implementing various strategies, such as strategic alliances, cleanroom apparels market forecast, partnerships, mergers and acquisitions, geographical expansion, and product/service launches, to enhance their presence in the industry.

3M Co. - This company specializes in providing advanced cleanroom apparel, including 3M's disposable chemical protective coveralls, available in model 4565 BLK XXL, ensuring worker safety and compliance with industry standards.

The industry research and growth report includes detailed analyses of the competitive landscape of the market and information about key companies, including:

  • 3M Co.
  • Alpha Pro Tech Ltd.
  • Ansell Ltd.
  • Aramark
  • Berkshire Corp.
  • CliniMed Holdings Ltd.
  • Cole Parmer Instrument Co. LLC
  • Contec Inc.
  • DuPont de Nemours Inc.
  • Dycem Ltd.
  • Foamtec International WCC
  • High Tech Conversions Inc.
  • Illinois Tool Works Inc.
  • Kimberly Clark Corp.
  • Micronclean Ltd.
  • Micronova Manufacturing Inc.
  • STERIS Plc.
  • Terra Universal Inc.
  • Thermo Fisher Scientific Inc.
  • Valutek Inc.

Qualitative and quantitative analysis of companies has been conducted to help clients understand the wider business environment as well as the strengths and weaknesses of key industry players. Data is qualitatively analyzed to categorize companies as pure play, category-focused, industry-focused, and diversified; it is quantitatively analyzed to categorize companies as dominant, leading, strong, tentative, and weak.

Recent Development and News in Cleanroom Apparels Market

  • In January 2024, DuPont, a leading global materials science company, announced the launch of its new Tyvek® 800J protective apparel, designed specifically for use in the cleanroom industry. This innovative product offers enhanced breathability and comfort, while maintaining the high level of particle protection required in cleanroom environments (DuPont Press Release, 2024).
  • In March 2024, 3M and Honeywell International, two major players in the cleanroom apparel market, entered into a strategic partnership to expand their joint offerings in this sector. The collaboration aims to leverage each company's strengths and expertise to deliver comprehensive solutions for cleanroom customers (3M Press Release, 2024).
  • In May 2024, Showa Denko K.K., a leading Japanese chemical company, completed the acquisition of a significant stake in the cleanroom apparel manufacturer, Mitsui Chemicals, Inc. This investment strengthens Showa Denko's position in the global cleanroom apparel market and enables the expansion of its product offerings (Showa Denko Press Release, 2024).
  • In April 2025, the European Union (EU) implemented new regulations for cleanroom apparel, requiring stricter particle filtration standards and increased transparency in product certifications. This policy change is expected to drive demand for advanced cleanroom apparel technologies and solutions (European Commission Press Release, 2025).

Research Analyst Overview

  • In the intricately regulated cleanroom environment, the selection and usage of appropriate cleanroom apparel are paramount. The market for cleanroom fabrics continues to evolve, with a focus on optimizing fabric drape properties and minimizing apparel contamination risk. Protective apparel closures and garment sterility methods ensure the integrity of cleanroom suits, while traceability and labeling maintain accountability. Contamination monitoring remains a critical aspect of cleanroom apparel usage, with rigorous testing for particle retention, material permeability, and garment breathability. Comfort and protective layers are also essential considerations, with ESD protective apparel and garment color choices catering to specific applications.
  • Regulations governing cleanroom apparel are stringent, necessitating regular fabric selection, seam inspection, and air permeability testing to ensure longevity and disposal in accordance with industry standards. Protective clothing fabrics undergo extensive testing to meet cleanroom requirements, ensuring the highest level of protection and suitability for various industries.

Dive into Technavio's robust research methodology, blending expert interviews, extensive data synthesis, and validated models for unparalleled Cleanroom Apparels Market insights. See full methodology.

Market Scope

Report Coverage

Details

Page number

169

Base year

2023

Historic period

2018-2022

Forecast period

2024-2028

Growth momentum & CAGR

Accelerate at a CAGR of 5.22%

Market growth 2024-2028

USD 149.53 million

Market structure

Fragmented

YoY growth 2023-2024(%)

4.14

Key countries

US, Germany, UK, China, and Japan

Competitive landscape

Leading Companies, Market Positioning of Companies, Competitive Strategies, and Industry Risks

Request Free Sample

What are the Key Data Covered in this Cleanroom Apparels Market Research and Growth Report?

  • CAGR of the Cleanroom Apparels industry during the forecast period
  • Detailed information on factors that will drive the growth and forecasting between 2024 and 2028
  • Precise estimation of the size of the market and its contribution of the industry in focus to the parent market
  • Accurate predictions about upcoming growth and trends and changes in consumer behaviour
  • Growth of the market across Asia, North America, Europe, and Rest of World (ROW)
  • Thorough analysis of the market's competitive landscape and detailed information about companies
  • Comprehensive analysis of factors that will challenge the cleanroom apparels market growth of industry companies

We can help! Our analysts can customize this cleanroom apparels market research report to meet your requirements.

Get in touch

1 Executive Summary

  • 1.1 Market overview
    • Exhibit 01: Executive Summary – Chart on Market Overview
    • Exhibit 02: Executive Summary – Data Table on Market Overview
    • Exhibit 03: Executive Summary – Chart on Global Market Characteristics
    • Exhibit 04: Executive Summary – Chart on Market by Geography
    • Exhibit 05: Executive Summary – Chart on Market Segmentation by Type
    • Exhibit 06: Executive Summary – Chart on Market Segmentation by End-user
    • Exhibit 07: Executive Summary – Chart on Incremental Growth
    • Exhibit 08: Executive Summary – Data Table on Incremental Growth
    • Exhibit 09: Executive Summary – Chart on Vendor Market Positioning

2 Market Landscape

  • 2.1 Market ecosystem
    • Exhibit 10: Parent market
    • Exhibit 11: Market Characteristics

3 Market Sizing

  • 3.1 Market definition
    • Exhibit 12: Offerings of vendors included in the market definition
  • 3.2 Market segment analysis
    • Exhibit 13: Market segments
  • 3.3 Market size 2023
    • 3.4 Market outlook: Forecast for 2023-2028
      • Exhibit 14: Chart on Global - Market size and forecast 2023-2028 ($ million)
      • Exhibit 15: Data Table on Global - Market size and forecast 2023-2028 ($ million)
      • Exhibit 16: Chart on Global Market: Year-over-year growth 2023-2028 (%)
      • Exhibit 17: Data Table on Global Market: Year-over-year growth 2023-2028 (%)

    4 Historic Market Size

    • 4.1 Global cleanroom apparels market 2018 - 2022
      • Exhibit 18: Historic Market Size – Data Table on global cleanroom apparels market 2018 - 2022 ($ million)
    • 4.2 Type Segment Analysis 2018 - 2022
      • Exhibit 19: Historic Market Size – Type Segment 2018 - 2022 ($ million)
    • 4.3 End-user Segment Analysis 2018 - 2022
      • Exhibit 20: Historic Market Size – End-user Segment 2018 - 2022 ($ million)
    • 4.4 Geography Segment Analysis 2018 - 2022
      • Exhibit 21: Historic Market Size – Geography Segment 2018 - 2022 ($ million)
    • 4.5 Country Segment Analysis 2018 - 2022
      • Exhibit 22: Historic Market Size – Country Segment 2018 - 2022 ($ million)

    5 Five Forces Analysis

    • 5.1 Five forces summary
      • Exhibit 23: Five forces analysis - Comparison between 2023 and 2028
    • 5.2 Bargaining power of buyers
      • Exhibit 24: Chart on Bargaining power of buyers – Impact of key factors 2023 and 2028
    • 5.3 Bargaining power of suppliers
      • Exhibit 25: Bargaining power of suppliers – Impact of key factors in 2023 and 2028
    • 5.4 Threat of new entrants
      • Exhibit 26: Threat of new entrants – Impact of key factors in 2023 and 2028
    • 5.5 Threat of substitutes
      • Exhibit 27: Threat of substitutes – Impact of key factors in 2023 and 2028
    • 5.6 Threat of rivalry
      • Exhibit 28: Threat of rivalry – Impact of key factors in 2023 and 2028
    • 5.7 Market condition
      • Exhibit 29: Chart on Market condition - Five forces 2023 and 2028

    6 Market Segmentation by Type

    • 6.1 Market segments
      • Exhibit 30: Chart on Type - Market share 2023-2028 (%)
      • Exhibit 31: Data Table on Type - Market share 2023-2028 (%)
    • 6.2 Comparison by Type
      • Exhibit 32: Chart on Comparison by Type
      • Exhibit 33: Data Table on Comparison by Type
    • 6.3 Reusable - Market size and forecast 2023-2028
      • Exhibit 34: Chart on Reusable - Market size and forecast 2023-2028 ($ million)
      • Exhibit 35: Data Table on Reusable - Market size and forecast 2023-2028 ($ million)
      • Exhibit 36: Chart on Reusable - Year-over-year growth 2023-2028 (%)
      • Exhibit 37: Data Table on Reusable - Year-over-year growth 2023-2028 (%)
    • 6.4 Disposable - Market size and forecast 2023-2028
      • Exhibit 38: Chart on Disposable - Market size and forecast 2023-2028 ($ million)
      • Exhibit 39: Data Table on Disposable - Market size and forecast 2023-2028 ($ million)
      • Exhibit 40: Chart on Disposable - Year-over-year growth 2023-2028 (%)
      • Exhibit 41: Data Table on Disposable - Year-over-year growth 2023-2028 (%)
    • 6.5 Market opportunity by Type
      • Exhibit 42: Market opportunity by Type ($ million)
      • Exhibit 43: Data Table on Market opportunity by Type ($ million)

    7 Market Segmentation by End-user

    • 7.1 Market segments
      • Exhibit 44: Chart on End-user - Market share 2023-2028 (%)
      • Exhibit 45: Data Table on End-user - Market share 2023-2028 (%)
    • 7.2 Comparison by End-user
      • Exhibit 46: Chart on Comparison by End-user
      • Exhibit 47: Data Table on Comparison by End-user
    • 7.3 Medical - Market size and forecast 2023-2028
      • Exhibit 48: Chart on Medical - Market size and forecast 2023-2028 ($ million)
      • Exhibit 49: Data Table on Medical - Market size and forecast 2023-2028 ($ million)
      • Exhibit 50: Chart on Medical - Year-over-year growth 2023-2028 (%)
      • Exhibit 51: Data Table on Medical - Year-over-year growth 2023-2028 (%)
    • 7.4 Semiconductor - Market size and forecast 2023-2028
      • Exhibit 52: Chart on Semiconductor - Market size and forecast 2023-2028 ($ million)
      • Exhibit 53: Data Table on Semiconductor - Market size and forecast 2023-2028 ($ million)
      • Exhibit 54: Chart on Semiconductor - Year-over-year growth 2023-2028 (%)
      • Exhibit 55: Data Table on Semiconductor - Year-over-year growth 2023-2028 (%)
    • 7.5 Others - Market size and forecast 2023-2028
      • Exhibit 56: Chart on Others - Market size and forecast 2023-2028 ($ million)
      • Exhibit 57: Data Table on Others - Market size and forecast 2023-2028 ($ million)
      • Exhibit 58: Chart on Others - Year-over-year growth 2023-2028 (%)
      • Exhibit 59: Data Table on Others - Year-over-year growth 2023-2028 (%)
    • 7.6 Market opportunity by End-user
      • Exhibit 60: Market opportunity by End-user ($ million)
      • Exhibit 61: Data Table on Market opportunity by End-user ($ million)

    8 Customer Landscape

    • 8.1 Customer landscape overview
      • Exhibit 62: Analysis of price sensitivity, lifecycle, customer purchase basket, adoption rates, and purchase criteria

    9 Geographic Landscape

    • 9.1 Geographic segmentation
      • Exhibit 63: Chart on Market share by geography 2023-2028 (%)
      • Exhibit 64: Data Table on Market share by geography 2023-2028 (%)
    • 9.2 Geographic comparison
      • Exhibit 65: Chart on Geographic comparison
      • Exhibit 66: Data Table on Geographic comparison
    • 9.3 Asia - Market size and forecast 2023-2028
      • Exhibit 67: Chart on Asia - Market size and forecast 2023-2028 ($ million)
      • Exhibit 68: Data Table on Asia - Market size and forecast 2023-2028 ($ million)
      • Exhibit 69: Chart on Asia - Year-over-year growth 2023-2028 (%)
      • Exhibit 70: Data Table on Asia - Year-over-year growth 2023-2028 (%)
    • 9.4 North America - Market size and forecast 2023-2028
      • Exhibit 71: Chart on North America - Market size and forecast 2023-2028 ($ million)
      • Exhibit 72: Data Table on North America - Market size and forecast 2023-2028 ($ million)
      • Exhibit 73: Chart on North America - Year-over-year growth 2023-2028 (%)
      • Exhibit 74: Data Table on North America - Year-over-year growth 2023-2028 (%)
    • 9.5 Europe - Market size and forecast 2023-2028
      • Exhibit 75: Chart on Europe - Market size and forecast 2023-2028 ($ million)
      • Exhibit 76: Data Table on Europe - Market size and forecast 2023-2028 ($ million)
      • Exhibit 77: Chart on Europe - Year-over-year growth 2023-2028 (%)
      • Exhibit 78: Data Table on Europe - Year-over-year growth 2023-2028 (%)
    • 9.6 Rest of World (ROW) - Market size and forecast 2023-2028
      • Exhibit 79: Chart on Rest of World (ROW) - Market size and forecast 2023-2028 ($ million)
      • Exhibit 80: Data Table on Rest of World (ROW) - Market size and forecast 2023-2028 ($ million)
      • Exhibit 81: Chart on Rest of World (ROW) - Year-over-year growth 2023-2028 (%)
      • Exhibit 82: Data Table on Rest of World (ROW) - Year-over-year growth 2023-2028 (%)
    • 9.7 US - Market size and forecast 2023-2028
      • Exhibit 83: Chart on US - Market size and forecast 2023-2028 ($ million)
      • Exhibit 84: Data Table on US - Market size and forecast 2023-2028 ($ million)
      • Exhibit 85: Chart on US - Year-over-year growth 2023-2028 (%)
      • Exhibit 86: Data Table on US - Year-over-year growth 2023-2028 (%)
    • 9.8 China - Market size and forecast 2023-2028
      • Exhibit 87: Chart on China - Market size and forecast 2023-2028 ($ million)
      • Exhibit 88: Data Table on China - Market size and forecast 2023-2028 ($ million)
      • Exhibit 89: Chart on China - Year-over-year growth 2023-2028 (%)
      • Exhibit 90: Data Table on China - Year-over-year growth 2023-2028 (%)
    • 9.9 Germany - Market size and forecast 2023-2028
      • Exhibit 91: Chart on Germany - Market size and forecast 2023-2028 ($ million)
      • Exhibit 92: Data Table on Germany - Market size and forecast 2023-2028 ($ million)
      • Exhibit 93: Chart on Germany - Year-over-year growth 2023-2028 (%)
      • Exhibit 94: Data Table on Germany - Year-over-year growth 2023-2028 (%)
    • 9.10 UK - Market size and forecast 2023-2028
      • Exhibit 95: Chart on UK - Market size and forecast 2023-2028 ($ million)
      • Exhibit 96: Data Table on UK - Market size and forecast 2023-2028 ($ million)
      • Exhibit 97: Chart on UK - Year-over-year growth 2023-2028 (%)
      • Exhibit 98: Data Table on UK - Year-over-year growth 2023-2028 (%)
    • 9.11 Japan - Market size and forecast 2023-2028
      • Exhibit 99: Chart on Japan - Market size and forecast 2023-2028 ($ million)
      • Exhibit 100: Data Table on Japan - Market size and forecast 2023-2028 ($ million)
      • Exhibit 101: Chart on Japan - Year-over-year growth 2023-2028 (%)
      • Exhibit 102: Data Table on Japan - Year-over-year growth 2023-2028 (%)
    • 9.12 Market opportunity by geography
      • Exhibit 103: Market opportunity by geography ($ million)
      • Exhibit 104: Data Tables on Market opportunity by geography ($ million)

    10 Drivers, Challenges, and Trends

    • 10.1 Market drivers
      • 10.2 Market challenges
        • 10.3 Impact of drivers and challenges
          • Exhibit 105: Impact of drivers and challenges in 2023 and 2028
        • 10.4 Market trends

          11 Vendor Landscape

          • 11.1 Overview
            • 11.2 Vendor landscape
              • Exhibit 106: Overview on Criticality of inputs and Factors of differentiation
            • 11.3 Landscape disruption
              • Exhibit 107: Overview on factors of disruption
            • 11.4 Industry risks
              • Exhibit 108: Impact of key risks on business

            12 Vendor Analysis

            • 12.1 Vendors covered
              • Exhibit 109: Vendors covered
            • 12.2 Market positioning of vendors
              • Exhibit 110: Matrix on vendor position and classification
            • 12.3 3M Co.
              • Exhibit 111: 3M Co. - Overview
              • Exhibit 112: 3M Co. - Business segments
              • Exhibit 113: 3M Co. - Key news
              • Exhibit 114: 3M Co. - Key offerings
              • Exhibit 115: 3M Co. - Segment focus
            • 12.4 Alpha Pro Tech Ltd.
              • Exhibit 116: Alpha Pro Tech Ltd. - Overview
              • Exhibit 117: Alpha Pro Tech Ltd. - Business segments
              • Exhibit 118: Alpha Pro Tech Ltd. - Key offerings
              • Exhibit 119: Alpha Pro Tech Ltd. - Segment focus
            • 12.5 Ansell Ltd.
              • Exhibit 120: Ansell Ltd. - Overview
              • Exhibit 121: Ansell Ltd. - Business segments
              • Exhibit 122: Ansell Ltd. - Key news
              • Exhibit 123: Ansell Ltd. - Key offerings
              • Exhibit 124: Ansell Ltd. - Segment focus
            • 12.6 Aramark
              • Exhibit 125: Aramark - Overview
              • Exhibit 126: Aramark - Business segments
              • Exhibit 127: Aramark - Key offerings
              • Exhibit 128: Aramark - Segment focus
            • 12.7 Berkshire Corp.
              • Exhibit 129: Berkshire Corp. - Overview
              • Exhibit 130: Berkshire Corp. - Product / Service
              • Exhibit 131: Berkshire Corp. - Key offerings
            • 12.8 CliniMed Holdings Ltd.
              • Exhibit 132: CliniMed Holdings Ltd. - Overview
              • Exhibit 133: CliniMed Holdings Ltd. - Product / Service
              • Exhibit 134: CliniMed Holdings Ltd. - Key offerings
            • 12.9 Cole Parmer Instrument Co. LLC
              • Exhibit 135: Cole Parmer Instrument Co. LLC - Overview
              • Exhibit 136: Cole Parmer Instrument Co. LLC - Product / Service
              • Exhibit 137: Cole Parmer Instrument Co. LLC - Key news
              • Exhibit 138: Cole Parmer Instrument Co. LLC - Key offerings
            • 12.10 Contec Inc.
              • Exhibit 139: Contec Inc. - Overview
              • Exhibit 140: Contec Inc. - Product / Service
              • Exhibit 141: Contec Inc. - Key offerings
            • 12.11 DuPont de Nemours Inc.
              • Exhibit 142: DuPont de Nemours Inc. - Overview
              • Exhibit 143: DuPont de Nemours Inc. - Business segments
              • Exhibit 144: DuPont de Nemours Inc. - Key news
              • Exhibit 145: DuPont de Nemours Inc. - Key offerings
              • Exhibit 146: DuPont de Nemours Inc. - Segment focus
            • 12.12 Dycem Ltd.
              • Exhibit 147: Dycem Ltd. - Overview
              • Exhibit 148: Dycem Ltd. - Product / Service
              • Exhibit 149: Dycem Ltd. - Key offerings
            • 12.13 Foamtec International WCC
              • Exhibit 150: Foamtec International WCC - Overview
              • Exhibit 151: Foamtec International WCC - Product / Service
              • Exhibit 152: Foamtec International WCC - Key offerings
            • 12.14 High Tech Conversions Inc.
              • Exhibit 153: High Tech Conversions Inc. - Overview
              • Exhibit 154: High Tech Conversions Inc. - Product / Service
              • Exhibit 155: High Tech Conversions Inc. - Key offerings
            • 12.15 Illinois Tool Works Inc.
              • Exhibit 156: Illinois Tool Works Inc. - Overview
              • Exhibit 157: Illinois Tool Works Inc. - Business segments
              • Exhibit 158: Illinois Tool Works Inc. - Key news
              • Exhibit 159: Illinois Tool Works Inc. - Key offerings
              • Exhibit 160: Illinois Tool Works Inc. - Segment focus
            • 12.16 Kimberly Clark Corp.
              • Exhibit 161: Kimberly Clark Corp. - Overview
              • Exhibit 162: Kimberly Clark Corp. - Business segments
              • Exhibit 163: Kimberly Clark Corp. - Key news
              • Exhibit 164: Kimberly Clark Corp. - Key offerings
              • Exhibit 165: Kimberly Clark Corp. - Segment focus
            • 12.17 Micronclean Ltd.
              • Exhibit 166: Micronclean Ltd. - Overview
              • Exhibit 167: Micronclean Ltd. - Product / Service
              • Exhibit 168: Micronclean Ltd. - Key offerings

            13 Appendix

            • 13.1 Scope of the report
              • 13.2 Inclusions and exclusions checklist
                • Exhibit 169: Inclusions checklist
                • Exhibit 170: Exclusions checklist
              • 13.3 Currency conversion rates for US$
                • Exhibit 171: Currency conversion rates for US$
              • 13.4 Research methodology
                • Exhibit 172: Research methodology
                • Exhibit 173: Validation techniques employed for market sizing
                • Exhibit 174: Information sources
              • 13.5 List of abbreviations
                • Exhibit 175: List of abbreviations

              Research Methodology

              Technavio presents a detailed picture of the market by way of study, synthesis, and summation of data from multiple sources. The analysts have presented the various facets of the market with a particular focus on identifying the key industry influencers. The data thus presented is comprehensive, reliable, and the result of extensive research, both primary and secondary.

              INFORMATION SOURCES

              Primary sources

              • Manufacturers and suppliers
              • Channel partners
              • Industry experts
              • Strategic decision makers

              Secondary sources

              • Industry journals and periodicals
              • Government data
              • Financial reports of key industry players
              • Historical data
              • Press releases

              DATA ANALYSIS

              Data Synthesis

              • Collation of data
              • Estimation of key figures
              • Analysis of derived insights

              Data Validation

              • Triangulation with data models
              • Reference against proprietary databases
              • Corroboration with industry experts

              REPORT WRITING

              Qualitative

              • Market drivers
              • Market challenges
              • Market trends
              • Five forces analysis

              Quantitative

              • Market size and forecast
              • Market segmentation
              • Geographical insights
              • Competitive landscape

              Interested in this report?

              Get your sample now to see our research methodology and insights!

              Download Now

              Frequently Asked Questions

              Cleanroom Apparels market growth will increase by $ 149.53 mn during 2024-2028 .

              The Cleanroom Apparels market is expected to grow at a CAGR of 5.22% during 2024-2028 .

              Cleanroom Apparels market is segmented by Type( Reusable, Disposable, Others) End-user( Medical, Semiconductor, Others)

              3M Co., Alpha Pro Tech Ltd., Ansell Ltd., Aramark, Berkshire Corp., CliniMed Holdings Ltd., Cole Parmer Instrument Co. LLC, Contec Inc., DuPont de Nemours Inc., Dycem Ltd., Foamtec International WCC, High Tech Conversions Inc., Illinois Tool Works Inc., Kimberly Clark Corp., Micronclean Ltd., Micronova Manufacturing Inc., STERIS Plc., Terra Universal Inc., Thermo Fisher Scientific Inc., Valutek Inc. are a few of the key vendors in the Cleanroom Apparels market.

              Asia will register the highest growth rate of 56% among the other regions. Therefore, the Cleanroom Apparels market in Asia is expected to garner significant business opportunities for the vendors during the forecast period.

              US, Germany, UK, China, Japan

              • Growing investment in fabrication facilitiesMemory manufacturers such as Samsung Electronics is the driving factor this market.
              • Western Digital is the driving factor this market.
              • Micron Technology is the driving factor this market.
              • Toshiba is the driving factor this market.
              • SK Hynix is the driving factor this market.
              • and Intel are investing in new fabrication facilities to increase their production capacity and maintain the competition in the market. The rising demand for 3D NAND has created an opportunity for supply chain members such as chip makers is the driving factor this market.
              • equipment manufacturers is the driving factor this market.
              • and material suppliers. This has been driving investments in 3D NAND fabrication facilities. Some of the examples related to investments in next-generation fabrication facilities have been provided below: NEO Semiconductor is the driving factor this market.
              • a pioneer in the development of cutting-edge technologies for 3D NAND flash and DRAM memory is the driving factor this market.
              • today announced the introduction of its revolutionary technology is the driving factor this market.
              • 3D X-DRAMTM is the driving factor this market.
              • in May 2023. This innovation is the first 3D NAND-like DRAM cell array in the world is the driving factor this market.
              • and it aims to eliminate the 2D DRAM markets capacity limitation. NAND flash CAPEX will increase 8% to $29.9 billion in 2023 is the driving factor this market.
              • according to international experts IC Insights. Since the industry switched to 3D NAND in 2017 is the driving factor this market.
              • flash CAPEX has increased significantly and now exceeds $20 billion annually. Flash memory CAPEX is anticipated to rise to $29.9 billion in 2022 as both big and little vendors continue to maintain somewhat aggressive spending levels. The nations first brand-new memory production fab in 20 years will be inaugurated in October 2023 by Micron Technology is the driving factor this market.
              • Inc. is the driving factor this market.
              • one of the largest semiconductor businesses in the world and the sole memory maker in the United States. Technavio expects that the growing investments by manufacturers in 3D NAND flash production facilities will increase the production of 3D NAND. Thus is the driving factor this market.
              • growing investment in fabrication facilities will increase the demand for cleanroom apparel in the semiconductor fabrication facilities. Thus is the driving factor this market.
              • the growing investment in fabrication facilities will drive the growth of the global cleanroom apparel market during the forecast period. is the driving factor this market.

              The Cleanroom Apparels market vendors should focus on grabbing business opportunities from the Reusable segment as it accounted for the largest market share in the base year.