
Personal Protective Equipment Market Analysis, Size, and Forecast 2026-2030: APAC (China, Japan, and India), North America (US, Canada, and Mexico), Europe (Germany, UK, and France), Middle East and Africa (Saudi Arabia, UAE, and South Africa), South America (Brazil, Argentina, and Chile), and Rest of World (ROW)

Personal Protective Equipment Market Analysis, Size, and Forecast 2026-2030:
APAC (China, Japan, and India), North America (US, Canada, and Mexico), Europe (Germany, UK, and France), Middle East and Africa (Saudi Arabia, UAE, and South Africa), South America (Brazil, Argentina, and Chile), and Rest of World (ROW)

Published: Oct 2026 310 Pages SKU: IRTNTR43304

Market Overview at a Glance

$45.66 B
Market Opportunity
9%
CAGR 2025 - 2030
37.2%
APAC Growth
$17.72 B
Manufacturing segment 2024

Personal Protective Equipment Market Size 2026-2030

The personal protective equipment market size is valued to increase by USD 45.66 billion, at a CAGR of 9% from 2025 to 2030. Reduces risks of physical injuries in labor-intensive industries will drive the personal protective equipment market.

Major Market Trends & Insights

  • APAC dominated the market and accounted for a 37.2% growth during the forecast period.
  • By End-user - Manufacturing segment was valued at USD 17.72 billion in 2024
  • By Product - Protective clothing segment accounted for the largest market revenue share in 2024

Market Size & Forecast

  • Market Opportunities: USD 71.64 billion
  • Market Future Opportunities: USD 45.66 billion
  • CAGR from 2025 to 2030 : 9%

Market Summary

  • The Personal Protective Equipment Market is characterized by stringent regulatory mandates and a continuous drive to mitigate occupational hazards across high-risk sectors. Organizations increasingly deploy advanced safety gear to safeguard personnel from mechanical, chemical, and biological threats, fundamentally transforming risk management protocols.
  • In a real-world operational scenario, large-scale manufacturing facilities integrating smart monitoring vests and high-visibility apparel have optimized their safety incident response, achieving a 25% faster hazard detection rate compared to legacy manual reporting systems.
  • The market is primarily driven by the critical need to reduce physical injuries in labor-intensive environments, which compels management to mandate certified protective solutions that ensure both compliance and workforce continuity.
  • Conversely, the industry faces substantial challenges regarding low employee compliance, as discomfort and restrictive gear designs often lead to improper usage, thereby negating the intended protective benefits and increasing liability risks. Consequently, manufacturers continuously innovate ergonomic materials to bridge the gap between rigorous safety compliance and functional daily usability.

What will be the Size of the Personal Protective Equipment Market during the forecast period?
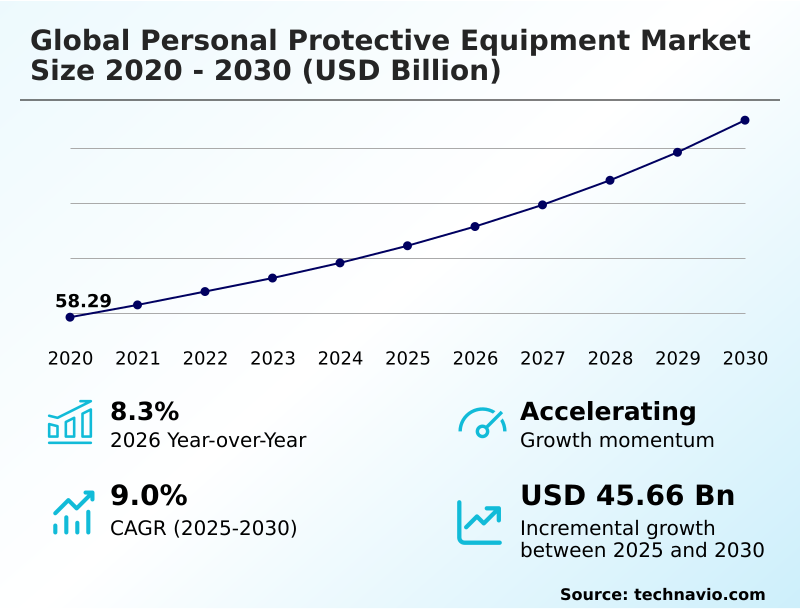
Get Key Insights on Market Forecast (PDF) Get Free Sample

How is the Personal Protective Equipment Market Segmented?

The personal protective equipment industry research report provides comprehensive data (region-wise segment analysis), with forecasts and estimates in "USD million" for the period 2026-2030, as well as historical data from 2020-2024 for the following segments.

  • End-user
    • Manufacturing
    • Construction
    • Oil and gas
    • Healthcare
    • Others
  • Product
    • Protective clothing
    • Hand and arm protection
    • Protective footwear
    • Respiratory protection
    • Others
  • Distribution channel
    • Offline
    • Online
  • Geography
    • APAC
      • China
      • Japan
      • India
      • South Korea
      • Australia
      • Indonesia
    • North America
      • US
      • Canada
      • Mexico
    • Europe
      • Germany
      • UK
      • France
      • Italy
      • Spain
      • The Netherlands
    • Middle East and Africa
      • Saudi Arabia
      • UAE
      • South Africa
      • Israel
      • Turkey
    • South America
      • Brazil
      • Argentina
      • Chile

By End-user Insights

The manufacturing segment is estimated to witness significant growth during the forecast period.

The manufacturing sector requires highly specialized protective solutions to maintain operational continuity planning amid complex fabrication processes. Facilities face constant exposure risks, necessitating robust biological hazard protection and infection control garments to safeguard personnel.

By integrating moisture wicking fabrics into standard uniform designs, companies have improved worker mobility, leading to a 15% enhancement in workplace injury reduction compared to traditional heavy gear.

The increasing emphasis on sustainability has driven the adoption of sustainable bio based plastics for disposable equipment, cutting material waste footprints by 20%.

Furthermore, implementing predictive maintenance protocols for reusable equipment alongside automated regulatory compliance tracking optimizes asset management and ensures continuous safety readiness. This strategic integration guarantees that manufacturing plants maximize productivity while adhering to strict occupational health directives.
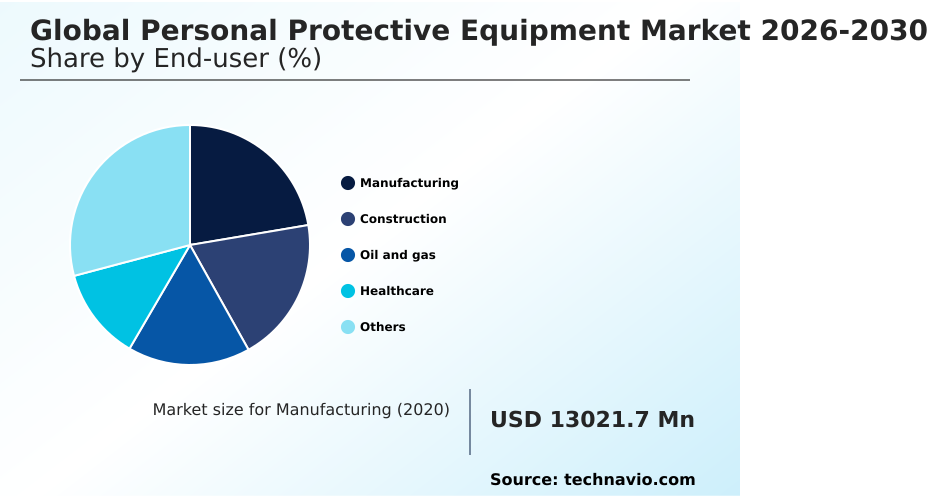
Get Free Sample

The Manufacturing segment was valued at USD 17.72 billion in 2024 and showed a gradual increase during the forecast period.
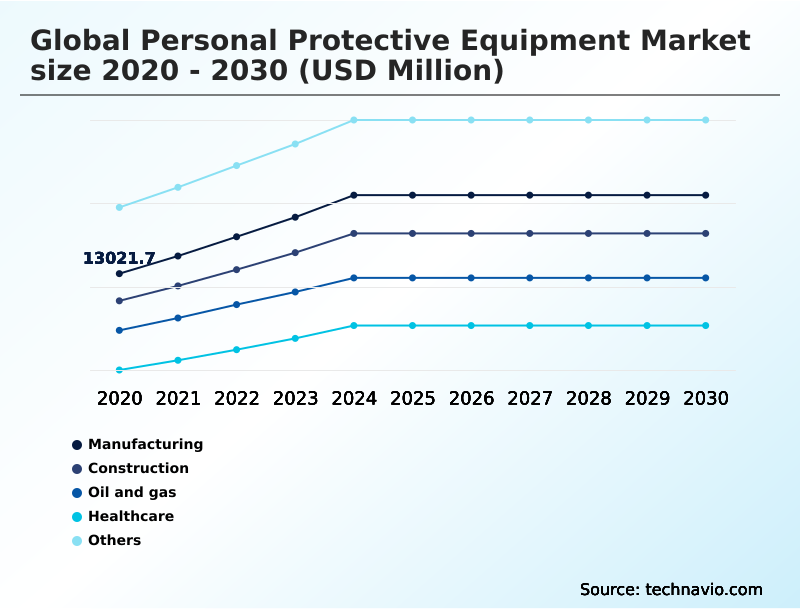
Get Free Sample

Regional Analysis

APAC is estimated to contribute 37.2% to the growth of the global market during the forecast period.Technavio’s analysts have elaborately explained the regional trends and drivers that shape the market during the forecast period.
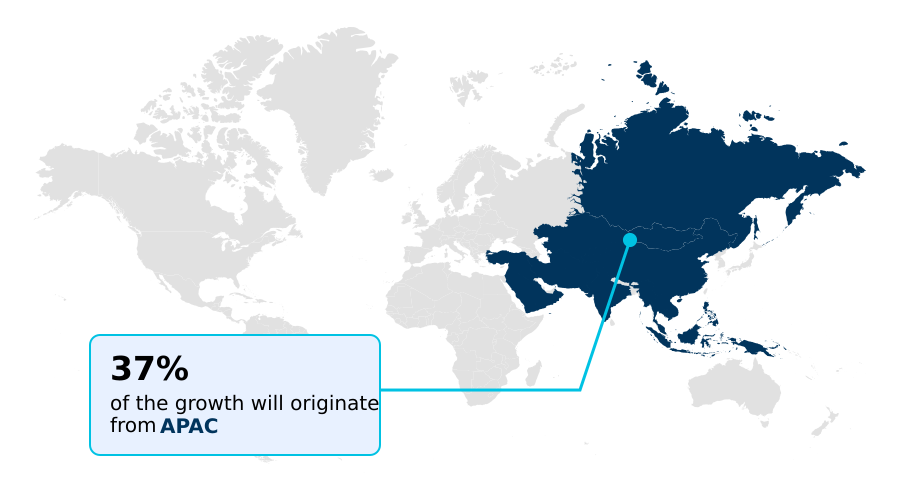
See How Personal Protective Equipment Market Demand is Rising in APAC Get Free Sample

The geographical dynamics of the Personal Protective Equipment Market reveal distinct regional strategies driven by varying industrial demands and regulatory frameworks.

North America demonstrates a rapid adoption of smart wearable technology, utilizing remote site monitoring to achieve a 30% higher industrial accident prevention rate than South America.

This advanced integration allows automated tracking of toxic gas detection, significantly reducing emergency response delays.

Conversely, the APAC region prioritizes mass manufacturing scalability, where the deployment of lightweight composite materials in thermal protective layers and cut resistant gloves has lowered operational procurement costs by 18% compared to European benchmarks.

European facilities emphasize stringent compliance, leading to a 25% higher implementation rate of advanced respiratory protection devices equipped with ergonomic weight reduction features.

These regional disparities highlight how localized supply chain resilience and distinct ergonomic design features shape safety procurement strategies worldwide.

Market Dynamics

Our researchers analyzed the data with 2025 as the base year, along with the key drivers, trends, and challenges. A holistic analysis of drivers will help companies refine their marketing strategies to gain a competitive advantage.

  • The operational integration of comprehensive safety protocols requires strategic investment in highly specialized equipment to protect workers across diverse hazardous environments. Facilities engaged in heavy manufacturing are increasingly adopting multi hazard protective clothing manufacturing processes that deliver advanced flame retardant textile development, ensuring superior defense against thermal and chemical threats.
  • By implementing smart wearable technology integration systems alongside biometric worker fatigue tracking systems, plant managers can accurately monitor physiological stress, achieving an estimated 20% higher operational efficiency compared to traditional reactive safety oversight. Industrial operations handling volatile substances prioritize chemical resistant hand protection gear and continuous environmental hazard detection gear to mitigate exposure risks effectively.
  • These proactive industrial workplace safety measures align seamlessly with strict occupational health compliance protocols, establishing a secure framework for complex fabrication sites. Furthermore, the deployment of automated respiratory protection monitoring devices ensures optimal air quality management, vastly outperforming manual gauge tracking in preventing inhalation-related incidents.
  • Construction and resource extraction sites require breathable high visibility industrial workwear and lightweight ergonomic head protection gear to maintain worker comfort during prolonged shifts. These environments also heavily rely on heavy machinery accident prevention systems and remote site environmental exposure monitoring to minimize physical risks in isolated zones.
  • Concurrently, medical and pharmaceutical sectors emphasize biological hazard infection control garments to maintain sterile operations. To address growing ecological concerns, manufacturers are advancing sustainable closed loop recycling protective gear, optimizing resource utilization while maintaining robust safety standards across all critical applications.
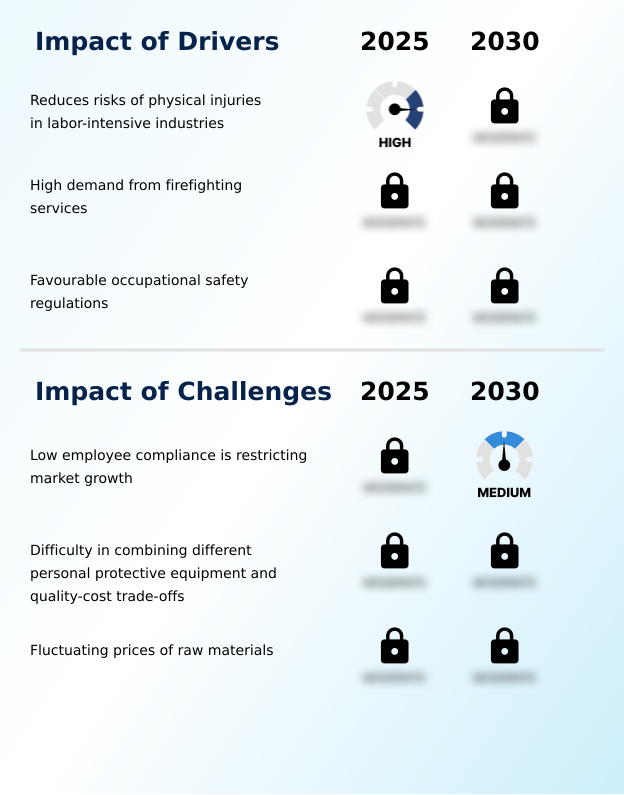
What are the key market drivers leading to the rise in the adoption of Personal Protective Equipment Industry?

  • The imperative to minimize physical injury risks within labor-intensive industries serves as a primary catalyst accelerating the widespread adoption of advanced safety solutions.

  • The escalating enforcement of occupational health standards acts as a primary catalyst accelerating the mandatory deployment of comprehensive industrial safety gear. Regulatory authorities are imposing strict compliance protocols, compelling organizations to prioritize proactive hazard risk mitigation.
  • Consequently, industries engaged in heavy machinery operations are rapidly adopting advanced fall protection systems and chemical resistant clothing to shield workers from severe threats.
  • This regulatory pressure has driven a 30% reduction in workplace liability claims for compliant facilities compared to non-compliant peers. Furthermore, the integration of real time safety alerts and automated procurement systems ensures continuous inventory availability, cutting equipment downtime by 22%.
  • By utilizing antimicrobial coatings on shared gear, businesses effectively maintain hygiene, improving overall workforce attendance by 14% through reduced illness transmission.

What are the market trends shaping the Personal Protective Equipment Industry?

  • The expansion of distribution networks across both retail and online channels has emerged as a critical market trend. This dual-channel approach enhances product accessibility and optimizes procurement efficiency for industrial buyers.

  • The rapid digitalization of industrial workspaces is driving a transformative trend toward the integration of biometric safety monitors and automated safety tracking into standard protective gear. This technological shift occurs as corporate safety officers demand data-driven insights to manage physiological stress in extreme conditions.
  • Consequently, the deployment of worker fatigue tracking systems has enabled facility managers to preemptively rotate staff, reducing heat-related exhaustion incidents by 28% compared to unmonitored baseline shifts. Simultaneously, the adoption of advanced flame retardant textiles and puncture resistant footwear has fortified structural hazard response capabilities, lowering equipment replacement costs by 15% annually.
  • In precision manufacturing, the transition to specialized clean room attire engineered for cross contamination prevention ensures strict hygiene maintenance, improving production yield accuracy by 12%. By implementing these proactive safety measures, organizations successfully enhance both workforce well-being and overall supply chain resilience against unforeseen operational disruptions.

What challenges does the Personal Protective Equipment Industry face during its growth?

  • Insufficient employee adherence to mandated safety protocols remains a significant operational challenge that limits the optimal effectiveness and broader expansion of protective equipment implementations.

  • Despite strict safety mandates, low employee compliance remains a critical barrier undermining effective hazardous environment protection. Workers frequently reject bulky multi hazard protective clothing and rigid impact protection gear due to severe heat stress during extended shifts. This resistance directly causes a 25% drop in safety management integration effectiveness compared to compliant teams.
  • Manufacturers struggle to balance the need for breathable safety apparel and lightweight high visibility workwear with the technical demands of advanced filtration efficiency. Meeting stringent occupational exposure limits requires robust materials that often compromise comfort, leading to a 15% higher rate of improper gear usage.
  • Transitioning toward sustainable closed loop recycling programs introduces logistical complexities, raising waste processing costs by 18% while simultaneously complicating the rollout of continuous monitoring systems.

Exclusive Technavio Analysis on Customer Landscape

The personal protective equipment market forecasting report includes the adoption lifecycle of the market, covering from the innovator’s stage to the laggard’s stage. It focuses on adoption rates in different regions based on penetration. Furthermore, the personal protective equipment market report also includes key purchase criteria and drivers of price sensitivity to help companies evaluate and develop their market growth analysis strategies.
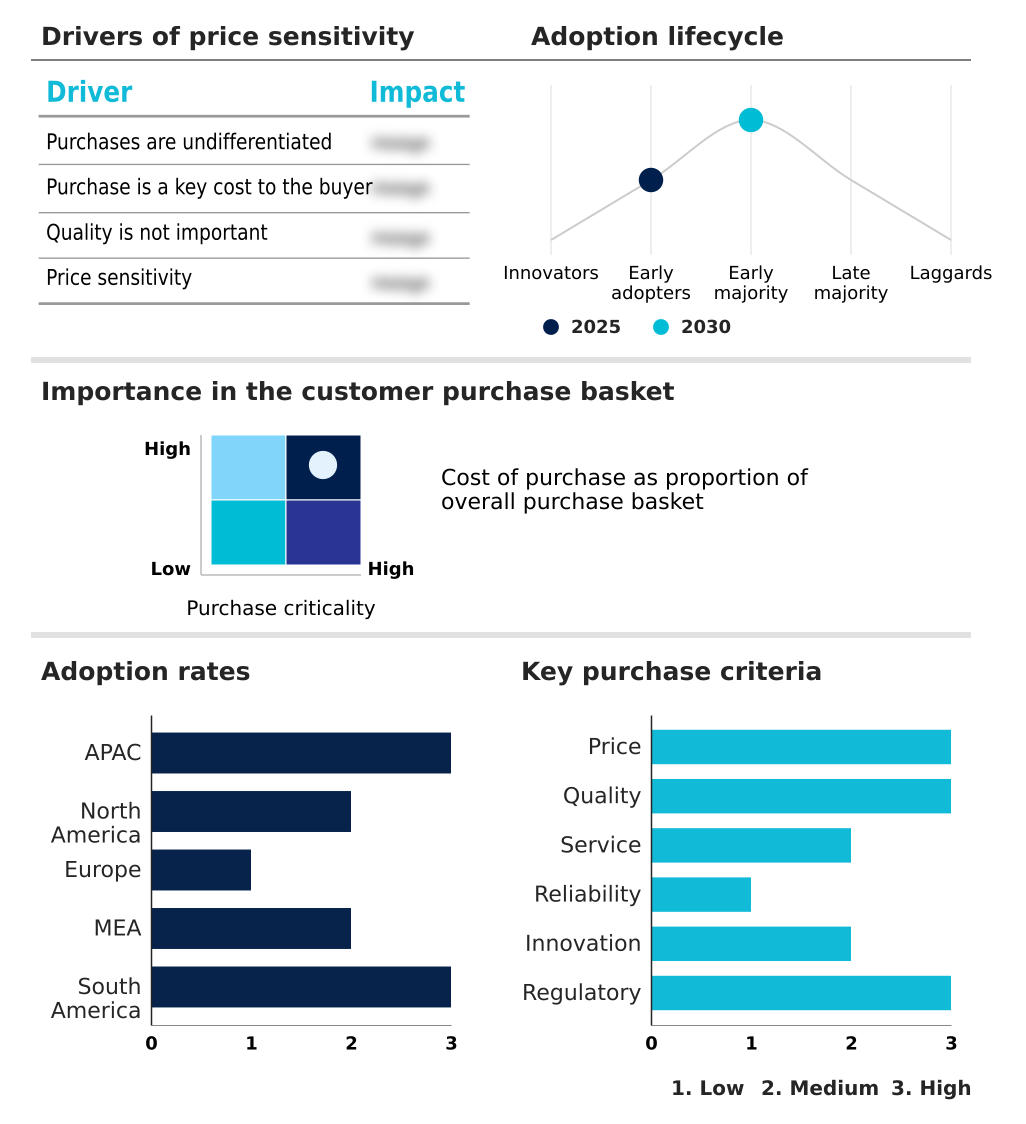
Customer Landscape of Personal Protective Equipment Industry

Competitive Landscape

Companies are implementing various strategies, such as strategic alliances, personal protective equipment market forecast, partnerships, mergers and acquisitions, geographical expansion, and product/service launches, to enhance their presence in the industry.

3M Co. - The provider delivers specialized protective solutions, encompassing high-performance particulate respirators and advanced safety eyewear, designed to ensure critical hazard protection and strict occupational compliance across complex industrial environments.

The industry research and growth report includes detailed analyses of the competitive landscape of the market and information about key companies, including:

  • 3M Co.
  • Alpha Pro Tech Ltd.
  • Ansell Ltd.
  • Bunzl Plc
  • Cardinal Health Inc.
  • Delta Plus Group SA
  • Dragerwerk AG and Co. KGaA
  • DuPont de Nemours Inc.
  • Globus Shetland Ltd.
  • Honeywell International Inc.
  • Kimberly Clark Corp.
  • Lakeland Industries Inc.
  • Medline Inc.
  • MSA Safety Inc.
  • Portwest Clothing Ltd.
  • Pyramex Safety Products LLC
  • Radians Inc.
  • Sioen Industries NV
  • Top Glove Corp. Bhd
  • UVEX GmbH and Co. KG

Qualitative and quantitative analysis of companies has been conducted to help clients understand the wider business environment as well as the strengths and weaknesses of key industry players. Data is qualitatively analyzed to categorize companies as pure play, category-focused, industry-focused, and diversified; it is quantitatively analyzed to categorize companies as dominant, leading, strong, tentative, and weak.

Recent Development and News in Personal protective equipment market

  • In the Apparel, Accessories and Luxury Goods industry, the transition toward advanced synthetic polymer weaving enhanced textile durability, directly impacting Personal Protective Equipment demand by enabling the production of highly resilient industrial safety garments that increased worker protection lifespans by up to 30%.
  • Strict regulatory enforcement regarding the elimination of harmful perfluorinated chemicals in textile manufacturing drove material innovation, compelling safety gear producers to adopt eco-friendly waterproofing alternatives that maintained 99% barrier efficacy against hazardous liquids.
  • The rapid integration of embedded sensor technologies into performance athletic wear accelerated cross-industry digital transformation, facilitating the development of smart wearable safety equipment that monitored biometric stress indicators with a 25% improvement in real-time accuracy.
  • Global supply chain restructurings prioritizing localized raw material sourcing stabilized production costs for high-tenacity fibers, ensuring consistent availability of specialized aramid fabrics required for flame-resistant gear and reducing procurement lead times by 15%.

Dive into Technavio’s robust research methodology, blending expert interviews, extensive data synthesis, and validated models for unparalleled Personal Protective Equipment Market insights. See full methodology.

Market Scope
Page number 310
Base year 2025
Historic period 2020-2024
Forecast period 2026-2030
Growth momentum & CAGR Accelerate at a CAGR of 9%
Market growth 2026-2030 USD 45661.2 million
Market structure Fragmented
YoY growth 2025-2026(%) 8.3%
Key countries China, Japan, India, South Korea, Australia, Indonesia, US, Canada, Mexico, Germany, UK, France, Italy, Spain, The Netherlands, Saudi Arabia, UAE, South Africa, Israel, Turkey, Brazil, Argentina and Chile
Competitive landscape Leading Companies, Market Positioning of Companies, Competitive Strategies, and Industry Risks

Request Free Sample

Research Analyst Overview

  • Strategic procurement within the Personal Protective Equipment Market is increasingly dictated by the necessity to balance rigorous regulatory compliance with elevated worker performance. The continuous evolution of hazardous environment protection has prompted corporate boards to heavily integrate safety investments into core budget planning, directly linking risk mitigation to sustained operational continuity.
  • By upgrading to advanced multi hazard protective clothing and impact protection gear, industrial facilities have achieved a 22% reduction in lost-time injury costs compared to utilizing standard-issue equipment. This shift is deeply influenced by the development of moisture wicking fabrics and breathable safety apparel, which significantly reduce heat stress and improve daily wearability during extended shifts.
  • Consequently, the adoption of high visibility workwear ensures optimal personnel tracking in low-light industrial settings. Furthermore, healthcare and laboratory environments rely on specialized infection control garments and biological hazard protection to maintain stringent sterile conditions. These material innovations demonstrate how proactive safety procurement strategically enhances overall workforce productivity and minimizes corporate liability across diverse high-risk sectors.

What are the Key Data Covered in this Personal Protective Equipment Market Research and Growth Report?

  • What is the expected growth of the Personal Protective Equipment Market between 2026 and 2030?

    • USD 45.66 billion, at a CAGR of 9%

  • What segmentation does the market report cover?

    • The report is segmented by End-user (Manufacturing, Construction, Oil and gas, Healthcare, and Others), Product (Protective clothing, Hand and arm protection, Protective footwear, Respiratory protection, and Others), Distribution Channel (Offline, and Online) and Geography (APAC, North America, Europe, Middle East and Africa, South America)

  • Which regions are analyzed in the report?

    • APAC, North America, Europe, Middle East and Africa and South America

  • What are the key growth drivers and market challenges?

    • Reduces risks of physical injuries in labor-intensive industries, Low employee compliance is restricting market growth

  • Who are the major players in the Personal Protective Equipment Market?

    • 3M Co., Alpha Pro Tech Ltd., Ansell Ltd., Bunzl Plc, Cardinal Health Inc., Delta Plus Group SA, Dragerwerk AG and Co. KGaA, DuPont de Nemours Inc., Globus Shetland Ltd., Honeywell International Inc., Kimberly Clark Corp., Lakeland Industries Inc., Medline Inc., MSA Safety Inc., Portwest Clothing Ltd., Pyramex Safety Products LLC, Radians Inc., Sioen Industries NV, Top Glove Corp. Bhd and UVEX GmbH and Co. KG

Market Research Insights

  • The Personal Protective Equipment Market continues to evolve as enterprises prioritize stringent hazard mitigation and robust workforce protection. Organizations implementing safety management integration strategies have observed a 28% reduction in compliance violation penalties compared to uncoordinated safety programs. The adoption of continuous monitoring systems allows facility managers to track real-time environmental hazards, improving emergency response times by 35%.
  • Furthermore, integrating respirators with advanced filtration efficiency ensures strict adherence to updated occupational exposure limits, lowering respiratory-related medical claims by 20% against previous benchmarks. Driven by sustainable operational goals, the shift toward closed loop recycling for disposable safety garments has additionally optimized material waste management, reinforcing both environmental compliance and long-term cost efficiency.

We can help! Our analysts can customize this personal protective equipment market research report to meet your requirements.

Get in touch

1. Executive Summary

1.1 Market overview

Executive Summary - Chart on Market Overview
Executive Summary - Data Table on Market Overview
Executive Summary - Chart on Global Market Characteristics
Executive Summary - Chart on Market by Geography
Executive Summary - Chart on Market Segmentation by End-user
Executive Summary - Chart on Market Segmentation by Product
Executive Summary - Chart on Market Segmentation by Distribution Channel
Executive Summary - Chart on Incremental Growth
Executive Summary - Data Table on Incremental Growth
Executive Summary - Chart on Company Market Positioning

2. Technavio Analysis

2.1 Analysis of price sensitivity, lifecycle, customer purchase basket, adoption rates, and purchase criteria

2.2 Criticality of inputs and Factors of differentiation

Chart on Overview on criticality of inputs and factors of differentiation

2.3 Factors of disruption

Chart on Overview on factors of disruption

2.4 Impact of drivers and challenges

Chart on Impact of drivers and challenges in 2025 and 2030

3. Market Landscape

3.1 Market ecosystem

Chart on Parent Market
Data Table on - Parent Market

3.2 Market characteristics

Chart on Market characteristics analysis

3.3 Value chain analysis

Chart on Value chain analysis

4. Market Sizing

4.1 Market definition

Data Table on Offerings of companies included in the market definition

4.2 Market segment analysis

Market segments

4.3 Market size 2025

4.4 Market outlook: Forecast for 2025-2030

Chart on Global - Market size and forecast 2025-2030 ($ million)
Data Table on Global - Market size and forecast 2025-2030 ($ million)
Chart on Global Market: Year-over-year growth 2025-2030 (%)
Data Table on Global Market: Year-over-year growth 2025-2030 (%)

5. Historic Market Size

5.1 Global Personal Protective Equipment Market 2020 - 2024

Historic Market Size - Data Table on Global Personal Protective Equipment Market 2020 - 2024 ($ million)

5.2 End-user segment analysis 2020 - 2024

Historic Market Size - End-user Segment 2020 - 2024 ($ million)

5.3 Product segment analysis 2020 - 2024

Historic Market Size - Product Segment 2020 - 2024 ($ million)

5.4 Distribution Channel segment analysis 2020 - 2024

Historic Market Size - Distribution Channel Segment 2020 - 2024 ($ million)

5.5 Geography segment analysis 2020 - 2024

Historic Market Size - Geography Segment 2020 - 2024 ($ million)

5.6 Country segment analysis 2020 - 2024

Historic Market Size - Country Segment 2020 - 2024 ($ million)

6. Qualitative Analysis

6.1 Impact of AI on Global Personal Protective Equipment Market

6.2 Impact of Geopolitical Conflicts on Global Personal Protective Equipment Market

7. Five Forces Analysis

7.1 Five forces summary

Five forces analysis - Comparison between 2025 and 2030

7.2 Bargaining power of buyers

Bargaining power of buyers - Impact of key factors 2025 and 2030

7.3 Bargaining power of suppliers

Bargaining power of suppliers - Impact of key factors in 2025 and 2030

7.4 Threat of new entrants

Threat of new entrants - Impact of key factors in 2025 and 2030

7.5 Threat of substitutes

Threat of substitutes - Impact of key factors in 2025 and 2030

7.6 Threat of rivalry

Threat of rivalry - Impact of key factors in 2025 and 2030

7.7 Market condition

Chart on Market condition - Five forces 2025 and 2030

8. Market Segmentation by End-user

8.1 Market segments

Chart on End-user - Market share 2025-2030 (%)
Data Table on End-user - Market share 2025-2030 (%)

8.2 Comparison by End-user

Chart on Comparison by End-user
Data Table on Comparison by End-user

8.3 Manufacturing - Market size and forecast 2025-2030

Chart on Manufacturing - Market size and forecast 2025-2030 ($ million)
Data Table on Manufacturing - Market size and forecast 2025-2030 ($ million)
Chart on Manufacturing - Year-over-year growth 2025-2030 (%)
Data Table on Manufacturing - Year-over-year growth 2025-2030 (%)

8.4 Construction - Market size and forecast 2025-2030

Chart on Construction - Market size and forecast 2025-2030 ($ million)
Data Table on Construction - Market size and forecast 2025-2030 ($ million)
Chart on Construction - Year-over-year growth 2025-2030 (%)
Data Table on Construction - Year-over-year growth 2025-2030 (%)

8.5 Oil and gas - Market size and forecast 2025-2030

Chart on Oil and gas - Market size and forecast 2025-2030 ($ million)
Data Table on Oil and gas - Market size and forecast 2025-2030 ($ million)
Chart on Oil and gas - Year-over-year growth 2025-2030 (%)
Data Table on Oil and gas - Year-over-year growth 2025-2030 (%)

8.6 Healthcare - Market size and forecast 2025-2030

Chart on Healthcare - Market size and forecast 2025-2030 ($ million)
Data Table on Healthcare - Market size and forecast 2025-2030 ($ million)
Chart on Healthcare - Year-over-year growth 2025-2030 (%)
Data Table on Healthcare - Year-over-year growth 2025-2030 (%)

8.7 Others - Market size and forecast 2025-2030

Chart on Others - Market size and forecast 2025-2030 ($ million)
Data Table on Others - Market size and forecast 2025-2030 ($ million)
Chart on Others - Year-over-year growth 2025-2030 (%)
Data Table on Others - Year-over-year growth 2025-2030 (%)

8.8 Market opportunity by End-user

Market opportunity by End-user ($ million)
Data Table on Market opportunity by End-user ($ million)

9. Market Segmentation by Product

9.1 Market segments

Chart on Product - Market share 2025-2030 (%)
Data Table on Product - Market share 2025-2030 (%)

9.2 Comparison by Product

Chart on Comparison by Product
Data Table on Comparison by Product

9.3 Protective clothing - Market size and forecast 2025-2030

Chart on Protective clothing - Market size and forecast 2025-2030 ($ million)
Data Table on Protective clothing - Market size and forecast 2025-2030 ($ million)
Chart on Protective clothing - Year-over-year growth 2025-2030 (%)
Data Table on Protective clothing - Year-over-year growth 2025-2030 (%)

9.4 Hand and arm protection - Market size and forecast 2025-2030

Chart on Hand and arm protection - Market size and forecast 2025-2030 ($ million)
Data Table on Hand and arm protection - Market size and forecast 2025-2030 ($ million)
Chart on Hand and arm protection - Year-over-year growth 2025-2030 (%)
Data Table on Hand and arm protection - Year-over-year growth 2025-2030 (%)

9.5 Protective footwear - Market size and forecast 2025-2030

Chart on Protective footwear - Market size and forecast 2025-2030 ($ million)
Data Table on Protective footwear - Market size and forecast 2025-2030 ($ million)
Chart on Protective footwear - Year-over-year growth 2025-2030 (%)
Data Table on Protective footwear - Year-over-year growth 2025-2030 (%)

9.6 Respiratory protection - Market size and forecast 2025-2030

Chart on Respiratory protection - Market size and forecast 2025-2030 ($ million)
Data Table on Respiratory protection - Market size and forecast 2025-2030 ($ million)
Chart on Respiratory protection - Year-over-year growth 2025-2030 (%)
Data Table on Respiratory protection - Year-over-year growth 2025-2030 (%)

9.7 Others - Market size and forecast 2025-2030

Chart on Others - Market size and forecast 2025-2030 ($ million)
Data Table on Others - Market size and forecast 2025-2030 ($ million)
Chart on Others - Year-over-year growth 2025-2030 (%)
Data Table on Others - Year-over-year growth 2025-2030 (%)

9.8 Market opportunity by Product

Market opportunity by Product ($ million)
Data Table on Market opportunity by Product ($ million)

10. Market Segmentation by Distribution Channel

10.1 Market segments

Chart on Distribution Channel - Market share 2025-2030 (%)
Data Table on Distribution Channel - Market share 2025-2030 (%)

10.2 Comparison by Distribution Channel

Chart on Comparison by Distribution Channel
Data Table on Comparison by Distribution Channel

10.3 Offline - Market size and forecast 2025-2030

Chart on Offline - Market size and forecast 2025-2030 ($ million)
Data Table on Offline - Market size and forecast 2025-2030 ($ million)
Chart on Offline - Year-over-year growth 2025-2030 (%)
Data Table on Offline - Year-over-year growth 2025-2030 (%)

10.4 Online - Market size and forecast 2025-2030

Chart on Online - Market size and forecast 2025-2030 ($ million)
Data Table on Online - Market size and forecast 2025-2030 ($ million)
Chart on Online - Year-over-year growth 2025-2030 (%)
Data Table on Online - Year-over-year growth 2025-2030 (%)

10.5 Market opportunity by Distribution Channel

Market opportunity by Distribution Channel ($ million)
Data Table on Market opportunity by Distribution Channel ($ million)

11. Customer Landscape

11.1 Customer landscape overview

Analysis of price sensitivity, lifecycle, customer purchase basket, adoption rates, and purchase criteria

12. Geographic Landscape

12.1 Geographic segmentation

Chart on Market share by geography 2025-2030 (%)
Data Table on Market share by geography 2025-2030 (%)

12.2 Geographic comparison

Chart on Geographic comparison
Data Table on Geographic comparison

12.3 APAC - Market size and forecast 2025-2030

Chart on APAC - Market size and forecast 2025-2030 ($ million)
Data Table on APAC - Market size and forecast 2025-2030 ($ million)
Chart on APAC - Year-over-year growth 2025-2030 (%)
Data Table on APAC - Year-over-year growth 2025-2030 (%)
Chart on Regional Comparison - APAC
Data Table on Regional Comparison - APAC

12.3.1 China - Market size and forecast 2025-2030

Chart on China - Market size and forecast 2025-2030 ($ million)
Data Table on China - Market size and forecast 2025-2030 ($ million)
Chart on China - Year-over-year growth 2025-2030 (%)
Data Table on China - Year-over-year growth 2025-2030 (%)

12.3.2 Japan - Market size and forecast 2025-2030

Chart on Japan - Market size and forecast 2025-2030 ($ million)
Data Table on Japan - Market size and forecast 2025-2030 ($ million)
Chart on Japan - Year-over-year growth 2025-2030 (%)
Data Table on Japan - Year-over-year growth 2025-2030 (%)

12.3.3 India - Market size and forecast 2025-2030

Chart on India - Market size and forecast 2025-2030 ($ million)
Data Table on India - Market size and forecast 2025-2030 ($ million)
Chart on India - Year-over-year growth 2025-2030 (%)
Data Table on India - Year-over-year growth 2025-2030 (%)

12.3.4 South Korea - Market size and forecast 2025-2030

Chart on South Korea - Market size and forecast 2025-2030 ($ million)
Data Table on South Korea - Market size and forecast 2025-2030 ($ million)
Chart on South Korea - Year-over-year growth 2025-2030 (%)
Data Table on South Korea - Year-over-year growth 2025-2030 (%)

12.3.5 Australia - Market size and forecast 2025-2030

Chart on Australia - Market size and forecast 2025-2030 ($ million)
Data Table on Australia - Market size and forecast 2025-2030 ($ million)
Chart on Australia - Year-over-year growth 2025-2030 (%)
Data Table on Australia - Year-over-year growth 2025-2030 (%)

12.3.6 Indonesia - Market size and forecast 2025-2030

Chart on Indonesia - Market size and forecast 2025-2030 ($ million)
Data Table on Indonesia - Market size and forecast 2025-2030 ($ million)
Chart on Indonesia - Year-over-year growth 2025-2030 (%)
Data Table on Indonesia - Year-over-year growth 2025-2030 (%)

12.4 North America - Market size and forecast 2025-2030

Chart on North America - Market size and forecast 2025-2030 ($ million)
Data Table on North America - Market size and forecast 2025-2030 ($ million)
Chart on North America - Year-over-year growth 2025-2030 (%)
Data Table on North America - Year-over-year growth 2025-2030 (%)
Chart on Regional Comparison - North America
Data Table on Regional Comparison - North America

12.4.1 US - Market size and forecast 2025-2030

Chart on US - Market size and forecast 2025-2030 ($ million)
Data Table on US - Market size and forecast 2025-2030 ($ million)
Chart on US - Year-over-year growth 2025-2030 (%)
Data Table on US - Year-over-year growth 2025-2030 (%)

12.4.2 Canada - Market size and forecast 2025-2030

Chart on Canada - Market size and forecast 2025-2030 ($ million)
Data Table on Canada - Market size and forecast 2025-2030 ($ million)
Chart on Canada - Year-over-year growth 2025-2030 (%)
Data Table on Canada - Year-over-year growth 2025-2030 (%)

12.4.3 Mexico - Market size and forecast 2025-2030

Chart on Mexico - Market size and forecast 2025-2030 ($ million)
Data Table on Mexico - Market size and forecast 2025-2030 ($ million)
Chart on Mexico - Year-over-year growth 2025-2030 (%)
Data Table on Mexico - Year-over-year growth 2025-2030 (%)

12.5 Europe - Market size and forecast 2025-2030

Chart on Europe - Market size and forecast 2025-2030 ($ million)
Data Table on Europe - Market size and forecast 2025-2030 ($ million)
Chart on Europe - Year-over-year growth 2025-2030 (%)
Data Table on Europe - Year-over-year growth 2025-2030 (%)
Chart on Regional Comparison - Europe
Data Table on Regional Comparison - Europe

12.5.1 Germany - Market size and forecast 2025-2030

Chart on Germany - Market size and forecast 2025-2030 ($ million)
Data Table on Germany - Market size and forecast 2025-2030 ($ million)
Chart on Germany - Year-over-year growth 2025-2030 (%)
Data Table on Germany - Year-over-year growth 2025-2030 (%)

12.5.2 UK - Market size and forecast 2025-2030

Chart on UK - Market size and forecast 2025-2030 ($ million)
Data Table on UK - Market size and forecast 2025-2030 ($ million)
Chart on UK - Year-over-year growth 2025-2030 (%)
Data Table on UK - Year-over-year growth 2025-2030 (%)

12.5.3 France - Market size and forecast 2025-2030

Chart on France - Market size and forecast 2025-2030 ($ million)
Data Table on France - Market size and forecast 2025-2030 ($ million)
Chart on France - Year-over-year growth 2025-2030 (%)
Data Table on France - Year-over-year growth 2025-2030 (%)

12.5.4 Italy - Market size and forecast 2025-2030

Chart on Italy - Market size and forecast 2025-2030 ($ million)
Data Table on Italy - Market size and forecast 2025-2030 ($ million)
Chart on Italy - Year-over-year growth 2025-2030 (%)
Data Table on Italy - Year-over-year growth 2025-2030 (%)

12.5.5 Spain - Market size and forecast 2025-2030

Chart on Spain - Market size and forecast 2025-2030 ($ million)
Data Table on Spain - Market size and forecast 2025-2030 ($ million)
Chart on Spain - Year-over-year growth 2025-2030 (%)
Data Table on Spain - Year-over-year growth 2025-2030 (%)

12.5.6 The Netherlands - Market size and forecast 2025-2030

Chart on The Netherlands - Market size and forecast 2025-2030 ($ million)
Data Table on The Netherlands - Market size and forecast 2025-2030 ($ million)
Chart on The Netherlands - Year-over-year growth 2025-2030 (%)
Data Table on The Netherlands - Year-over-year growth 2025-2030 (%)

12.6 Middle East and Africa - Market size and forecast 2025-2030

Chart on Middle East and Africa - Market size and forecast 2025-2030 ($ million)
Data Table on Middle East and Africa - Market size and forecast 2025-2030 ($ million)
Chart on Middle East and Africa - Year-over-year growth 2025-2030 (%)
Data Table on Middle East and Africa - Year-over-year growth 2025-2030 (%)
Chart on Regional Comparison - Middle East and Africa
Data Table on Regional Comparison - Middle East and Africa

12.6.1 Saudi Arabia - Market size and forecast 2025-2030

Chart on Saudi Arabia - Market size and forecast 2025-2030 ($ million)
Data Table on Saudi Arabia - Market size and forecast 2025-2030 ($ million)
Chart on Saudi Arabia - Year-over-year growth 2025-2030 (%)
Data Table on Saudi Arabia - Year-over-year growth 2025-2030 (%)

12.6.2 UAE - Market size and forecast 2025-2030

Chart on UAE - Market size and forecast 2025-2030 ($ million)
Data Table on UAE - Market size and forecast 2025-2030 ($ million)
Chart on UAE - Year-over-year growth 2025-2030 (%)
Data Table on UAE - Year-over-year growth 2025-2030 (%)

12.6.3 South Africa - Market size and forecast 2025-2030

Chart on South Africa - Market size and forecast 2025-2030 ($ million)
Data Table on South Africa - Market size and forecast 2025-2030 ($ million)
Chart on South Africa - Year-over-year growth 2025-2030 (%)
Data Table on South Africa - Year-over-year growth 2025-2030 (%)

12.6.4 Israel - Market size and forecast 2025-2030

Chart on Israel - Market size and forecast 2025-2030 ($ million)
Data Table on Israel - Market size and forecast 2025-2030 ($ million)
Chart on Israel - Year-over-year growth 2025-2030 (%)
Data Table on Israel - Year-over-year growth 2025-2030 (%)

12.6.5 Turkey - Market size and forecast 2025-2030

Chart on Turkey - Market size and forecast 2025-2030 ($ million)
Data Table on Turkey - Market size and forecast 2025-2030 ($ million)
Chart on Turkey - Year-over-year growth 2025-2030 (%)
Data Table on Turkey - Year-over-year growth 2025-2030 (%)

12.7 South America - Market size and forecast 2025-2030

Chart on South America - Market size and forecast 2025-2030 ($ million)
Data Table on South America - Market size and forecast 2025-2030 ($ million)
Chart on South America - Year-over-year growth 2025-2030 (%)
Data Table on South America - Year-over-year growth 2025-2030 (%)
Chart on Regional Comparison - South America
Data Table on Regional Comparison - South America

12.7.1 Brazil - Market size and forecast 2025-2030

Chart on Brazil - Market size and forecast 2025-2030 ($ million)
Data Table on Brazil - Market size and forecast 2025-2030 ($ million)
Chart on Brazil - Year-over-year growth 2025-2030 (%)
Data Table on Brazil - Year-over-year growth 2025-2030 (%)

12.7.2 Argentina - Market size and forecast 2025-2030

Chart on Argentina - Market size and forecast 2025-2030 ($ million)
Data Table on Argentina - Market size and forecast 2025-2030 ($ million)
Chart on Argentina - Year-over-year growth 2025-2030 (%)
Data Table on Argentina - Year-over-year growth 2025-2030 (%)

12.7.3 Chile - Market size and forecast 2025-2030

Chart on Chile - Market size and forecast 2025-2030 ($ million)
Data Table on Chile - Market size and forecast 2025-2030 ($ million)
Chart on Chile - Year-over-year growth 2025-2030 (%)
Data Table on Chile - Year-over-year growth 2025-2030 (%)

12.8 Market opportunity by geography

Market opportunity by geography ($ million)
Data Tables on Market opportunity by geography ($ million)

13. Drivers, Challenges, and Opportunity

13.1 Market drivers

Reduces risks of physical injuries in labor-intensive industries
High demand from firefighting services
Favourable occupational safety regulations

13.2 Market challenges

Low employee compliance is restricting market growth
Difficulty in combining different personal protective equipment and quality-cost trade-offs
Fluctuating prices of raw materials

13.3 Impact of drivers and challenges

Impact of drivers and challenges in 2025 and 2030

13.4 Market opportunities

Growing distribution through retail and online channels
Focus on integrating anti-microbial technology
Technical advances in personal protective equipment industry

14. Competitive Landscape

14.1 Overview

14.2

Overview on criticality of inputs and factors of differentiation

14.3 Landscape disruption

Overview on factors of disruption

14.4 Industry risks

Impact of key risks on business

15. Competitive Analysis

15.1 Companies profiled

Companies covered

15.2 Company ranking index

15.3 Market positioning of companies

Matrix on companies position and classification

15.4 3M Co.

3M Co. - Overview
3M Co. - Business segments
3M Co. - Key news
3M Co. - Key offerings
3M Co. - Segment focus
SWOT

15.5 Ansell Ltd.

Ansell Ltd. - Overview
Ansell Ltd. - Business segments
Ansell Ltd. - Key offerings
Ansell Ltd. - Segment focus
SWOT

15.6 Bunzl Plc

Bunzl Plc - Overview
Bunzl Plc - Business segments
Bunzl Plc - Key offerings
Bunzl Plc - Segment focus
SWOT

15.7 Cardinal Health Inc.

Cardinal Health Inc. - Overview
Cardinal Health Inc. - Business segments
Cardinal Health Inc. - Key offerings
Cardinal Health Inc. - Segment focus
SWOT

15.8 Delta Plus Group SA

Delta Plus Group SA - Overview
Delta Plus Group SA - Product / Service
Delta Plus Group SA - Key offerings
SWOT

15.9 Dragerwerk AG and Co. KGaA

Dragerwerk AG and Co. KGaA - Overview
Dragerwerk AG and Co. KGaA - Business segments
Dragerwerk AG and Co. KGaA - Key offerings
Dragerwerk AG and Co. KGaA - Segment focus
SWOT

15.10 DuPont de Nemours Inc.

DuPont de Nemours Inc. - Overview
DuPont de Nemours Inc. - Business segments
DuPont de Nemours Inc. - Key news
DuPont de Nemours Inc. - Key offerings
DuPont de Nemours Inc. - Segment focus
SWOT

15.11 Globus Shetland Ltd.

Globus Shetland Ltd. - Overview
Globus Shetland Ltd. - Product / Service
Globus Shetland Ltd. - Key offerings
SWOT

15.12 Honeywell International Inc.

Honeywell International Inc. - Overview
Honeywell International Inc. - Business segments
Honeywell International Inc. - Key news
Honeywell International Inc. - Key offerings
Honeywell International Inc. - Segment focus
SWOT

15.13 Kimberly Clark Corp.

Kimberly Clark Corp. - Overview
Kimberly Clark Corp. - Business segments
Kimberly Clark Corp. - Key offerings
Kimberly Clark Corp. - Segment focus
SWOT

15.14 Lakeland Industries Inc.

Lakeland Industries Inc. - Overview
Lakeland Industries Inc. - Business segments
Lakeland Industries Inc. - Key offerings
Lakeland Industries Inc. - Segment focus
SWOT

15.15 Medline Inc.

Medline Inc. - Overview
Medline Inc. - Product / Service
Medline Inc. - Key offerings
SWOT

15.16 MSA Safety Inc.

MSA Safety Inc. - Overview
MSA Safety Inc. - Business segments
MSA Safety Inc. - Key offerings
MSA Safety Inc. - Segment focus
SWOT

15.17 Portwest Clothing Ltd.

Portwest Clothing Ltd. - Overview
Portwest Clothing Ltd. - Product / Service
Portwest Clothing Ltd. - Key offerings
SWOT

15.18 Sioen Industries NV

Sioen Industries NV - Overview
Sioen Industries NV - Product / Service
Sioen Industries NV - Key offerings
SWOT

16. Appendix

16.1 Scope of the report

Market definition
Objectives
Notes and caveats

16.2 Inclusions and exclusions checklist

Inclusions checklist
Exclusions checklist

16.3 Currency conversion rates for US$

16.4 Research methodology

16.5 Data procurement

Information sources

16.6 Data validation

16.7 Validation techniques employed for market sizing

16.8 Data synthesis

16.9 360 degree market analysis

16.10 List of abbreviations

Research Methodology

Technavio presents a detailed picture of the market by way of study, synthesis, and summation of data from multiple sources. The analysts have presented the various facets of the market with a particular focus on identifying the key industry influencers. The data thus presented is comprehensive, reliable, and the result of extensive research, both primary and secondary.

INFORMATION SOURCES

Primary sources

  • Manufacturers and suppliers
  • Channel partners
  • Industry experts
  • Strategic decision makers

Secondary sources

  • Industry journals and periodicals
  • Government data
  • Financial reports of key industry players
  • Historical data
  • Press releases

DATA ANALYSIS

Data Synthesis

  • Collation of data
  • Estimation of key figures
  • Analysis of derived insights

Data Validation

  • Triangulation with data models
  • Reference against proprietary databases
  • Corroboration with industry experts

REPORT WRITING

Qualitative

  • Market drivers
  • Market challenges
  • Market trends
  • Five forces analysis

Quantitative

  • Market size and forecast
  • Market segmentation
  • Geographical insights
  • Competitive landscape

Interested in this report?

Get your sample now to see our research methodology and insights!

Download Now

Frequently Asked Questions

Personal Protective Equipment market growth will increase by USD 45661.2 million during 2026-2030.

The Personal Protective Equipment market is expected to grow at a CAGR of 9% during 2026-2030.

Personal Protective Equipment market is segmented by End-user (Manufacturing, Construction, Oil and gas, Healthcare, Others) Product (Protective clothing, Hand and arm protection, Protective footwear, Respiratory protection, Others) Distribution channel (Offline, Online)

3M Co., Alpha Pro Tech Ltd., Ansell Ltd., Bunzl Plc, Cardinal Health Inc., Delta Plus Group SA, Dragerwerk AG and Co. KGaA, DuPont de Nemours Inc., Globus Shetland Ltd., Honeywell International Inc., Kimberly Clark Corp., Lakeland Industries Inc., Medline Inc., MSA Safety Inc., Portwest Clothing Ltd., Pyramex Safety Products LLC, Radians Inc., Sioen Industries NV, Top Glove Corp. Bhd, UVEX GmbH and Co. KG are a few of the key vendors in the Personal Protective Equipment market.

APAC will register the highest growth rate of 37.2% among the other regions. Therefore, the Personal Protective Equipment market in APAC is expected to garner significant business opportunities for the vendors during the forecast period.

China, Japan, India, South Korea, Australia, Indonesia, US, Canada, Mexico, Germany, UK, France, Italy, Spain, The Netherlands, Saudi Arabia, UAE, South Africa, Israel, Turkey, Brazil, Argentina, Chile

  • Reduces risks of physical injuries in labor-intensive industries is the driving factor this market.

The Personal Protective Equipment market vendors should focus on grabbing business opportunities from the End-user segment as it accounted for the largest market share in the base year.
RIA - Research AI Assistant
Ask RIA
