Coffee Pods And Capsules Market Size 2026-2030
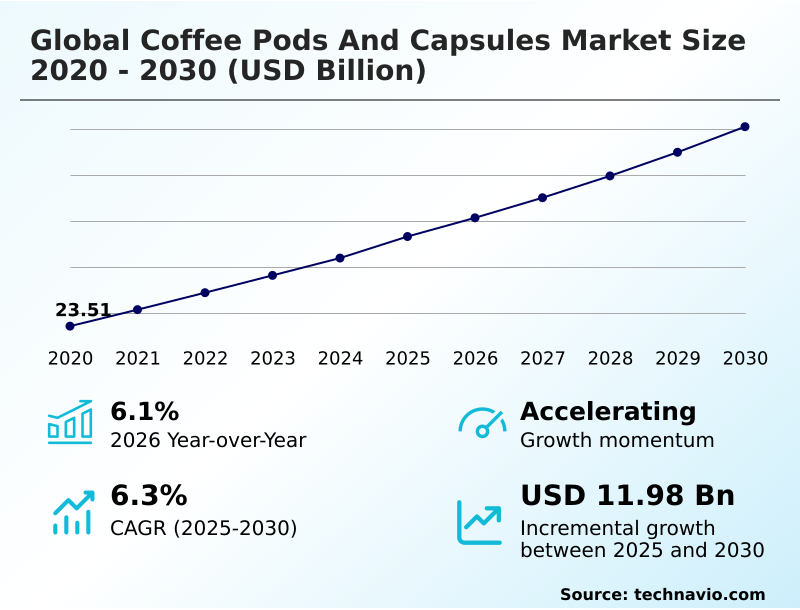
The coffee pods and capsules market size is valued to increase by USD 11.98 billion, at a CAGR of 6.3% from 2025 to 2030. Proliferation of premium home coffee will drive the coffee pods and capsules market.
Major Market Trends & Insights
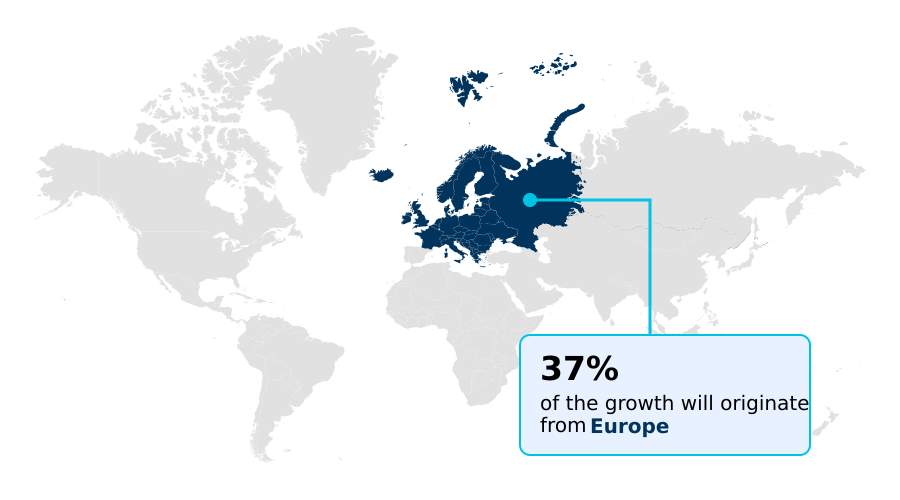
- Europe dominated the market and accounted for a 37.4% growth during the forecast period.
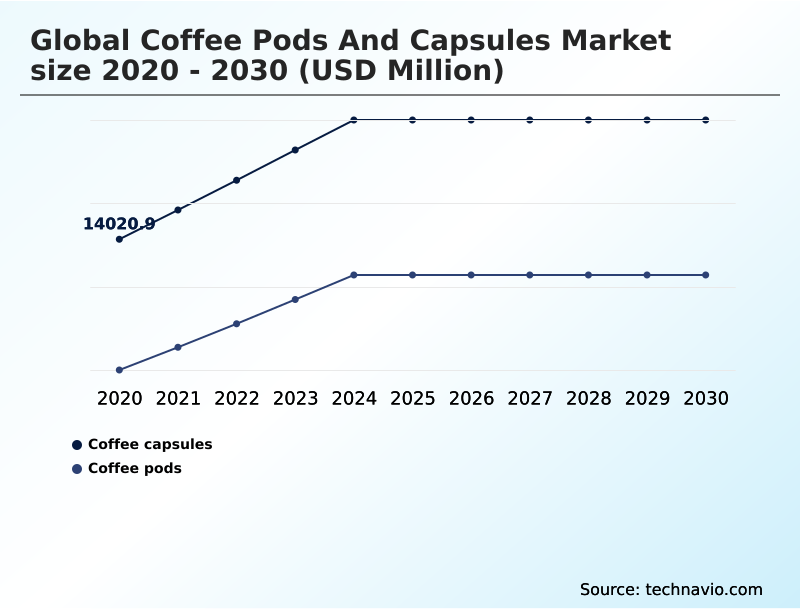
- By Type - Coffee capsules segment was valued at USD 18.16 billion in 2024
- By Product - Capsule and plastic cup-based coffee pods segment accounted for the largest market revenue share in 2024
Market Size & Forecast
- Market Opportunities: USD 21.77 billion
- Market Future Opportunities: USD 11.98 billion
- CAGR from 2025 to 2030 : 6.3%
Market Summary
- The coffee pods and capsules market is shaped by the convergence of consumer demand for convenience and the pursuit of a superior sensory profile. Core to this industry is the engineering behind the single-serve format, where factors like grind size calibration and water distribution discs are critical for achieving consistent crema quality.
- A key driver is the consumer shift toward specialty grade beans, which has pushed manufacturers to perfect aromatic compound preservation through technologies like nitrogen flushing. This pursuit of quality extends to functional coffee blends incorporating nootropic additives. However, the market grapples with challenges related to pod compatibility engineering and the environmental footprint of single-use products.
- For instance, a company transitioning to compostable polymers must reconfigure its supply chain to manage new material sensitivities, a complex operational pivot that underscores the industry's balance between innovation, sustainability, and mass-market accessibility. This dynamic fosters continuous advancements in both material science and brewing technology.
What will be the Size of the Coffee Pods And Capsules Market during the forecast period?
Get Key Insights on Market Forecast (PDF) Get Free Sample
How is the Coffee Pods And Capsules Market Segmented?
The coffee pods and capsules industry research report provides comprehensive data (region-wise segment analysis), with forecasts and estimates in "USD million" for the period 2026-2030, as well as historical data from 2020-2024 for the following segments.
- Type
- Coffee capsules
- Coffee pods
- Product
- Capsule and plastic cup-based coffee pods
- Foil and paper-wrapped coffee pods
- Distribution channel
- Off-trade
- On-trade
- Geography
- Europe
- Germany
- France
- Italy
- North America
- US
- Canada
- Mexico
- APAC
- China
- Japan
- Australia
- Middle East and Africa
- UAE
- Saudi Arabia
- Turkey
- South America
- Brazil
- Argentina
- Colombia
- Rest of World (ROW)
- Europe
By Type Insights
The coffee capsules segment is estimated to witness significant growth during the forecast period.
The coffee capsules market segment is defined by its reliance on rigid, single-serve formats designed for high-pressure extraction systems that deliver a premium home coffee experience.
Material science innovation is central to this category, with a focus on perfecting the brewing cycle integrity of aluminum capsules and advanced plastic cups.
Key performance attributes include hermetic sealing for shelf life preservation and proprietary puncture patterns that optimize extraction efficiency.
As part of broader circular economy initiatives, a transition toward mono-material plastic cups is evident, with some producers achieving a 15% reduction in packaging weight without compromising the oxygen barrier coatings.
This evolution reflects a market balancing convenience-driven consumption with sustainable packaging solutions and the technical demands of barista-quality replication at home.
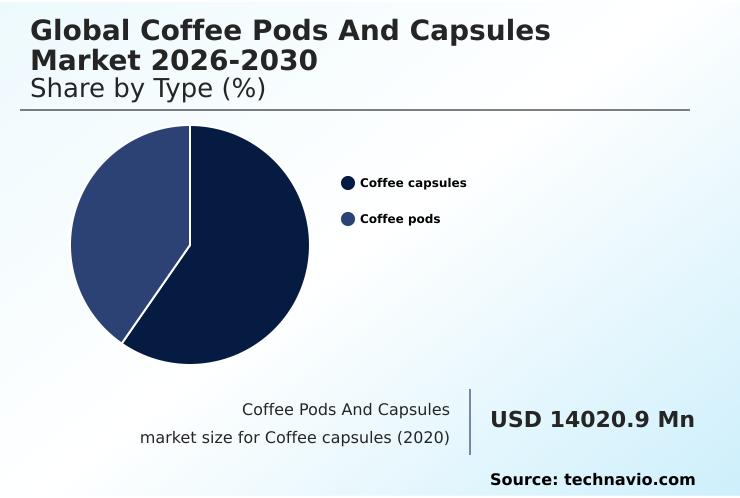
The Coffee capsules segment was valued at USD 18.16 billion in 2024 and showed a gradual increase during the forecast period.
Regional Analysis
Europe is estimated to contribute 37.4% to the growth of the global market during the forecast period.Technavio’s analysts have elaborately explained the regional trends and drivers that shape the market during the forecast period.
See How Coffee Pods And Capsules Market Demand is Rising in Europe Get Free Sample
The global market exhibits distinct regional dynamics, with mature markets in Europe prioritizing ethical sourcing certification and a home compostable alternative, while high-growth markets in APAC focus on capturing new users.
Europe's incremental growth accounts for over 37% of the global total, driven by strong demand for products with superior brewing chamber design.
In contrast, APAC is the fastest-growing region, with a CAGR of 8.6%, fueled by rising disposable incomes and the adoption of on-trade channel distribution in urban centers.
This growth is supported by the introduction of paper pods and cold extraction capsules catering to local tastes.
North America, with a 6.7% CAGR, is seeing a convergence of these trends, with a rising demand for both convenience and sustainable plant-based materials in its single-serve coffee systems.
Market Dynamics
Our researchers analyzed the data with 2025 as the base year, along with the key drivers, trends, and challenges. A holistic analysis of drivers will help companies refine their marketing strategies to gain a competitive advantage.
- Strategic decision-making in the coffee pods and capsules market is increasingly shaped by long-term considerations around sustainability, supply chain resilience, and technological sovereignty. The environmental impact of single-use capsules has moved from a peripheral concern to a central business challenge, compelling companies to evaluate the supply chain logistics for specialty coffee pods made from novel materials.
- Firms are now navigating the challenges of creating plant-based material pods, which involves significant R&D investment. Simultaneously, the growth of direct-to-consumer subscription models is altering distribution strategies, while the role of smart brewing systems in personalization creates new avenues for customer engagement.
- The market is also defined by intellectual property issues in pod design and the ongoing quest for a universal compatibility for coffee pod machines. Examining market adoption of paper-based coffee pods reveals that regions with robust recycling programs for aluminum coffee capsules are slower to transition, a factor that influences regional product strategy.
- This complex interplay of factors, including consumer preference for ethical sourcing certification and the influence of the third-wave coffee movement on capsule variety, demands a nuanced approach to long-range planning. Price volatility impact on coffee pod manufacturing remains a constant pressure, further complicating strategic forecasts.
What are the key market drivers leading to the rise in the adoption of Coffee Pods And Capsules Industry?
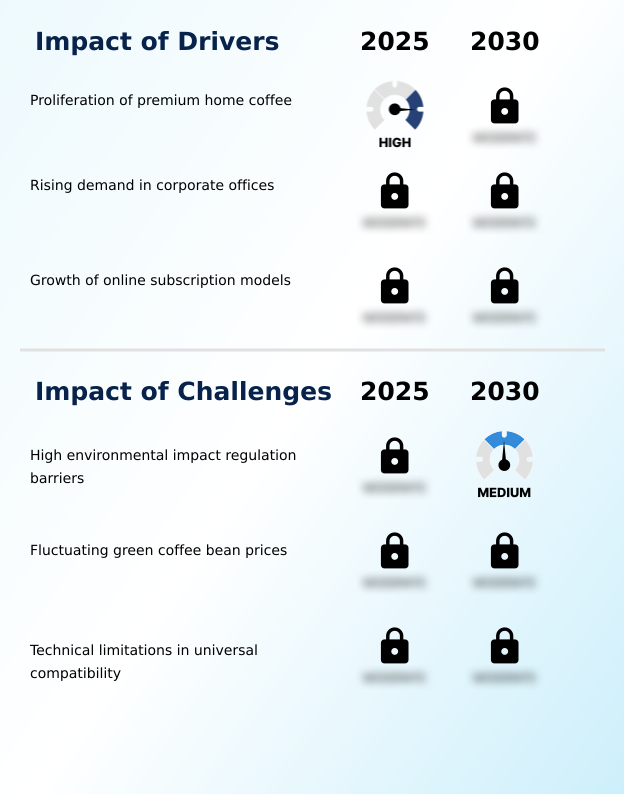
- The proliferation of premium coffee consumption in home environments serves as a key driver for market growth.
- Market growth is fundamentally driven by the consumer pursuit of a premium home coffee experience, blending convenience with quality.
- This trend is fueled by the technical ability of modern single-serve coffee systems to achieve barista-quality replication, a factor driving an 18% increase in household machine ownership in key urban centers.
- A significant 45% of coffee drinkers now prefer specialty grade beans, a demand met by single-origin capsules that offer unique flavor profiles.
- The proliferation of artisanal roaster capsules and private label compatible pods provides consumers with extensive choice, further stimulating demand.
- This shift toward high-quality, convenient options is complemented by the efficiency of e-commerce beverage sales and direct-to-consumer subscription models, making a wide array of products more accessible than ever.
What are the market trends shaping the Coffee Pods And Capsules Industry?
- A key market trend is the increasing adoption of sustainable packaging, with a significant shift toward compostable materials to address environmental concerns.
- Key market trends are centered on sustainability and functional enhancements, reshaping product development and consumer choice. The adoption of compostable polymers and other plant-based materials is accelerating, with some new formulations for paper pods designed to break down in industrial facilities in as little as 12 weeks.
- This push for a home compostable alternative is a direct response to consumer demand for sustainable packaging solutions. Simultaneously, the market is diversifying with functional coffee blends that incorporate heat-stable vitamins and nootropic additives, creating a new category of wellness-oriented products. This innovation in microencapsulation technology allows for the seamless integration of health benefits into the daily coffee ritual.
- These trends demonstrate how manufacturers are using material science and food technology to meet evolving consumer priorities for both environmental responsibility and personal well-being.
What challenges does the Coffee Pods And Capsules Industry face during its growth?
- Stringent environmental regulations addressing the high impact of packaging waste present a significant challenge to industry growth.
- The market faces significant hurdles from regulatory pressures and operational complexities, which threaten margins and market access. Stringent environmental legislation, particularly in Europe, has increased operational costs by up to 15% for companies transitioning to compliant, sustainable packaging due to inadequate waste management infrastructure. This creates a challenging environment for product lifecycle management.
- Concurrently, raw material price volatility remains a persistent issue, with the cost of key inputs like Arabica beans rising by 25% in a single year.
- Furthermore, the lack of a universal compatibility standard and the use of barcode recognition systems by OEMS create a fragmented market, forcing makers of third-party paper pods and capsules to navigate a complex landscape of intellectual property and technical requirements to ensure their products function correctly.
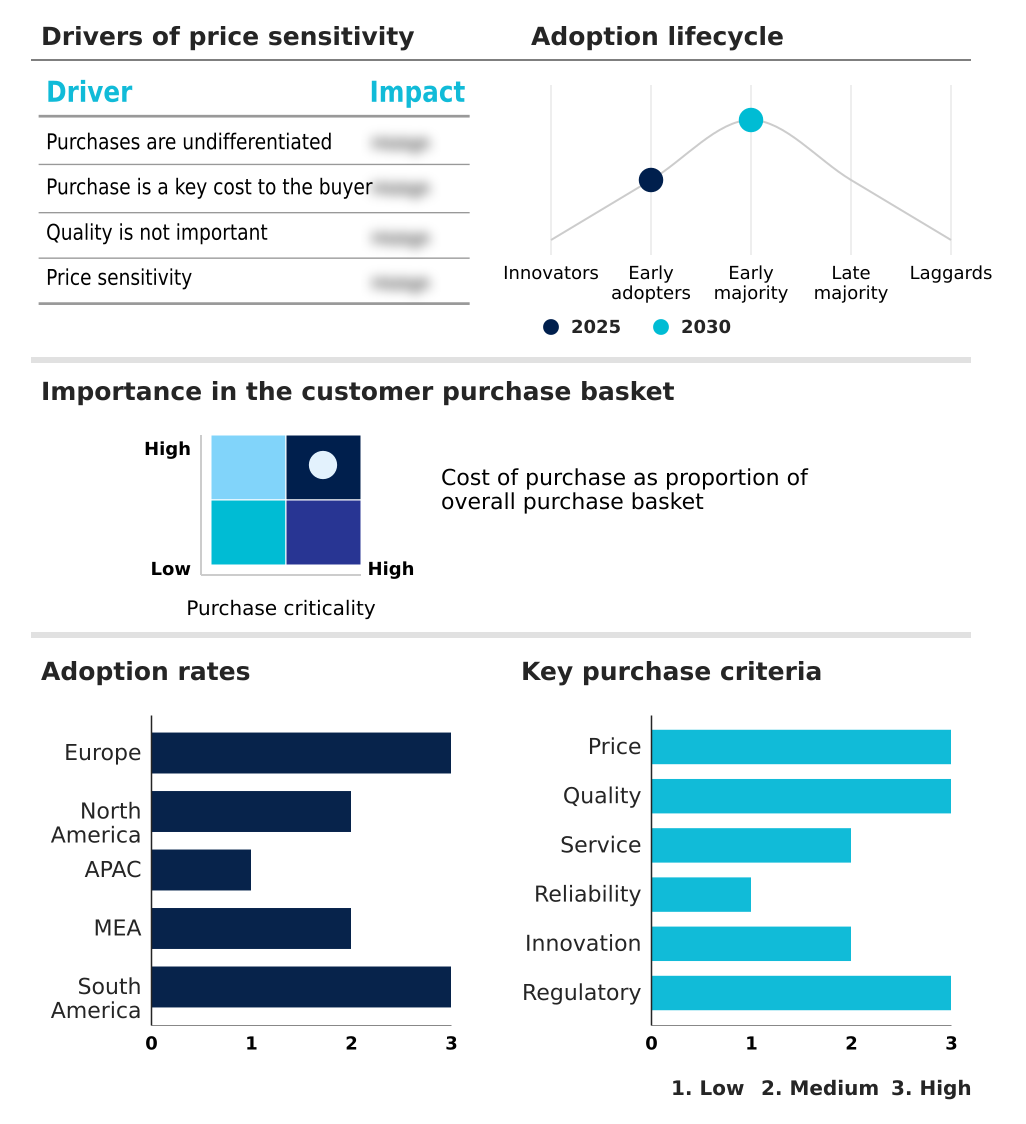
Exclusive Technavio Analysis on Customer Landscape
The coffee pods and capsules market forecasting report includes the adoption lifecycle of the market, covering from the innovator’s stage to the laggard’s stage. It focuses on adoption rates in different regions based on penetration. Furthermore, the coffee pods and capsules market report also includes key purchase criteria and drivers of price sensitivity to help companies evaluate and develop their market growth analysis strategies.
Customer Landscape of Coffee Pods And Capsules Industry
Competitive Landscape
Companies are implementing various strategies, such as strategic alliances, coffee pods and capsules market forecast, partnerships, mergers and acquisitions, geographical expansion, and product/service launches, to enhance their presence in the industry.
Alois Dallmayr KG - Offerings center on an integrated portfolio of premium Arabica blends, proprietary espresso machine systems, and a global network of branded coffee bars.
The industry research and growth report includes detailed analyses of the competitive landscape of the market and information about key companies, including:
- Alois Dallmayr KG
- Casa del Caffe Vergnano SpA
- Colonna Coffee Ltd.
- Delica AG
- Halo Coffee Ltd.
- illycaffe SpA
- JDE Peets NV
- Keurig Dr Pepper Inc.
- Kimbo SpA
- Koffiebranderij Peeze BV
- Luigi Lavazza SpA
- Massimo Zanetti Beverage Group
- Nestle SA
- Procaffe SpA
- Starbucks Corp.
- Strauss Coffee BV
- Tata Consumer Products Ltd.
- Tchibo GmbH
- The J.M. Smucker Co.
Qualitative and quantitative analysis of companies has been conducted to help clients understand the wider business environment as well as the strengths and weaknesses of key industry players. Data is qualitatively analyzed to categorize companies as pure play, category-focused, industry-focused, and diversified; it is quantitatively analyzed to categorize companies as dominant, leading, strong, tentative, and weak.
Recent Development and News in Coffee pods and capsules market
- In August 2024, Starbucks Corp. transitioned its entire retail capsule line in the North American market to a new high-density polyethylene format that is more widely accepted by municipal recycling facilities.
- In January 2025, Delica AG launched a new series of garden compostable coffee balls that utilize a thin seaweed-based protective layer instead of a traditional hard shell, representing a radical departure from conventional pod designs to eliminate secondary packaging waste entirely.
- In February 2025, Procaffe SpA secured a major contract to install its latest touchless capsule dispensers across a network of 500 corporate lounges in Europe, providing a sanitized and efficient coffee solution for business travelers.
- In April 2025, Nestle SA announced a significant expansion of its paper-based capsule pilot program across five new European countries, aiming to provide a high-barrier home compostable alternative to its traditional aluminum line.
Dive into Technavio’s robust research methodology, blending expert interviews, extensive data synthesis, and validated models for unparalleled Coffee Pods And Capsules Market insights. See full methodology.
| Market Scope | |
|---|---|
| Page number | 288 |
| Base year | 2025 |
| Historic period | 2020-2024 |
| Forecast period | 2026-2030 |
| Growth momentum & CAGR | Accelerate at a CAGR of 6.3% |
| Market growth 2026-2030 | USD 11979.9 million |
| Market structure | Fragmented |
| YoY growth 2025-2026(%) | 6.1% |
| Key countries | Germany, France, Italy, UK, Spain, The Netherlands, US, Canada, Mexico, China, Japan, Australia, South Korea, India, Thailand, UAE, Saudi Arabia, Turkey, South Africa, Egypt, Brazil, Argentina and Colombia |
| Competitive landscape | Leading Companies, Market Positioning of Companies, Competitive Strategies, and Industry Risks |
Research Analyst Overview
- The coffee pods and capsules market is an ecosystem driven by constant material science innovation and precise pod compatibility engineering. The core technology centers on high-pressure extraction within a compact single-serve format, demanding sophisticated brewing cycle integrity and an exceptional sensory profile.
- Key to market success is achieving perfect shelf life preservation and aromatic compound preservation through advanced techniques like hermetic sealing and the use of polyhydroxyalkanoates or cellulose-based fibers. As consumers demand higher quality, the focus sharpens on roast and grind profile optimization and water distribution discs to enhance extraction efficiency.
- The industry faces persistent raw material price volatility, with green bean costs increasing by 25% in a single year, compelling boardroom-level decisions on hedging strategies and sourcing diversification. This pressure, combined with the push for sustainability, fuels the development of compostable polymers and bio-based lidding film, reshaping production from sourcing to final packaging.
What are the Key Data Covered in this Coffee Pods And Capsules Market Research and Growth Report?
-
What is the expected growth of the Coffee Pods And Capsules Market between 2026 and 2030?
-
USD 11.98 billion, at a CAGR of 6.3%
-
-
What segmentation does the market report cover?
-
The report is segmented by Type (Coffee capsules, and Coffee pods), Product (Capsule and plastic cup-based coffee pods, and Foil and paper-wrapped coffee pods), Distribution Channel (Off-trade, and On-trade) and Geography (Europe, North America, APAC, Middle East and Africa, South America)
-
-
Which regions are analyzed in the report?
-
Europe, North America, APAC, Middle East and Africa and South America
-
-
What are the key growth drivers and market challenges?
-
Proliferation of premium home coffee, High environmental impact regulation barriers
-
-
Who are the major players in the Coffee Pods And Capsules Market?
-
Alois Dallmayr KG, Casa del Caffe Vergnano SpA, Colonna Coffee Ltd., Delica AG, Halo Coffee Ltd., illycaffe SpA, JDE Peets NV, Keurig Dr Pepper Inc., Kimbo SpA, Koffiebranderij Peeze BV, Luigi Lavazza SpA, Massimo Zanetti Beverage Group, Nestle SA, Procaffe SpA, Starbucks Corp., Strauss Coffee BV, Tata Consumer Products Ltd., Tchibo GmbH and The J.M. Smucker Co.
-
Market Research Insights
- The market's momentum is increasingly influenced by digital and B2B channels, reflecting shifts in consumer behavior and workplace amenities. E-commerce beverage sales now represent a significant portion of revenue, with online sales of specialty coffee pods growing over 20% in some segments, which far outpaces the growth in traditional off-trade retail channels.
- Concurrently, in the office coffee service (OCS) sector, a notable 62% of facility managers link premium beverage availability to enhanced employee satisfaction. This is accelerating the adoption of single-serve coffee systems in corporate environments. These systems are supported by a direct-to-consumer subscription model that personalizes offerings, leveraging smart brewing systems to create a seamless user experience.
- This dual focus on home convenience and workplace quality underscores a dynamic and expanding market landscape.
We can help! Our analysts can customize this coffee pods and capsules market research report to meet your requirements.
 RIA -
RIA - 
