Commercial And Military Parachute Market Analysis, Size, and Forecast 2026-2030: North America (US, Canada, and Mexico), Europe (Germany, UK, and France), APAC (China, India, and Japan), Middle East and Africa (Saudi Arabia, UAE, and South Africa), South America (Brazil, Argentina, and Colombia), and Rest of World (ROW)

Commercial And Military Parachute Market Analysis, Size, and Forecast 2026-2030:
North America (US, Canada, and Mexico), Europe (Germany, UK, and France), APAC (China, India, and Japan), Middle East and Africa (Saudi Arabia, UAE, and South Africa), South America (Brazil, Argentina, and Colombia), and Rest of World (ROW)

Published: May 2026 309 Pages SKU: IRTNTR45376

Market Overview at a Glance

$589.7 Mn
Market Opportunity
7.1%
CAGR 2025 - 2030
37.7%
North America Growth
$398 Mn
Round segment 2024

Commercial And Military Parachute Market Size 2026-2030

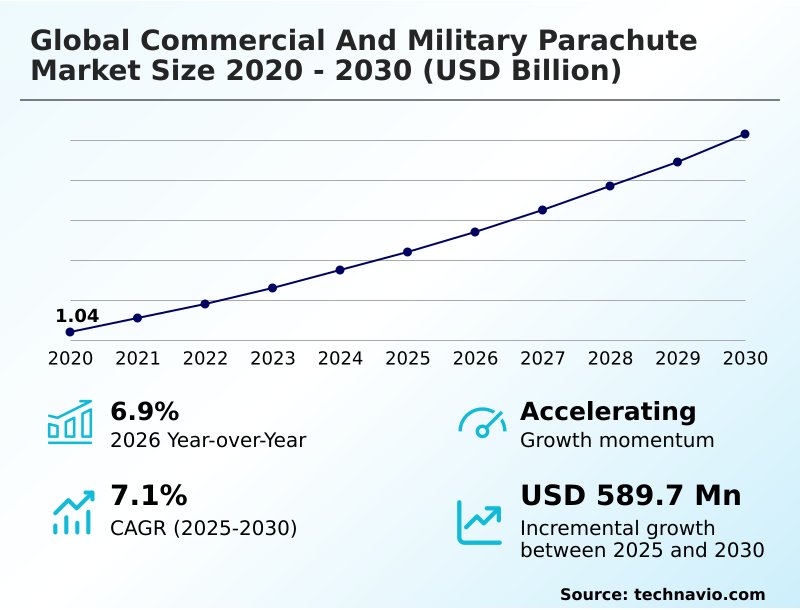
The commercial and military parachute market size is valued to increase by USD 589.7 million, at a CAGR of 7.1% from 2025 to 2030. Modernization of airborne tactical operations and defense procurement will drive the commercial and military parachute market.

Major Market Trends & Insights

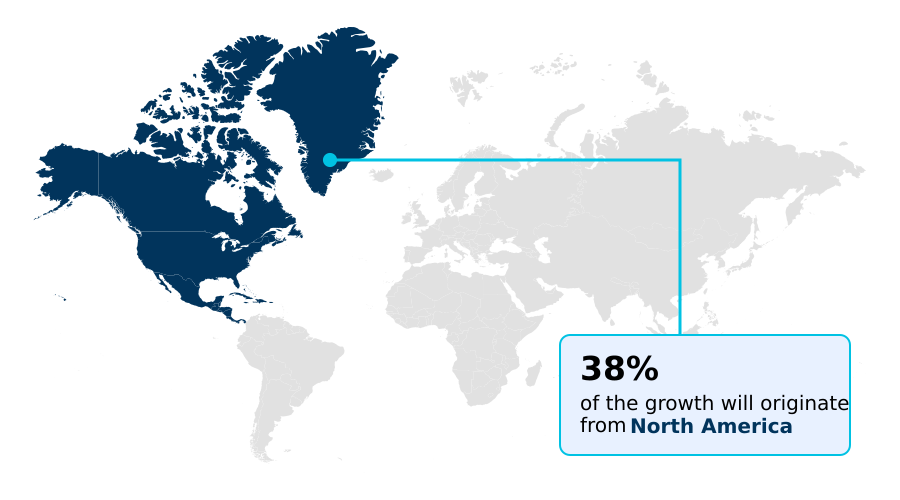
  • North America dominated the market and accounted for a 37.7% growth during the forecast period.
  • By Type - Round segment was valued at USD 398 million in 2024
  • By Material - Nylon segment accounted for the largest market revenue share in 2024

Market Size & Forecast

  • Market Opportunities: USD 990 million
  • Market Future Opportunities: USD 589.7 million
  • CAGR from 2025 to 2030 : 7.1%

Market Summary

  • The commercial and military parachute market is characterized by its dual-use nature, serving both defense logistics and a growing commercial sector. Military modernization programs are a primary catalyst, demanding advanced aerodynamic deceleration systems for personnel deployment and precise cargo delivery. This includes the development of steerable ram-air canopies and autonomous aerial delivery for complex tactical scenarios.
  • Commercially, the expansion of adventure sports and the advent of private space exploration create demand for high-performance parafoils and robust equipment recovery solutions. A key business application involves logistics firms using joint precision airdrop systems to deliver critical supplies to remote locations, improving delivery accuracy by over 90% and eliminating the need for ground infrastructure.
  • However, the industry navigates challenges in material science, with a constant need for high-tenacity textiles and ballistic recovery systems that balance performance with cost, ensuring reliability for every mission.

What will be the Size of the Commercial And Military Parachute Market during the forecast period?

Get Key Insights on Market Forecast (PDF) Request Free Sample

How is the Commercial And Military Parachute Market Segmented?

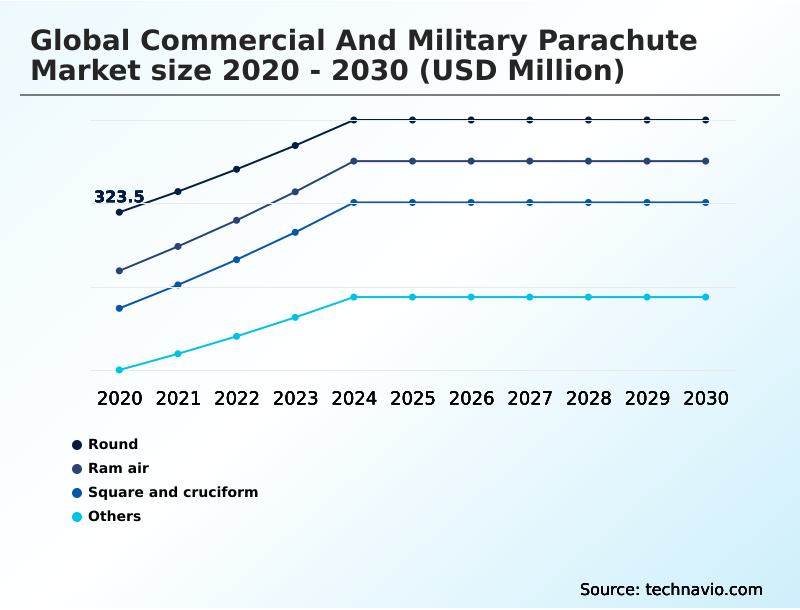
The commercial and military parachute industry research report provides comprehensive data (region-wise segment analysis), with forecasts and estimates in "USD million" for the period 2026-2030, as well as historical data from 2020-2024 for the following segments.

  • Type
    • Round
    • Ram air
    • Square and cruciform
    • Others
  • Material
    • Nylon
    • Kevlar and aramid blends
    • Polyester
    • Others
  • End-user
    • Defense forces
    • Recreational users
    • Emergency services and civil aviation
    • Others
  • Geography
    • North America
      • US
      • Canada
      • Mexico
    • Europe
      • Germany
      • UK
      • France
    • APAC
      • China
      • India
      • Japan
    • Middle East and Africa
      • Saudi Arabia
      • UAE
      • South Africa
    • South America
      • Brazil
      • Argentina
      • Colombia
    • Rest of World (ROW)

By Type Insights

The round segment is estimated to witness significant growth during the forecast period.

Market segmentation focuses on distinct applications, with round parachutes forming a foundational segment. These aerodynamic deceleration systems are critical for mass personnel deployment and certain cargo delivery missions where predictable vertical descent and atmospheric drag are paramount.

While advanced steerable ram-air canopies are used for precision tasks, round designs are valued for simplicity in equipment recovery. Innovations continue, with modern systems incorporating high-tenacity textiles and specialized coatings that improve deployment consistency by over 15% in sub-zero conditions.

The evolution of autonomous aerial delivery and ballistic recovery systems is reshaping the landscape, but the core function of round parachutes in large-scale operations, including those involving supersonic deceleration, remains integral to both commercial and military logistics strategies.

Request Free Sample

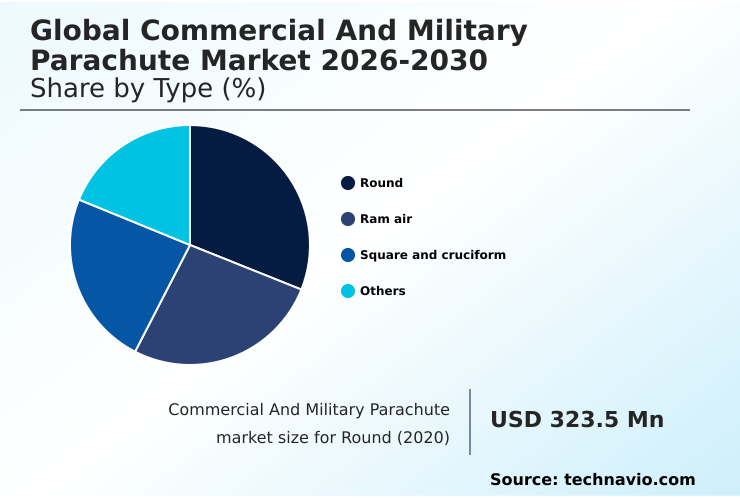
The Round segment was valued at USD 398 million in 2024 and showed a gradual increase during the forecast period.

Request Free Sample

Regional Analysis

North America is estimated to contribute 37.7% to the growth of the global market during the forecast period.Technavio’s analysts have elaborately explained the regional trends and drivers that shape the market during the forecast period.

See How Commercial And Military Parachute Market Demand is Rising in North America Request Free Sample

The global commercial and military parachute market exhibits distinct regional dynamics, with North America leading, capturing over 37% of opportunities due to significant defense spending and a mature private aerospace sector.

This region is a hub for developing technologies for whole-aircraft recovery and high-altitude high-opening missions. Europe follows, with a strong focus on regulatory compliance and the integration of parachute safety systems into urban air mobility platforms.

The APAC region is the fastest-growing, with modernization efforts in countries like China and India driving demand for tactical systems. This growth outpaces other regions by nearly 1%.

The use of advanced materials like hybrid polymer fabric and carbon-fiber reinforcements is becoming a global standard, driven by the need for enhanced heavy-lift capabilities and improved performance in high-altitude low-opening scenarios, from smokejumper units to payload fairing recovery, sometimes involving retrorocket technology.
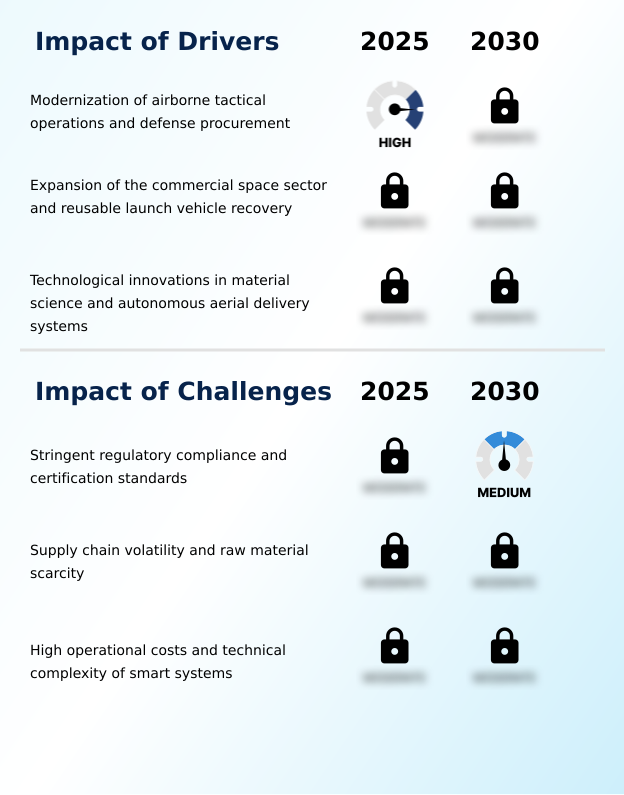
Market Dynamics

Our researchers analyzed the data with 2025 as the base year, along with the key drivers, trends, and challenges. A holistic analysis of drivers will help companies refine their marketing strategies to gain a competitive advantage.

  • The evolution of parachute technology is marked by increasing specialization to meet diverse operational demands. While traditional systems remain relevant, the market is shifting toward sophisticated solutions like parachute systems for reusable boosters and multi-stage parachutes for space capsules, which are critical for the commercial space industry's cost-reduction goals.
  • Militaries are adopting autonomous cargo parachute guidance units and steerable parafoils for special operations to enhance mission precision. This drive for accuracy is also seen in GPS-guided precision aerial delivery, which has reduced landing zone dispersion by over 75% compared to unguided drops.
  • Material science is central to this progress, with high-tenacity nylon for military parachutes and aramid fiber parachute heat resistance being key research areas. For aviation, ballistic recovery for light aircraft and emergency pilot ejection parachute systems have become standard safety features.
  • The burgeoning drone and urban air mobility sectors are creating new niches, driving demand for lightweight parachutes for drone recovery and whole-aircraft recovery for urban mobility. Advanced materials for tactical parachutes, heavy-lift cargo parachute design, and low porosity fabrics for skydiving continue to be areas of intense innovation.
  • The application spectrum is also broadening, including parachute systems for humanitarian aid, tandem parachute systems for tourism, and parachute technology for satellite recovery, all supported by automated parachute deployment sensors.

What are the key market drivers leading to the rise in the adoption of Commercial And Military Parachute Industry?

  • The modernization of airborne tactical operations and an increase in defense procurement are key drivers for market growth.

  • Market growth is primarily propelled by military modernization and the expansion of the commercial space industry. Defense forces are upgrading to advanced systems that support complex asymmetrical warfare tactics, necessitating high-performance gear for high-altitude deployment.
  • The integration of joint precision airdrop systems, which can automate course corrections during descent, has improved precision logistics by reducing supply delivery errors by over 80%.
  • In the commercial sector, the focus on reusable hardware has created a significant demand for robust multi-stage deployment mechanisms capable of mid-air recovery and facilitating de-orbiting systems.
  • These innovations, from advanced canopy piloting technologies to automatic activation devices with refined canopy porosity control, are not only enhancing safety but are also reducing operational costs for space missions by more than 40% through asset recovery.

What are the market trends shaping the Commercial And Military Parachute Industry?

  • The integration of autonomous navigation and GPS-guided systems is a key trend shaping the market. This technology enables precision delivery, enhancing operational efficiency and safety.

  • Key market trends are centered on technological integration and material innovation. The adoption of autonomous systems is transforming aerial resupply operations, with GPS-guided parafoils achieving landing accuracies within a 10-meter radius, a 95% improvement over unguided drops.
  • In parallel, the push for sustainability is influencing material selection, with advanced ripstop nylon and aramid fibers now being developed from recycled sources that retain up to 99% of virgin material strength. This supports airborne infantry modernization while meeting environmental goals.
  • The commercial sector is driving trends in urban air mobility safety, where specialized drogue parachutes and cruciform parachute designs are being adapted for low-altitude, low-speed deployments. This expansion into new applications, including recovery for reusable launch vehicles, highlights the industry's evolution toward more intelligent and versatile solutions that ensure performance and thermal stress resistance.

What challenges does the Commercial And Military Parachute Industry face during its growth?

  • Adherence to stringent regulatory compliance and certification standards presents a significant challenge to industry growth.

  • The market faces significant challenges related to regulatory hurdles, supply chain vulnerabilities, and the high cost of advanced technologies. Stringent certification processes for life-saving equipment like tactical parachute systems can extend product development timelines by up to 24 months, creating high barriers to entry.
  • The supply chain for specialized materials, including those for low-level parachute systems and annular parachutes, is highly concentrated, making it susceptible to disruption. This dependency impacts over 60% of manufacturers. Furthermore, the integration of sophisticated electronics for systems used in powered paragliding and the creation of advanced ring-slot parachutes require significant R&D investment.
  • Adherence to circular economy principles is also complicated by the specialized nature of nanomaterial integration and graphene-infused fibers. These factors challenge manufacturers to balance innovation with affordability, especially for sectors like recreational tandem jumping and formation skydiving.

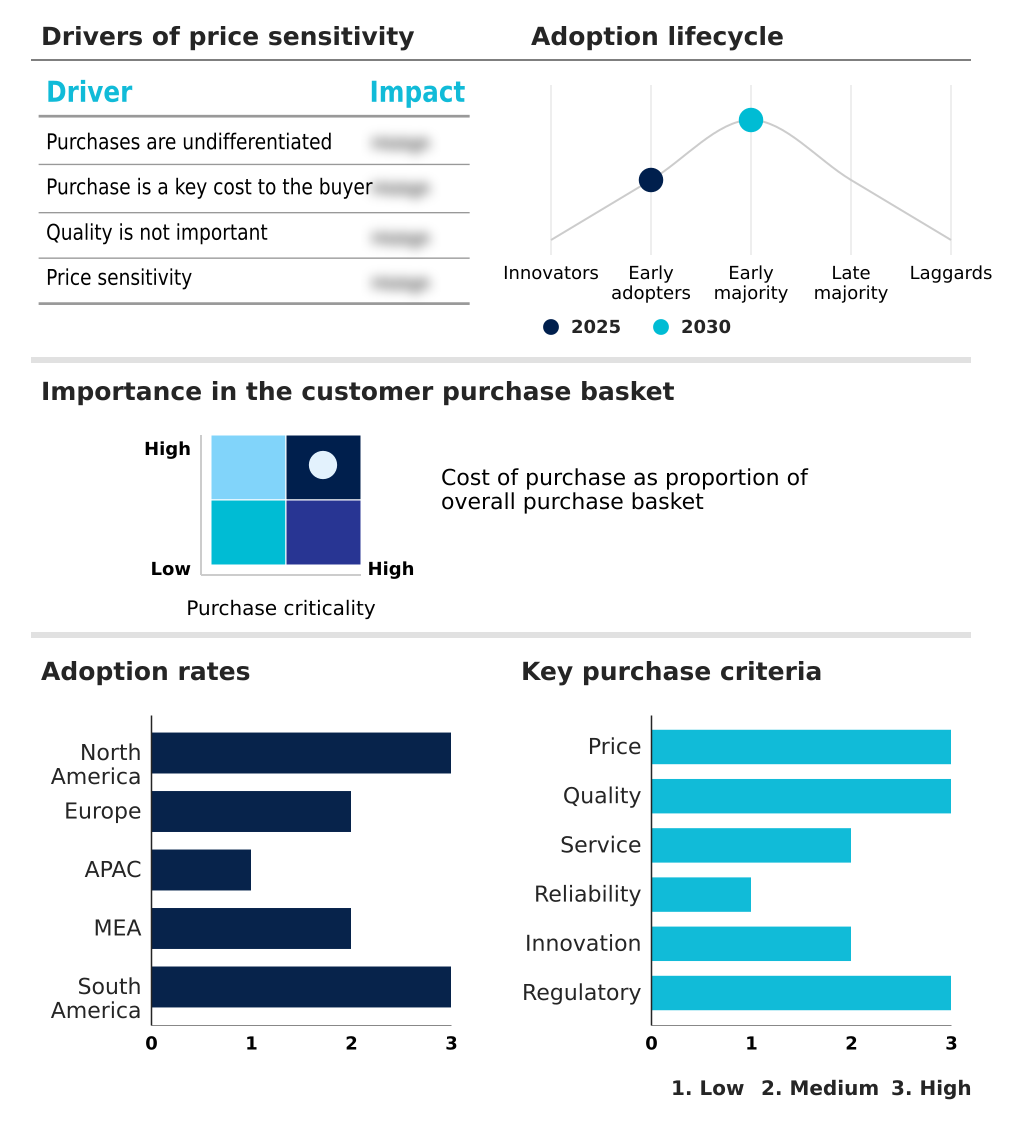
Exclusive Technavio Analysis on Customer Landscape

The commercial and military parachute market forecasting report includes the adoption lifecycle of the market, covering from the innovator’s stage to the laggard’s stage. It focuses on adoption rates in different regions based on penetration. Furthermore, the commercial and military parachute market report also includes key purchase criteria and drivers of price sensitivity to help companies evaluate and develop their market growth analysis strategies.

Customer Landscape of Commercial And Military Parachute Industry

Competitive Landscape

Companies are implementing various strategies, such as strategic alliances, commercial and military parachute market forecast, partnerships, mergers and acquisitions, geographical expansion, and product/service launches, to enhance their presence in the industry.

Aerodyne Research LLC - Key offerings focus on specialized canopy and complete parachute systems, serving both commercial sport and military applications with advanced, safety-certified aerodynamic designs.

The industry research and growth report includes detailed analyses of the competitive landscape of the market and information about key companies, including:

  • Aerodyne Research LLC
  • Airborne Systems
  • Airtec GmbH and Co.KG.
  • Atair Aerospace.
  • Ballistic Recovery SystemsA Inc.
  • Butler Parachute Systems Inc.
  • CIMSA Ingenieria de Sistemas SA.
  • Complete Parachute Solutions
  • FXC Corp.
  • Magam Safety Ltd.
  • Mills Manufacturing Corp.
  • NZ Aerosports.
  • Parachute Systems.
  • Performance Designs Inc.
  • Precision Aerodynamics Inc.
  • Rigging Innovations Inc.
  • Safran SA
  • Strong Enterprises.
  • Switlik Parachute Co. Inc.
  • United Parachute Technologies LLC.

Qualitative and quantitative analysis of companies has been conducted to help clients understand the wider business environment as well as the strengths and weaknesses of key industry players. Data is qualitatively analyzed to categorize companies as pure play, category-focused, industry-focused, and diversified; it is quantitatively analyzed to categorize companies as dominant, leading, strong, tentative, and weak.

Recent Development and News in Commercial and military parachute market

  • In October 2025, a major defense technology contractor in North America conducted a successful demonstration of a multi-payload autonomous steering unit capable of landing heavy equipment within ten meters of a pre-defined target.
  • In November 2025, a leading technical textile manufacturer based in Germany unveiled a new hybrid polymer fabric that integrates carbon-fiber reinforcements to provide unprecedented tensile strength for heavy-lift cargo parachutes.
  • In May 2025, a leading Japanese textile engineering firm announced the development of a fully recyclable high-tenacity nylon 6,6 fabric that retains the exact structural integrity of virgin fibers after multiple processing cycles.
  • In March 2025, a prominent aerospace manufacturer based in California successfully completed the high-velocity testing of a new multi-stage parachute system designed for the recovery of commercial orbital capsules.

Dive into Technavio’s robust research methodology, blending expert interviews, extensive data synthesis, and validated models for unparalleled Commercial And Military Parachute Market insights. See full methodology.

Market Scope
Page number 309
Base year 2025
Historic period 2020-2024
Forecast period 2026-2030
Growth momentum & CAGR Accelerate at a CAGR of 7.1%
Market growth 2026-2030 USD 589.7 million
Market structure Fragmented
YoY growth 2025-2026(%) 6.9%
Key countries US, Canada, Mexico, Germany, UK, France, Italy, Spain, Russia, China, India, Japan, South Korea, Australia, Indonesia, Saudi Arabia, UAE, South Africa, Israel, Turkey, Brazil, Argentina and Colombia
Competitive landscape Leading Companies, Market Positioning of Companies, Competitive Strategies, and Industry Risks

Request Free Sample

Research Analyst Overview

  • The commercial and military parachute market is defined by the convergence of advanced materials and intelligent systems. The industry is moving beyond simple aerodynamic deceleration systems to integrated platforms featuring steerable ram-air canopies and autonomous aerial delivery. This technological shift is evident in the development of high-tenacity textiles, specialized parafoils for canopy piloting, and sophisticated ballistic recovery systems.
  • For executive decision-making, a critical strategic choice involves balancing investment in hardware, such as drogue parachutes and cruciform parachutes, against software for joint precision airdrop systems. Modernization is driven by the need for enhanced high-altitude deployment capabilities, supported by multi-stage deployment mechanisms and automatic activation devices, which have reduced critical training errors by over 90%.
  • The market also includes specialized equipment like annular parachutes, tactical parachute systems, and ring-slot parachutes for niche applications, including powered paragliding and low-level parachute systems. The ongoing innovation in whole-aircraft recovery and hybrid polymer fabric, including carbon-fiber reinforcements, continues to push performance boundaries.

What are the Key Data Covered in this Commercial And Military Parachute Market Research and Growth Report?

  • What is the expected growth of the Commercial And Military Parachute Market between 2026 and 2030?

    • USD 589.7 million, at a CAGR of 7.1%

  • What segmentation does the market report cover?

    • The report is segmented by Type (Round, Ram air, Square and cruciform, and Others), Material (Nylon, Kevlar and aramid blends, Polyester, and Others), End-user (Defense forces, Recreational users, Emergency services and civil aviation, and Others) and Geography (North America, Europe, APAC, Middle East and Africa, South America)

  • Which regions are analyzed in the report?

    • North America, Europe, APAC, Middle East and Africa and South America

  • What are the key growth drivers and market challenges?

    • Modernization of airborne tactical operations and defense procurement , Stringent regulatory compliance and certification standards

  • Who are the major players in the Commercial And Military Parachute Market?

    • Aerodyne Research LLC, Airborne Systems, Airtec GmbH and Co.KG., Atair Aerospace., Ballistic Recovery SystemsA Inc., Butler Parachute Systems Inc., CIMSA Ingenieria de Sistemas SA., Complete Parachute Solutions, FXC Corp., Magam Safety Ltd., Mills Manufacturing Corp., NZ Aerosports., Parachute Systems., Performance Designs Inc., Precision Aerodynamics Inc., Rigging Innovations Inc., Safran SA, Strong Enterprises., Switlik Parachute Co. Inc. and United Parachute Technologies LLC.

Market Research Insights

  • The market is driven by technological advancements in precision logistics and new safety applications. The adoption of autonomous systems has improved aerial resupply operations, reducing cargo dispersion by over 60% in contested environments.
  • Concurrently, the emerging need for urban air mobility safety is creating demand for novel recovery solutions, where development costs are 30% higher than traditional systems but are deemed essential for regulatory approval. Innovations in materials, particularly for reusable launch vehicles, are also critical, with new textiles showing a 25% improvement in thermal stress resistance.
  • This convergence of military modernization, commercial expansion into space, and new civilian safety requirements defines the industry's dynamic trajectory, pushing continuous innovation in equipment recovery and personnel deployment.

We can help! Our analysts can customize this commercial and military parachute market research report to meet your requirements.

Get in touch

1. Executive Summary

1.1 Market overview

Executive Summary - Chart on Market Overview
Executive Summary - Data Table on Market Overview
Executive Summary - Chart on Global Market Characteristics
Executive Summary - Chart on Market by Geography
Executive Summary - Chart on Market Segmentation by Type
Executive Summary - Chart on Market Segmentation by Material
Executive Summary - Chart on Market Segmentation by End-user
Executive Summary - Chart on Incremental Growth
Executive Summary - Data Table on Incremental Growth
Executive Summary - Chart on Company Market Positioning

2. Technavio Analysis

2.1 Analysis of price sensitivity, lifecycle, customer purchase basket, adoption rates, and purchase criteria

2.2 Criticality of inputs and Factors of differentiation

Chart on Overview on criticality of inputs and factors of differentiation

2.3 Factors of disruption

Chart on Overview on factors of disruption

2.4 Impact of drivers and challenges

Chart on Impact of drivers and challenges in 2025 and 2030

3. Market Landscape

3.1 Market ecosystem

Chart on Parent Market
Data Table on - Parent Market

3.2 Market characteristics

Chart on Market characteristics analysis

3.3 Value chain analysis

Chart on Value chain analysis

4. Market Sizing

4.1 Market definition

Data Table on Offerings of companies included in the market definition

4.2 Market segment analysis

Market segments

4.3 Market size 2025

4.4 Market outlook: Forecast for 2025-2030

Chart on Global - Market size and forecast 2025-2030 ($ million)
Data Table on Global - Market size and forecast 2025-2030 ($ million)
Chart on Global Market: Year-over-year growth 2025-2030 (%)
Data Table on Global Market: Year-over-year growth 2025-2030 (%)

5. Historic Market Size

5.1 Global Commercial And Military Parachute Market 2020 - 2024

Historic Market Size - Data Table on Global Commercial And Military Parachute Market 2020 - 2024 ($ million)

5.2 Type segment analysis 2020 - 2024

Historic Market Size - Type Segment 2020 - 2024 ($ million)

5.3 Material segment analysis 2020 - 2024

Historic Market Size - Material Segment 2020 - 2024 ($ million)

5.4 End-user segment analysis 2020 - 2024

Historic Market Size - End-user Segment 2020 - 2024 ($ million)

5.5 Geography segment analysis 2020 - 2024

Historic Market Size - Geography Segment 2020 - 2024 ($ million)

5.6 Country segment analysis 2020 - 2024

Historic Market Size - Country Segment 2020 - 2024 ($ million)

6. Qualitative Analysis

6.1 Impact of AI on Global Commercial and Military Parachute Market

6.2 Impact of geopolitical conflicts on Global Commercial and Military Parachute Market

7. Five Forces Analysis

7.1 Five forces summary

Five forces analysis - Comparison between 2025 and 2030

7.2 Bargaining power of buyers

Bargaining power of buyers - Impact of key factors 2025 and 2030

7.3 Bargaining power of suppliers

Bargaining power of suppliers - Impact of key factors in 2025 and 2030

7.4 Threat of new entrants

Threat of new entrants - Impact of key factors in 2025 and 2030

7.5 Threat of substitutes

Threat of substitutes - Impact of key factors in 2025 and 2030

7.6 Threat of rivalry

Threat of rivalry - Impact of key factors in 2025 and 2030

7.7 Market condition

Chart on Market condition - Five forces 2025 and 2030

8. Market Segmentation by Type

8.1 Market segments

Chart on Type - Market share 2025-2030 (%)
Data Table on Type - Market share 2025-2030 (%)

8.2 Comparison by Type

Chart on Comparison by Type
Data Table on Comparison by Type

8.3 Round - Market size and forecast 2025-2030

Chart on Round - Market size and forecast 2025-2030 ($ million)
Data Table on Round - Market size and forecast 2025-2030 ($ million)
Chart on Round - Year-over-year growth 2025-2030 (%)
Data Table on Round - Year-over-year growth 2025-2030 (%)

8.4 Ram air - Market size and forecast 2025-2030

Chart on Ram air - Market size and forecast 2025-2030 ($ million)
Data Table on Ram air - Market size and forecast 2025-2030 ($ million)
Chart on Ram air - Year-over-year growth 2025-2030 (%)
Data Table on Ram air - Year-over-year growth 2025-2030 (%)

8.5 Square and cruciform - Market size and forecast 2025-2030

Chart on Square and cruciform - Market size and forecast 2025-2030 ($ million)
Data Table on Square and cruciform - Market size and forecast 2025-2030 ($ million)
Chart on Square and cruciform - Year-over-year growth 2025-2030 (%)
Data Table on Square and cruciform - Year-over-year growth 2025-2030 (%)

8.6 Others - Market size and forecast 2025-2030

Chart on Others - Market size and forecast 2025-2030 ($ million)
Data Table on Others - Market size and forecast 2025-2030 ($ million)
Chart on Others - Year-over-year growth 2025-2030 (%)
Data Table on Others - Year-over-year growth 2025-2030 (%)

8.7 Market opportunity by Type

Market opportunity by Type ($ million)
Data Table on Market opportunity by Type ($ million)

9. Market Segmentation by Material

9.1 Market segments

Chart on Material - Market share 2025-2030 (%)
Data Table on Material - Market share 2025-2030 (%)

9.2 Comparison by Material

Chart on Comparison by Material
Data Table on Comparison by Material

9.3 Nylon - Market size and forecast 2025-2030

Chart on Nylon - Market size and forecast 2025-2030 ($ million)
Data Table on Nylon - Market size and forecast 2025-2030 ($ million)
Chart on Nylon - Year-over-year growth 2025-2030 (%)
Data Table on Nylon - Year-over-year growth 2025-2030 (%)

9.4 Kevlar and aramid blends - Market size and forecast 2025-2030

Chart on Kevlar and aramid blends - Market size and forecast 2025-2030 ($ million)
Data Table on Kevlar and aramid blends - Market size and forecast 2025-2030 ($ million)
Chart on Kevlar and aramid blends - Year-over-year growth 2025-2030 (%)
Data Table on Kevlar and aramid blends - Year-over-year growth 2025-2030 (%)

9.5 Polyester - Market size and forecast 2025-2030

Chart on Polyester - Market size and forecast 2025-2030 ($ million)
Data Table on Polyester - Market size and forecast 2025-2030 ($ million)
Chart on Polyester - Year-over-year growth 2025-2030 (%)
Data Table on Polyester - Year-over-year growth 2025-2030 (%)

9.6 Others - Market size and forecast 2025-2030

Chart on Others - Market size and forecast 2025-2030 ($ million)
Data Table on Others - Market size and forecast 2025-2030 ($ million)
Chart on Others - Year-over-year growth 2025-2030 (%)
Data Table on Others - Year-over-year growth 2025-2030 (%)

9.7 Market opportunity by Material

Market opportunity by Material ($ million)
Data Table on Market opportunity by Material ($ million)

10. Market Segmentation by End-user

10.1 Market segments

Chart on End-user - Market share 2025-2030 (%)
Data Table on End-user - Market share 2025-2030 (%)

10.2 Comparison by End-user

Chart on Comparison by End-user
Data Table on Comparison by End-user

10.3 Defense forces - Market size and forecast 2025-2030

Chart on Defense forces - Market size and forecast 2025-2030 ($ million)
Data Table on Defense forces - Market size and forecast 2025-2030 ($ million)
Chart on Defense forces - Year-over-year growth 2025-2030 (%)
Data Table on Defense forces - Year-over-year growth 2025-2030 (%)

10.4 Recreational users - Market size and forecast 2025-2030

Chart on Recreational users - Market size and forecast 2025-2030 ($ million)
Data Table on Recreational users - Market size and forecast 2025-2030 ($ million)
Chart on Recreational users - Year-over-year growth 2025-2030 (%)
Data Table on Recreational users - Year-over-year growth 2025-2030 (%)

10.5 Emergency services and civil aviation - Market size and forecast 2025-2030

Chart on Emergency services and civil aviation - Market size and forecast 2025-2030 ($ million)
Data Table on Emergency services and civil aviation - Market size and forecast 2025-2030 ($ million)
Chart on Emergency services and civil aviation - Year-over-year growth 2025-2030 (%)
Data Table on Emergency services and civil aviation - Year-over-year growth 2025-2030 (%)

10.6 Others - Market size and forecast 2025-2030

Chart on Others - Market size and forecast 2025-2030 ($ million)
Data Table on Others - Market size and forecast 2025-2030 ($ million)
Chart on Others - Year-over-year growth 2025-2030 (%)
Data Table on Others - Year-over-year growth 2025-2030 (%)

10.7 Market opportunity by End-user

Market opportunity by End-user ($ million)
Data Table on Market opportunity by End-user ($ million)

11. Customer Landscape

11.1 Customer landscape overview

Analysis of price sensitivity, lifecycle, customer purchase basket, adoption rates, and purchase criteria

12. Geographic Landscape

12.1 Geographic segmentation

Chart on Market share by geography 2025-2030 (%)
Data Table on Market share by geography 2025-2030 (%)

12.2 Geographic comparison

Chart on Geographic comparison
Data Table on Geographic comparison

12.3 North America - Market size and forecast 2025-2030

Chart on North America - Market size and forecast 2025-2030 ($ million)
Data Table on North America - Market size and forecast 2025-2030 ($ million)
Chart on North America - Year-over-year growth 2025-2030 (%)
Data Table on North America - Year-over-year growth 2025-2030 (%)
Chart on Regional Comparison - North America
Data Table on Regional Comparison - North America

12.3.1 US - Market size and forecast 2025-2030

Chart on US - Market size and forecast 2025-2030 ($ million)
Data Table on US - Market size and forecast 2025-2030 ($ million)
Chart on US - Year-over-year growth 2025-2030 (%)
Data Table on US - Year-over-year growth 2025-2030 (%)

12.3.2 Canada - Market size and forecast 2025-2030

Chart on Canada - Market size and forecast 2025-2030 ($ million)
Data Table on Canada - Market size and forecast 2025-2030 ($ million)
Chart on Canada - Year-over-year growth 2025-2030 (%)
Data Table on Canada - Year-over-year growth 2025-2030 (%)

12.3.3 Mexico - Market size and forecast 2025-2030

Chart on Mexico - Market size and forecast 2025-2030 ($ million)
Data Table on Mexico - Market size and forecast 2025-2030 ($ million)
Chart on Mexico - Year-over-year growth 2025-2030 (%)
Data Table on Mexico - Year-over-year growth 2025-2030 (%)

12.4 Europe - Market size and forecast 2025-2030

Chart on Europe - Market size and forecast 2025-2030 ($ million)
Data Table on Europe - Market size and forecast 2025-2030 ($ million)
Chart on Europe - Year-over-year growth 2025-2030 (%)
Data Table on Europe - Year-over-year growth 2025-2030 (%)
Chart on Regional Comparison - Europe
Data Table on Regional Comparison - Europe

12.4.1 Germany - Market size and forecast 2025-2030

Chart on Germany - Market size and forecast 2025-2030 ($ million)
Data Table on Germany - Market size and forecast 2025-2030 ($ million)
Chart on Germany - Year-over-year growth 2025-2030 (%)
Data Table on Germany - Year-over-year growth 2025-2030 (%)

12.4.2 UK - Market size and forecast 2025-2030

Chart on UK - Market size and forecast 2025-2030 ($ million)
Data Table on UK - Market size and forecast 2025-2030 ($ million)
Chart on UK - Year-over-year growth 2025-2030 (%)
Data Table on UK - Year-over-year growth 2025-2030 (%)

12.4.3 France - Market size and forecast 2025-2030

Chart on France - Market size and forecast 2025-2030 ($ million)
Data Table on France - Market size and forecast 2025-2030 ($ million)
Chart on France - Year-over-year growth 2025-2030 (%)
Data Table on France - Year-over-year growth 2025-2030 (%)

12.4.4 Italy - Market size and forecast 2025-2030

Chart on Italy - Market size and forecast 2025-2030 ($ million)
Data Table on Italy - Market size and forecast 2025-2030 ($ million)
Chart on Italy - Year-over-year growth 2025-2030 (%)
Data Table on Italy - Year-over-year growth 2025-2030 (%)

12.4.5 Spain - Market size and forecast 2025-2030

Chart on Spain - Market size and forecast 2025-2030 ($ million)
Data Table on Spain - Market size and forecast 2025-2030 ($ million)
Chart on Spain - Year-over-year growth 2025-2030 (%)
Data Table on Spain - Year-over-year growth 2025-2030 (%)

12.4.6 Russia - Market size and forecast 2025-2030

Chart on Russia - Market size and forecast 2025-2030 ($ million)
Data Table on Russia - Market size and forecast 2025-2030 ($ million)
Chart on Russia - Year-over-year growth 2025-2030 (%)
Data Table on Russia - Year-over-year growth 2025-2030 (%)

12.5 APAC - Market size and forecast 2025-2030

Chart on APAC - Market size and forecast 2025-2030 ($ million)
Data Table on APAC - Market size and forecast 2025-2030 ($ million)
Chart on APAC - Year-over-year growth 2025-2030 (%)
Data Table on APAC - Year-over-year growth 2025-2030 (%)
Chart on Regional Comparison - APAC
Data Table on Regional Comparison - APAC

12.5.1 China - Market size and forecast 2025-2030

Chart on China - Market size and forecast 2025-2030 ($ million)
Data Table on China - Market size and forecast 2025-2030 ($ million)
Chart on China - Year-over-year growth 2025-2030 (%)
Data Table on China - Year-over-year growth 2025-2030 (%)

12.5.2 India - Market size and forecast 2025-2030

Chart on India - Market size and forecast 2025-2030 ($ million)
Data Table on India - Market size and forecast 2025-2030 ($ million)
Chart on India - Year-over-year growth 2025-2030 (%)
Data Table on India - Year-over-year growth 2025-2030 (%)

12.5.3 Japan - Market size and forecast 2025-2030

Chart on Japan - Market size and forecast 2025-2030 ($ million)
Data Table on Japan - Market size and forecast 2025-2030 ($ million)
Chart on Japan - Year-over-year growth 2025-2030 (%)
Data Table on Japan - Year-over-year growth 2025-2030 (%)

12.5.4 South Korea - Market size and forecast 2025-2030

Chart on South Korea - Market size and forecast 2025-2030 ($ million)
Data Table on South Korea - Market size and forecast 2025-2030 ($ million)
Chart on South Korea - Year-over-year growth 2025-2030 (%)
Data Table on South Korea - Year-over-year growth 2025-2030 (%)

12.5.5 Australia - Market size and forecast 2025-2030

Chart on Australia - Market size and forecast 2025-2030 ($ million)
Data Table on Australia - Market size and forecast 2025-2030 ($ million)
Chart on Australia - Year-over-year growth 2025-2030 (%)
Data Table on Australia - Year-over-year growth 2025-2030 (%)

12.5.6 Indonesia - Market size and forecast 2025-2030

Chart on Indonesia - Market size and forecast 2025-2030 ($ million)
Data Table on Indonesia - Market size and forecast 2025-2030 ($ million)
Chart on Indonesia - Year-over-year growth 2025-2030 (%)
Data Table on Indonesia - Year-over-year growth 2025-2030 (%)

12.6 Middle East and Africa - Market size and forecast 2025-2030

Chart on Middle East and Africa - Market size and forecast 2025-2030 ($ million)
Data Table on Middle East and Africa - Market size and forecast 2025-2030 ($ million)
Chart on Middle East and Africa - Year-over-year growth 2025-2030 (%)
Data Table on Middle East and Africa - Year-over-year growth 2025-2030 (%)
Chart on Regional Comparison - Middle East and Africa
Data Table on Regional Comparison - Middle East and Africa

12.6.1 Saudi Arabia - Market size and forecast 2025-2030

Chart on Saudi Arabia - Market size and forecast 2025-2030 ($ million)
Data Table on Saudi Arabia - Market size and forecast 2025-2030 ($ million)
Chart on Saudi Arabia - Year-over-year growth 2025-2030 (%)
Data Table on Saudi Arabia - Year-over-year growth 2025-2030 (%)

12.6.2 UAE - Market size and forecast 2025-2030

Chart on UAE - Market size and forecast 2025-2030 ($ million)
Data Table on UAE - Market size and forecast 2025-2030 ($ million)
Chart on UAE - Year-over-year growth 2025-2030 (%)
Data Table on UAE - Year-over-year growth 2025-2030 (%)

12.6.3 South Africa - Market size and forecast 2025-2030

Chart on South Africa - Market size and forecast 2025-2030 ($ million)
Data Table on South Africa - Market size and forecast 2025-2030 ($ million)
Chart on South Africa - Year-over-year growth 2025-2030 (%)
Data Table on South Africa - Year-over-year growth 2025-2030 (%)

12.6.4 Israel - Market size and forecast 2025-2030

Chart on Israel - Market size and forecast 2025-2030 ($ million)
Data Table on Israel - Market size and forecast 2025-2030 ($ million)
Chart on Israel - Year-over-year growth 2025-2030 (%)
Data Table on Israel - Year-over-year growth 2025-2030 (%)

12.6.5 Turkey - Market size and forecast 2025-2030

Chart on Turkey - Market size and forecast 2025-2030 ($ million)
Data Table on Turkey - Market size and forecast 2025-2030 ($ million)
Chart on Turkey - Year-over-year growth 2025-2030 (%)
Data Table on Turkey - Year-over-year growth 2025-2030 (%)

12.7 South America - Market size and forecast 2025-2030

Chart on South America - Market size and forecast 2025-2030 ($ million)
Data Table on South America - Market size and forecast 2025-2030 ($ million)
Chart on South America - Year-over-year growth 2025-2030 (%)
Data Table on South America - Year-over-year growth 2025-2030 (%)
Chart on Regional Comparison - South America
Data Table on Regional Comparison - South America

12.7.1 Brazil - Market size and forecast 2025-2030

Chart on Brazil - Market size and forecast 2025-2030 ($ million)
Data Table on Brazil - Market size and forecast 2025-2030 ($ million)
Chart on Brazil - Year-over-year growth 2025-2030 (%)
Data Table on Brazil - Year-over-year growth 2025-2030 (%)

12.7.2 Argentina - Market size and forecast 2025-2030

Chart on Argentina - Market size and forecast 2025-2030 ($ million)
Data Table on Argentina - Market size and forecast 2025-2030 ($ million)
Chart on Argentina - Year-over-year growth 2025-2030 (%)
Data Table on Argentina - Year-over-year growth 2025-2030 (%)

12.7.3 Colombia - Market size and forecast 2025-2030

Chart on Colombia - Market size and forecast 2025-2030 ($ million)
Data Table on Colombia - Market size and forecast 2025-2030 ($ million)
Chart on Colombia - Year-over-year growth 2025-2030 (%)
Data Table on Colombia - Year-over-year growth 2025-2030 (%)

12.8 Market opportunity by geography

Market opportunity by geography ($ million)
Data Tables on Market opportunity by geography ($ million)

13. Drivers, Challenges, and Opportunity

13.1 Market drivers

Modernization of airborne tactical operations and defense procurement
Expansion of the commercial space sector and reusable launch vehicle recovery
Technological innovations in material science and autonomous aerial delivery systems

13.2 Market challenges

Stringent regulatory compliance and certification standards
Supply chain volatility and raw material scarcity
High operational costs and technical complexity of smart systems

13.3 Impact of drivers and challenges

Impact of drivers and challenges in 2025 and 2030

13.4 Market opportunities

Integration of autonomous navigation and GPS-guided precision delivery systems
Adoption of sustainable high-tenacity textiles and advanced material science
Expansion of ballistic recovery systems and urban air mobility safety solutions

14. Competitive Landscape

14.1 Overview

14.2

Overview on criticality of inputs and factors of differentiation

14.3 Landscape disruption

Overview on factors of disruption

14.4 Industry risks

Impact of key risks on business

15. Competitive Analysis

15.1 Companies profiled

Companies covered

15.2 Company ranking index

15.3 Market positioning of companies

Matrix on companies position and classification

15.4 Aerodyne Research LLC

Aerodyne Research LLC - Overview
Aerodyne Research LLC - Product / Service
Aerodyne Research LLC - Key offerings
SWOT

15.5 Airborne Systems

Airborne Systems - Overview
Airborne Systems - Product / Service
Airborne Systems - Key offerings
SWOT

15.6 Airtec GmbH and Co.KG.

Airtec GmbH and Co.KG. - Overview
Airtec GmbH and Co.KG. - Product / Service
Airtec GmbH and Co.KG. - Key offerings
SWOT

15.7 Atair Aerospace.

Atair Aerospace. - Overview
Atair Aerospace. - Product / Service
Atair Aerospace. - Key offerings
SWOT

15.8 Butler Parachute Systems Inc.

Butler Parachute Systems Inc. - Overview
Butler Parachute Systems Inc. - Product / Service
Butler Parachute Systems Inc. - Key offerings
SWOT

15.9 CIMSA Ingenieria de Sistemas SA.

CIMSA Ingenieria de Sistemas SA. - Overview
CIMSA Ingenieria de Sistemas SA. - Product / Service
CIMSA Ingenieria de Sistemas SA. - Key offerings
SWOT

15.10 Complete Parachute Solutions

Complete Parachute Solutions - Overview
Complete Parachute Solutions - Product / Service
Complete Parachute Solutions - Key offerings
SWOT

15.11 FXC Corp.

FXC Corp. - Overview
FXC Corp. - Product / Service
FXC Corp. - Key offerings
SWOT

15.12 Magam Safety Ltd.

Magam Safety Ltd. - Overview
Magam Safety Ltd. - Product / Service
Magam Safety Ltd. - Key offerings
SWOT

15.13 Mills Manufacturing Corp.

Mills Manufacturing Corp. - Overview
Mills Manufacturing Corp. - Product / Service
Mills Manufacturing Corp. - Key offerings
SWOT

15.14 NZ Aerosports.

NZ Aerosports. - Overview
NZ Aerosports. - Product / Service
NZ Aerosports. - Key offerings
SWOT

15.15 Performance Designs Inc.

Performance Designs Inc. - Overview
Performance Designs Inc. - Product / Service
Performance Designs Inc. - Key offerings
SWOT

15.16 Precision Aerodynamics Inc.

Precision Aerodynamics Inc. - Overview
Precision Aerodynamics Inc. - Product / Service
Precision Aerodynamics Inc. - Key offerings
SWOT

15.17 Safran SA

Safran SA - Overview
Safran SA - Business segments
Safran SA - Key offerings
Safran SA - Segment focus
SWOT

15.18 United Parachute Technologies LLC.

United Parachute Technologies LLC. - Overview
United Parachute Technologies LLC. - Product / Service
United Parachute Technologies LLC. - Key offerings
SWOT

16. Appendix

16.1 Scope of the report

Market definition
Objectives
Notes and caveats

16.2 Inclusions and exclusions checklist

Inclusions checklist
Exclusions checklist

16.3 Currency conversion rates for US$

16.4 Research methodology

16.5 Data procurement

Information sources

16.6 Data validation

16.7 Validation techniques employed for market sizing

16.8 Data synthesis

16.9 360 degree market analysis

16.10 List of abbreviations

Research Methodology

Technavio presents a detailed picture of the market by way of study, synthesis, and summation of data from multiple sources. The analysts have presented the various facets of the market with a particular focus on identifying the key industry influencers. The data thus presented is comprehensive, reliable, and the result of extensive research, both primary and secondary.

INFORMATION SOURCES

Primary sources

  • Manufacturers and suppliers
  • Channel partners
  • Industry experts
  • Strategic decision makers

Secondary sources

  • Industry journals and periodicals
  • Government data
  • Financial reports of key industry players
  • Historical data
  • Press releases

DATA ANALYSIS

Data Synthesis

  • Collation of data
  • Estimation of key figures
  • Analysis of derived insights

Data Validation

  • Triangulation with data models
  • Reference against proprietary databases
  • Corroboration with industry experts

REPORT WRITING

Qualitative

  • Market drivers
  • Market challenges
  • Market trends
  • Five forces analysis

Quantitative

  • Market size and forecast
  • Market segmentation
  • Geographical insights
  • Competitive landscape

Interested in this report?

Get your sample now to see our research methodology and insights!

Download Now

Frequently Asked Questions

Commercial And Military Parachute market growth will increase by USD 589.7 million during 2026-2030.

The Commercial And Military Parachute market is expected to grow at a CAGR of 7.1% during 2026-2030.

Commercial And Military Parachute market is segmented by Type (Round, Ram air, Square and cruciform, Others) Material (Nylon, Kevlar and aramid blends, Polyester, Others) End-user (Defense forces, Recreational users, Emergency services and civil aviation, Others)

Aerodyne Research LLC, Airborne Systems, Airtec GmbH and Co.KG., Atair Aerospace., Ballistic Recovery SystemsA Inc., Butler Parachute Systems Inc., CIMSA Ingenieria de Sistemas SA., Complete Parachute Solutions, FXC Corp., Magam Safety Ltd., Mills Manufacturing Corp., NZ Aerosports., Parachute Systems., Performance Designs Inc., Precision Aerodynamics Inc., Rigging Innovations Inc., Safran SA, Strong Enterprises., Switlik Parachute Co. Inc., United Parachute Technologies LLC. are a few of the key vendors in the Commercial And Military Parachute market.

North America will register the highest growth rate of 37.7% among the other regions. Therefore, the Commercial And Military Parachute market in North America is expected to garner significant business opportunities for the vendors during the forecast period.

US, Canada, Mexico, Germany, UK, France, Italy, Spain, Russia, China, India, Japan, South Korea, Australia, Indonesia, Saudi Arabia, UAE, South Africa, Israel, Turkey, Brazil, Argentina, Colombia

  • Modernization of airborne tactical operations and defense procurement is the driving factor this market.

The Commercial And Military Parachute market vendors should focus on grabbing business opportunities from the Type segment as it accounted for the largest market share in the base year.
RIA - Research AI Assistant
Ask RIA