Commercial Beverage Blender Market Analysis, Size, and Forecast 2026-2030: North America (US, Canada, and Mexico), Europe (Germany, UK, and France), APAC (China, Japan, and India), South America (Brazil, Argentina, and Colombia), Middle East and Africa (South Africa, Saudi Arabia, and UAE), and Rest of World (ROW)

Commercial Beverage Blender Market Analysis, Size, and Forecast 2026-2030:
North America (US, Canada, and Mexico), Europe (Germany, UK, and France), APAC (China, Japan, and India), South America (Brazil, Argentina, and Colombia), Middle East and Africa (South Africa, Saudi Arabia, and UAE), and Rest of World (ROW)

Published: Dec 2025 291 Pages SKU: IRTNTR46509

Market Overview at a Glance

$15.04 Mn
Market Opportunity
3.4%
CAGR 2025 - 2030
32.6%
North America Growth
$37.22 Mn
JCP segment 2024

Commercial Beverage Blender Market Size 2026-2030

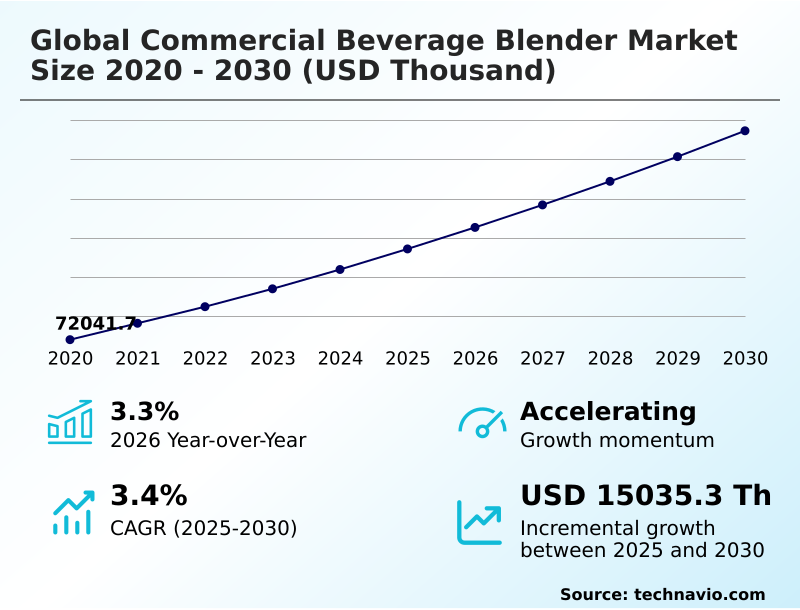
The commercial beverage blender market size is valued to increase by USD 15.04 million, at a CAGR of 3.4% from 2025 to 2030. Strategic pivot toward cold and customized beverage platforms will drive the commercial beverage blender market.

Major Market Trends & Insights

  • North America dominated the market and accounted for a 32.6% growth during the forecast period.
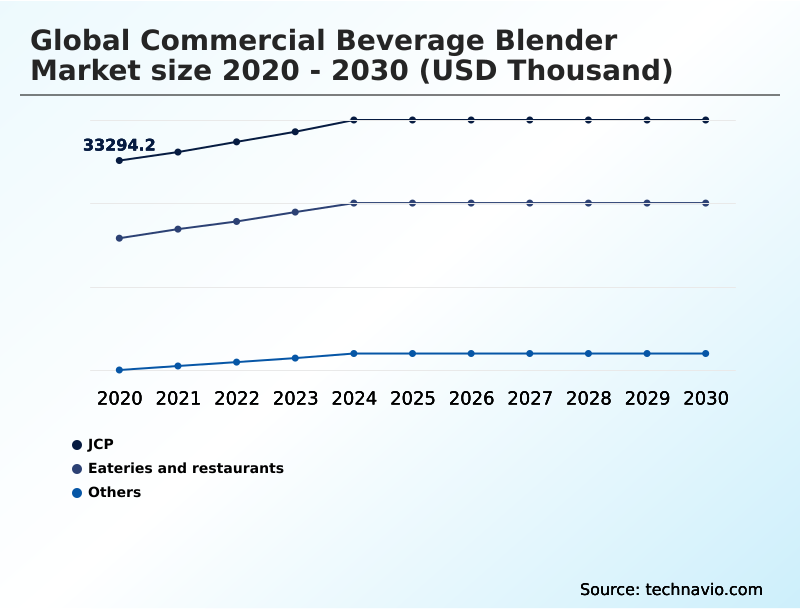
  • By End-user - JCP segment was valued at USD 37.22 million in 2024
  • By Distribution Channel - Offline segment accounted for the largest market revenue share in 2024

Market Size & Forecast

  • Market Opportunities:
  • Market Future Opportunities: USD 15.04 million
  • CAGR from 2025 to 2030 : 3.4%

Market Summary

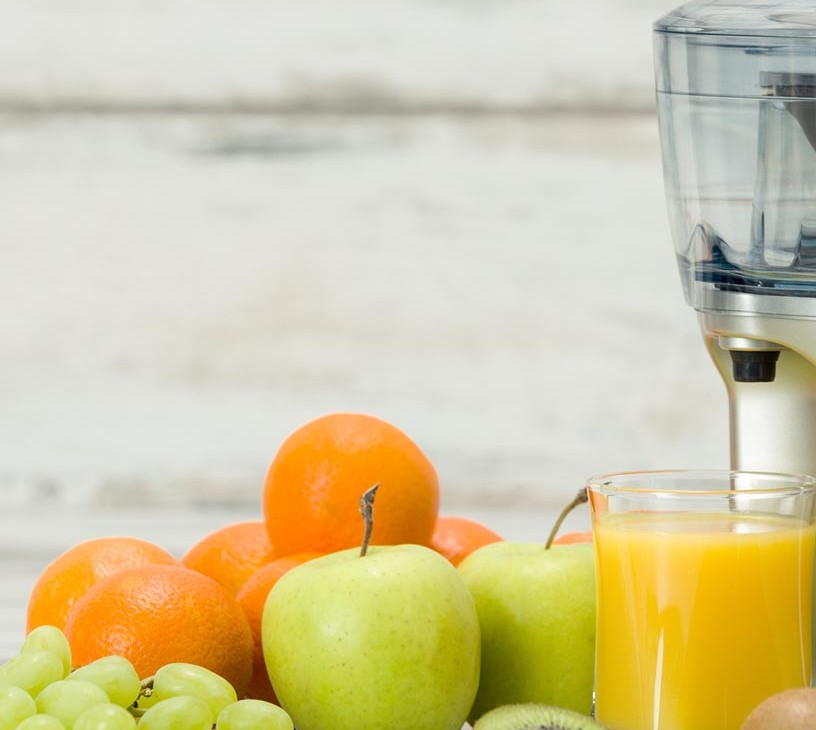
  • The commercial beverage blender market is undergoing a significant transformation, driven by the foodservice industry's pivot toward high-margin, complex cold beverages and the pressing need for labor automation. The modern blender is no longer a simple appliance but a critical component of operational throughput, with advanced features such as programmable logic controllers and high-torque blending capability.
  • This evolution is a direct response to menu diversification, which now includes everything from functional smoothies with fibrous ingredients to texturally complex cold foams, requiring superior emulsification performance. As a result, operators are investing in heavy-duty culinary blenders that offer reliability and consistency.
  • For instance, a quick-service restaurant chain seeking to reduce drive-thru service times might evaluate a fleet of smart blenders with automated shut-off and pre-set cycles.
  • The decision involves balancing the substantial initial capital expenditure against the projected return on investment from increased transaction speed and reduced staff training, a calculation central to surviving in a competitive landscape where efficiency dictates profitability. This dynamic is pushing manufacturers to innovate in areas like motor torque at low speeds and acoustic engineering.

What will be the Size of the Commercial Beverage Blender Market during the forecast period?

Get Key Insights on Market Forecast (PDF) Request Free Sample

How is the Commercial Beverage Blender Market Segmented?

The commercial beverage blender industry research report provides comprehensive data (region-wise segment analysis), with forecasts and estimates in "USD thousand" for the period 2026-2030, as well as historical data from 2020-2024 for the following segments.

  • End-user
    • JCP
    • Eateries and restaurants
    • Others
  • Distribution channel
    • Offline
    • Online
  • Material
    • Stainless-steel
    • Plastic
    • Glass
  • Geography
    • North America
      • US
      • Canada
      • Mexico
    • Europe
      • Germany
      • UK
      • France
    • APAC
      • China
      • Japan
      • India
    • South America
      • Brazil
      • Argentina
      • Colombia
    • Middle East and Africa
      • South Africa
      • Saudi Arabia
      • UAE
    • Rest of World (ROW)

By End-user Insights

The jcp segment is estimated to witness significant growth during the forecast period.

The JCP segment, including juice bars and coffee shops, is the most demanding, relying on high-torque blending and superior emulsification performance for complex fresh beverage offerings. As many operate in open layouts, quiet commercial blenders are essential.

The model requires equipment for high-viscosity drink processing and diverse frozen beverage equipment, making beverage texture diversification a key differentiator. Innovations in blade geometry, hardened steel blades, and BPA-free materials support the creation of grab-and-go formats.

Effective airflow design is crucial for motor longevity, while nutrient extraction capability meets the demand for functional beverages.

Request Free Sample

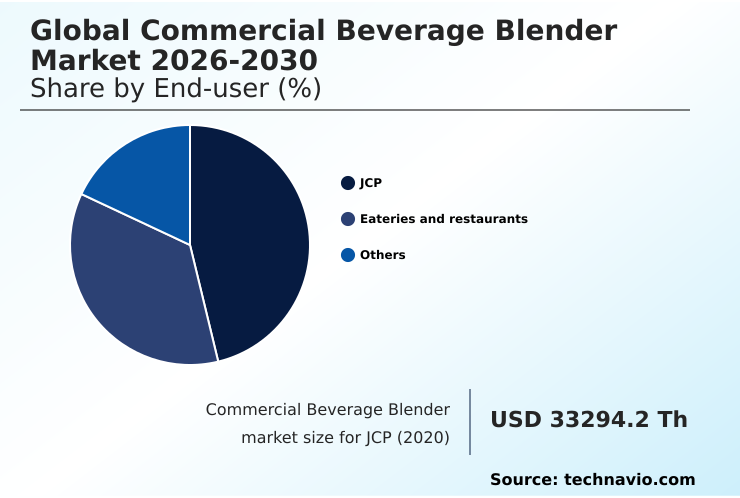
The JCP segment was valued at USD 37.22 million in 2024 and showed a gradual increase during the forecast period.

Request Free Sample

Regional Analysis

North America is estimated to contribute 32.6% to the growth of the global market during the forecast period.Technavio’s analysts have elaborately explained the regional trends and drivers that shape the market during the forecast period.

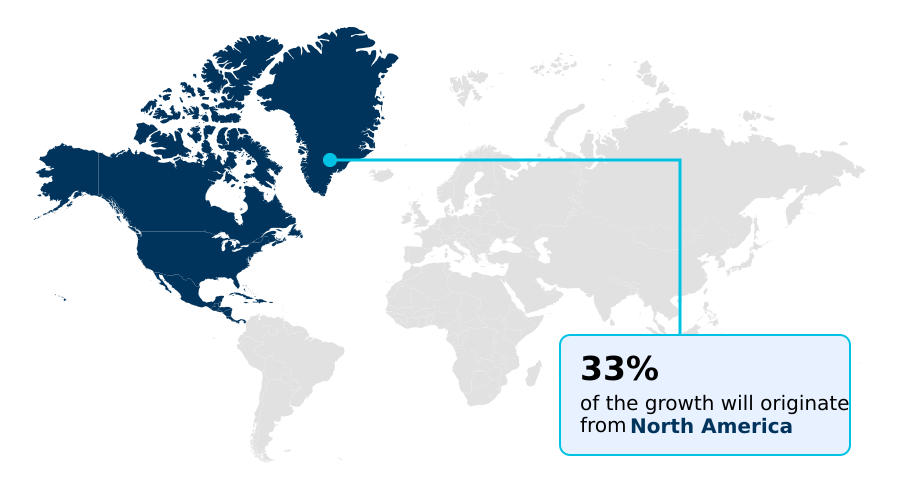
See How Commercial Beverage Blender Market Demand is Rising in North America Request Free Sample

The geographic landscape is diverse, with North America driving 32.6% of incremental growth through demand for speed and automation. Operators here prioritize features for smoothie bowl blenders and nutrient extraction blenders.

Europe focuses on acoustics and compliance, favoring culinary-grade machines with superior vortex dynamics. APAC serves as the volume engine, where demand for durable copolyester containers and polycarbonate jars is high.

Universally, blending cycle customization is key, reducing preparation times by up to 25%. High-impact polycarbonate and managing motor torque at low speeds to achieve cavitation prevention are critical for front-of-house blending solutions that meet strict hygiene standards.

Market Dynamics

Our researchers analyzed the data with 2025 as the base year, along with the key drivers, trends, and challenges. A holistic analysis of drivers will help companies refine their marketing strategies to gain a competitive advantage.

  • Foodservice operators are increasingly strategic when selecting equipment, moving beyond basic specifications to address specific menu needs. The decision to invest in a commercial blender for cold foam versus a high-performance blender for smoothie bowls now involves a detailed analysis of blender jar geometry for thick mixtures.
  • When comparing brushless and universal blender motors, businesses weigh the upfront cost against long-term energy savings and noise levels, a critical factor when reducing noise in front-of-house blenders. The search for the quietest blender for coffee shops often leads to units with a commercial blender with sound enclosure.
  • For high-volume environments, finding the best blender for crushing ice and a durable blender for high-volume use is paramount. The rise of health-conscious consumers drives demand for a blender for functional nutrition drinks and a blender for plant-based protein shakes.
  • Automation is a key value proposition; an automated blender for labor savings with walk-away operation in commercial blenders can reduce training times by half compared to manual models. Chains are implementing IoT-enabled blenders for chain restaurants with a blender with pre-programmed blend cycles for consistency. The choice between stainless steel vs polycarbonate blender jars comes down to durability versus visibility.
  • Success requires a focus on blender maintenance for foodservice and optimizing workflow with smart blenders, particularly for a blender for heavy-duty culinary tasks that relies on robust thermal protection in commercial blenders.

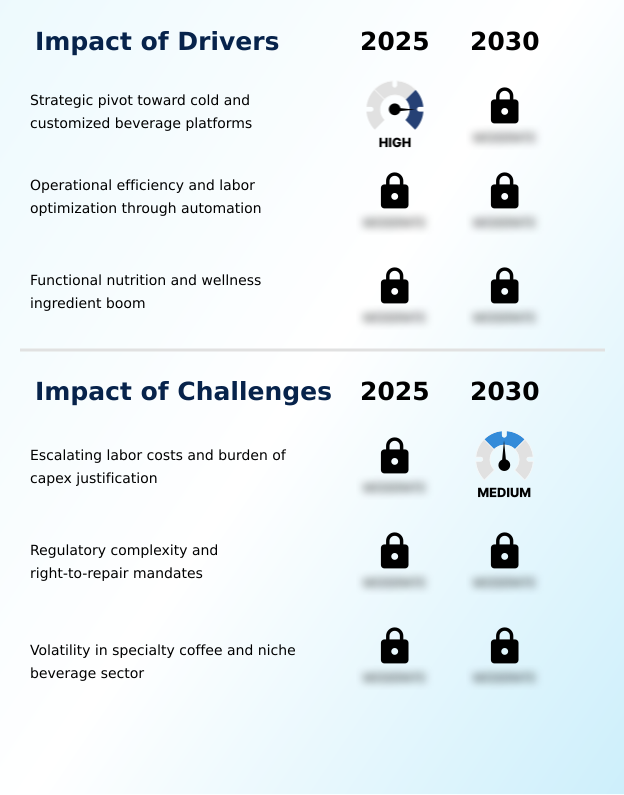
What are the key market drivers leading to the rise in the adoption of Commercial Beverage Blender Industry?

  • A strategic pivot by foodservice operators toward cold and customized beverage platforms is the key driver of market growth.

  • The shift toward cold beverages, now over 60% of sales in leading chains, is a critical driver demanding superior ice crushing capability and rapid processing speeds.
  • To manage costs, operators are investing in labor optimization blenders that offer walk-away blending capability through sensory feedback systems and variable speed control, increasing throughput by 15% during peak hours.
  • The growth of beverage-led concepts requires equipment that can handle high-viscosity processing and has good thermal management. This trend, pushing drive-thru blending efficiency and specialized tamper tool design, validates the strong return on investment from advanced commercial blending stations.

What are the market trends shaping the Commercial Beverage Blender Industry?

  • The market is undergoing a significant transformation centered on acoustic engineering. This evolution in front-of-house optimization focuses on reducing operational noise to enhance the customer experience.

  • A primary trend is the focus on front-of-house optimization, driven by the prevalence of open-kitchen layouts. Manufacturers are prioritizing acoustic engineering for a low-decibel output, with sound dampening enclosures reducing noise by up to 10 decibels. The adoption of brushless motor technology and floating motor mounts supports these stealth blending solutions.
  • Concurrently, workflow automation is critical, with programmable logic controllers ensuring recipe consistency with less than 2% variance. This evolution toward smart blender technology features automated shut-off and integrates equipment into a connected kitchen ecosystem for automated beverage production in high-velocity workflows.

What challenges does the Commercial Beverage Blender Industry face during its growth?

  • Escalating labor costs and the increasing burden of capital expenditure justification present a key challenge affecting the industry's growth trajectory.

  • A significant challenge is economic pressure from labor costs, compelling over 40% of operators to extend the replacement cycle. This lengthens the total cost of ownership calculation for premium equipment. New repair mandates, increasing compliance costs by 5-8%, demand a focus on modular architecture and drive socket durability.
  • This forces a redesign of units with waterproof control panels and accessible universal motor design, impacting both industrial-grade components and liquid preparation technology. Effective after-sales maintenance is now essential for front counter equipment and back-of-house operations, especially for heavy-duty culinary blending.

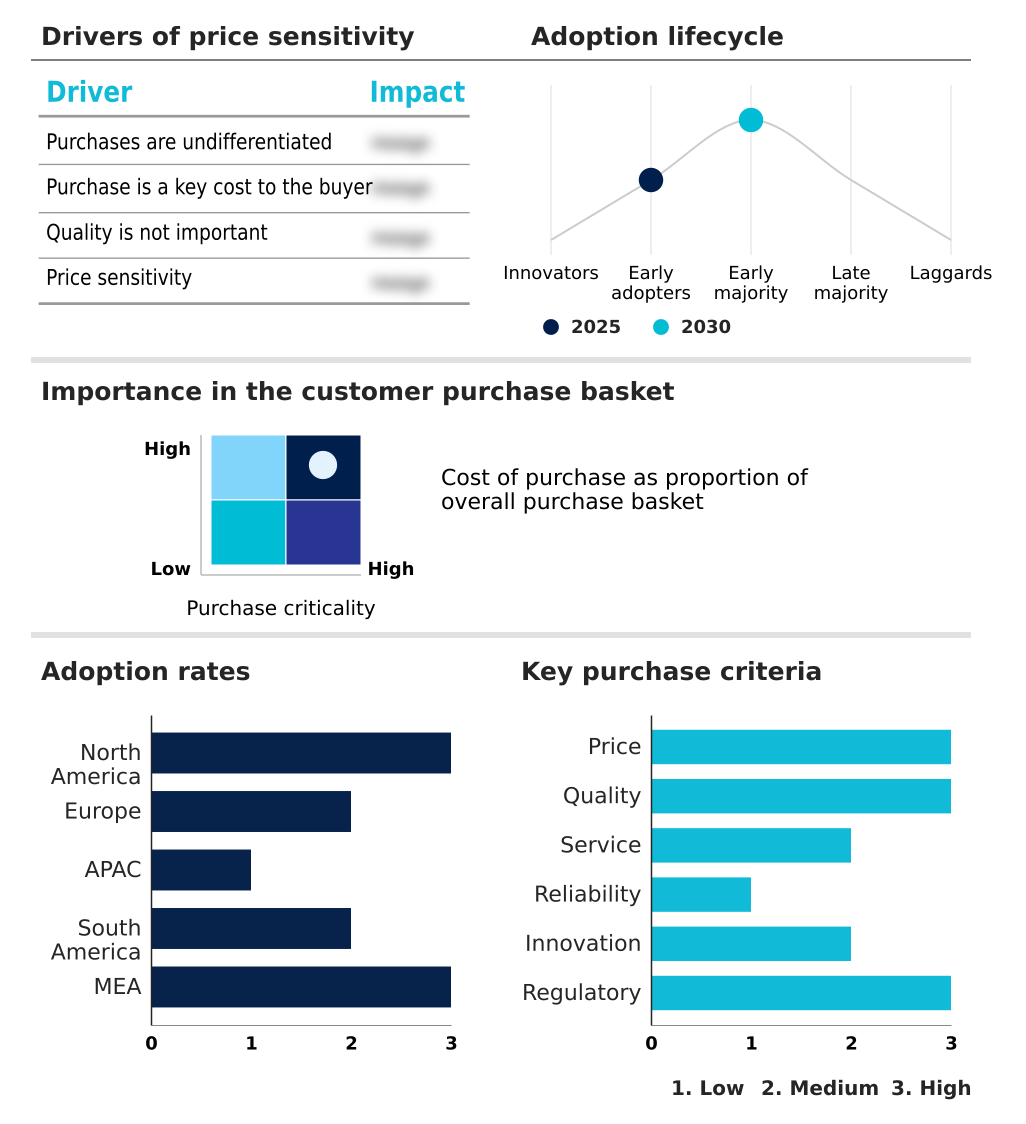
Exclusive Technavio Analysis on Customer Landscape

The commercial beverage blender market forecasting report includes the adoption lifecycle of the market, covering from the innovator’s stage to the laggard’s stage. It focuses on adoption rates in different regions based on penetration. Furthermore, the commercial beverage blender market report also includes key purchase criteria and drivers of price sensitivity to help companies evaluate and develop their market growth analysis strategies.

Customer Landscape of Commercial Beverage Blender Industry

Competitive Landscape

Companies are implementing various strategies, such as strategic alliances, commercial beverage blender market forecast, partnerships, mergers and acquisitions, geographical expansion, and product/service launches, to enhance their presence in the industry.

bianco di puro GmbH and Co. KG - Key offerings consist of high-performance commercial beverage blenders engineered for durability and speed, targeting the rigorous demands of professional foodservice environments.

The industry research and growth report includes detailed analyses of the competitive landscape of the market and information about key companies, including:

  • bianco di puro GmbH and Co. KG
  • Blendtec Inc.
  • Breville Group Limited.
  • Brew Driver
  • Electrolux Professional AB
  • Hamilton Beach Brands Inc.
  • Kenwood Ltd.
  • KitchenAid
  • Koninklijke Philips NV
  • Omcan Inc.
  • Optimum Appliances
  • Optimum Appliances Pty Ltd.
  • ROBOT COUPE SNC.
  • Sammic SL
  • SANTOS SAS
  • Skyfood Equipment LLC
  • Smeg S.p.a.
  • Stoelting Foodservice Equipment
  • Vita Mix Corp.
  • Waring Commercial

Qualitative and quantitative analysis of companies has been conducted to help clients understand the wider business environment as well as the strengths and weaknesses of key industry players. Data is qualitatively analyzed to categorize companies as pure play, category-focused, industry-focused, and diversified; it is quantitatively analyzed to categorize companies as dominant, leading, strong, tentative, and weak.

Recent Development and News in Commercial beverage blender market

  • In August 2024, Dutch Bros Inc. confirmed an aggressive expansion strategy, targeting nearly one thousand locations by year-end, driving demand for heavy-duty blenders for its signature Freeze beverages.
  • In October 2024, Smoothie King introduced a specialized menu for customers on GLP-1 medications, requiring blenders capable of processing high-protein, nutrient-dense ingredients.
  • In January 2025, Arcos Dorados, the world's largest McDonald's franchisee, announced a capital investment plan of approximately $350 for the year, with a significant portion allocated to modernizing restaurant units and enhancing beverage capabilities.
  • In February 2025, at The NAFEM Show in Atlanta, Hamilton Beach Commercial showcased its new Compact Big Rig immersion blender, emphasizing versatility and hygiene with a detachable shaft for simplified cleaning.

Dive into Technavio’s robust research methodology, blending expert interviews, extensive data synthesis, and validated models for unparalleled Commercial Beverage Blender Market insights. See full methodology.

Market Scope
Page number 291
Base year 2025
Historic period 2020-2024
Forecast period 2026-2030
Growth momentum & CAGR Accelerate at a CAGR of 3.4%
Market growth 2026-2030 USD 15035.3 thousand
Market structure Fragmented
YoY growth 2025-2026(%) 3.3%
Key countries US, Canada, Mexico, Germany, UK, France, Italy, Spain, The Netherlands, China, Japan, India, South Korea, Australia, Indonesia, Brazil, Argentina, Colombia, South Africa, Saudi Arabia, UAE, Egypt and Turkey
Competitive landscape Leading Companies, Market Positioning of Companies, Competitive Strategies, and Industry Risks

Request Free Sample

Research Analyst Overview

  • The commercial beverage blender market is defined by a push toward integrating advanced technology to solve core operational challenges in foodservice. Innovations in brushless motor technology and high-torque blending are no longer just for performance but are integral to thermal management and equipment longevity.
  • A key trend is the adoption of programmable logic controllers, enabling blending cycle customization across franchise networks, a boardroom-level decision to ensure brand consistency. This allows for precise control over emulsification performance and vortex dynamics, essential for high-viscosity processing. The use of durable materials like hardened steel blades, high-impact polycarbonate, and advanced copolyester containers improves drive socket durability.
  • With sensory feedback systems and automated shut-off features, chains have achieved a 30% reduction in processing time. This evolution demands sophisticated blade geometry, acoustic engineering with sound dampening enclosures, floating motor mounts, and effective airflow design for cavitation prevention and managing motor torque at low speeds.
  • The focus on modular architecture and industrial-grade components like waterproof control panels and polycarbonate jars addresses the need for both heavy-duty culinary blending and nutrient extraction capability.

What are the Key Data Covered in this Commercial Beverage Blender Market Research and Growth Report?

  • What is the expected growth of the Commercial Beverage Blender Market between 2026 and 2030?

    • USD 15.04 million, at a CAGR of 3.4%

  • What segmentation does the market report cover?

    • The report is segmented by End-user (JCP, Eateries and restaurants, and Others), Distribution Channel (Offline, and Online), Material (Stainless-steel, Plastic, and Glass) and Geography (North America, Europe, APAC, South America, Middle East and Africa)

  • Which regions are analyzed in the report?

    • North America, Europe, APAC, South America and Middle East and Africa

  • What are the key growth drivers and market challenges?

    • Strategic pivot toward cold and customized beverage platforms, Escalating labor costs and burden of capex justification

  • Who are the major players in the Commercial Beverage Blender Market?

    • bianco di puro GmbH and Co. KG, Blendtec Inc., Breville Group Limited., Brew Driver, Electrolux Professional AB, Hamilton Beach Brands Inc., Kenwood Ltd., KitchenAid, Koninklijke Philips NV, Omcan Inc., Optimum Appliances, Optimum Appliances Pty Ltd., ROBOT COUPE SNC., Sammic SL, SANTOS SAS, Skyfood Equipment LLC, Smeg S.p.a., Stoelting Foodservice Equipment, Vita Mix Corp. and Waring Commercial

Market Research Insights

  • The market is evolving beyond simple blending, with a focus on total cost of ownership and labor optimization blenders. The adoption of walk-away blending capability, which improves staff efficiency by over 30%, is a key trend in automated beverage production.
  • Quiet commercial blenders, leveraging stealth blending solutions, can reduce ambient noise levels by 5-10 decibels compared to legacy models, making them ideal for front-of-house blending solutions and open-kitchen layouts. The growth of beverage-led concepts and fresh beverage offerings in grab-and-go formats drives demand for heavy-duty culinary blenders and culinary-grade machines capable of high-viscosity drink processing.
  • Operators now demand robust after-sales maintenance to manage the replacement cycle and secure return on investment from commercial blending stations and frozen beverage equipment, especially in high-velocity workflows where hygiene standards are critical.

We can help! Our analysts can customize this commercial beverage blender market research report to meet your requirements.

Get in touch

1. Executive Summary

1.1 Market overview

Executive Summary - Chart on Market Overview
Executive Summary - Data Table on Market Overview
Executive Summary - Chart on Global Market Characteristics
Executive Summary - Chart on Market by Geography
Executive Summary - Chart on Market Segmentation by End-user
Executive Summary - Chart on Market Segmentation by Distribution Channel
Executive Summary - Chart on Market Segmentation by Material
Executive Summary - Chart on Incremental Growth
Executive Summary - Data Table on Incremental Growth
Executive Summary - Chart on Company Market Positioning

2. Technavio Analysis

2.1 Analysis of price sensitivity, lifecycle, customer purchase basket, adoption rates, and purchase criteria

2.2 Criticality of inputs and Factors of differentiation

Chart on Overview on criticality of inputs and factors of differentiation

2.3 Factors of disruption

Chart on Overview on factors of disruption

2.4 Impact of drivers and challenges

Chart on Impact of drivers and challenges in 2025 and 2030

3. Market Landscape

3.1 Market ecosystem

Chart on Parent Market
Data Table on - Parent Market

3.2 Market characteristics

Chart on Market characteristics analysis

3.3 Value chain analysis

Chart on Value chain analysis

4. Market Sizing

4.1 Market definition

Data Table on Offerings of companies included in the market definition

4.2 Market segment analysis

Market segments

4.3 Market size 2025

4.4 Market outlook: Forecast for 2025-2030

Chart on Global - Market size and forecast 2025-2030 ($ thousand)
Data Table on Global - Market size and forecast 2025-2030 ($ thousand)
Chart on Global Market: Year-over-year growth 2025-2030 (%)
Data Table on Global Market: Year-over-year growth 2025-2030 (%)

5. Historic Market Size

5.1 Global Commercial Beverage Blender Market 2020 - 2024

Historic Market Size - Data Table on Global Commercial Beverage Blender Market 2020 - 2024 ($ thousand)

5.2 End-user segment analysis 2020 - 2024

Historic Market Size - End-user Segment 2020 - 2024 ($ thousand)

5.3 Distribution Channel segment analysis 2020 - 2024

Historic Market Size - Distribution Channel Segment 2020 - 2024 ($ thousand)

5.4 Material segment analysis 2020 - 2024

Historic Market Size - Material Segment 2020 - 2024 ($ thousand)

5.5 Geography segment analysis 2020 - 2024

Historic Market Size - Geography Segment 2020 - 2024 ($ thousand)

5.6 Country segment analysis 2020 - 2024

Historic Market Size - Country Segment 2020 - 2024 ($ thousand)

6. Qualitative Analysis

6.1 Impact of AI in the Global Commercial Beverage Blender Market

7. Five Forces Analysis

7.1 Five forces summary

Five forces analysis - Comparison between 2025 and 2030

7.2 Bargaining power of buyers

Bargaining power of buyers - Impact of key factors 2025 and 2030

7.3 Bargaining power of suppliers

Bargaining power of suppliers - Impact of key factors in 2025 and 2030

7.4 Threat of new entrants

Threat of new entrants - Impact of key factors in 2025 and 2030

7.5 Threat of substitutes

Threat of substitutes - Impact of key factors in 2025 and 2030

7.6 Threat of rivalry

Threat of rivalry - Impact of key factors in 2025 and 2030

7.7 Market condition

Chart on Market condition - Five forces 2025 and 2030

8. Market Segmentation by End-user

8.1 Market segments

Chart on End-user - Market share 2025-2030 (%)
Data Table on End-user - Market share 2025-2030 (%)

8.2 Comparison by End-user

Chart on Comparison by End-user
Data Table on Comparison by End-user

8.3 JCP - Market size and forecast 2025-2030

Chart on JCP - Market size and forecast 2025-2030 ($ thousand)
Data Table on JCP - Market size and forecast 2025-2030 ($ thousand)
Chart on JCP - Year-over-year growth 2025-2030 (%)
Data Table on JCP - Year-over-year growth 2025-2030 (%)

8.4 Eateries and restaurants - Market size and forecast 2025-2030

Chart on Eateries and restaurants - Market size and forecast 2025-2030 ($ thousand)
Data Table on Eateries and restaurants - Market size and forecast 2025-2030 ($ thousand)
Chart on Eateries and restaurants - Year-over-year growth 2025-2030 (%)
Data Table on Eateries and restaurants - Year-over-year growth 2025-2030 (%)

8.5 Others - Market size and forecast 2025-2030

Chart on Others - Market size and forecast 2025-2030 ($ thousand)
Data Table on Others - Market size and forecast 2025-2030 ($ thousand)
Chart on Others - Year-over-year growth 2025-2030 (%)
Data Table on Others - Year-over-year growth 2025-2030 (%)

8.6 Market opportunity by End-user

Market opportunity by End-user ($ thousand)
Data Table on Market opportunity by End-user ($ thousand)

9. Market Segmentation by Distribution Channel

9.1 Market segments

Chart on Distribution Channel - Market share 2025-2030 (%)
Data Table on Distribution Channel - Market share 2025-2030 (%)

9.2 Comparison by Distribution Channel

Chart on Comparison by Distribution Channel
Data Table on Comparison by Distribution Channel

9.3 Offline - Market size and forecast 2025-2030

Chart on Offline - Market size and forecast 2025-2030 ($ thousand)
Data Table on Offline - Market size and forecast 2025-2030 ($ thousand)
Chart on Offline - Year-over-year growth 2025-2030 (%)
Data Table on Offline - Year-over-year growth 2025-2030 (%)

9.4 Online - Market size and forecast 2025-2030

Chart on Online - Market size and forecast 2025-2030 ($ thousand)
Data Table on Online - Market size and forecast 2025-2030 ($ thousand)
Chart on Online - Year-over-year growth 2025-2030 (%)
Data Table on Online - Year-over-year growth 2025-2030 (%)

9.5 Market opportunity by Distribution Channel

Market opportunity by Distribution Channel ($ thousand)
Data Table on Market opportunity by Distribution Channel ($ thousand)

10. Market Segmentation by Material

10.1 Market segments

Chart on Material - Market share 2025-2030 (%)
Data Table on Material - Market share 2025-2030 (%)

10.2 Comparison by Material

Chart on Comparison by Material
Data Table on Comparison by Material

10.3 Stainless-steel - Market size and forecast 2025-2030

Chart on Stainless-steel - Market size and forecast 2025-2030 ($ thousand)
Data Table on Stainless-steel - Market size and forecast 2025-2030 ($ thousand)
Chart on Stainless-steel - Year-over-year growth 2025-2030 (%)
Data Table on Stainless-steel - Year-over-year growth 2025-2030 (%)

10.4 Plastic - Market size and forecast 2025-2030

Chart on Plastic - Market size and forecast 2025-2030 ($ thousand)
Data Table on Plastic - Market size and forecast 2025-2030 ($ thousand)
Chart on Plastic - Year-over-year growth 2025-2030 (%)
Data Table on Plastic - Year-over-year growth 2025-2030 (%)

10.5 Glass - Market size and forecast 2025-2030

Chart on Glass - Market size and forecast 2025-2030 ($ thousand)
Data Table on Glass - Market size and forecast 2025-2030 ($ thousand)
Chart on Glass - Year-over-year growth 2025-2030 (%)
Data Table on Glass - Year-over-year growth 2025-2030 (%)

10.6 Market opportunity by Material

Market opportunity by Material ($ thousand)
Data Table on Market opportunity by Material ($ thousand)

11. Customer Landscape

11.1 Customer landscape overview

Analysis of price sensitivity, lifecycle, customer purchase basket, adoption rates, and purchase criteria

12. Geographic Landscape

12.1 Geographic segmentation

Chart on Market share by geography 2025-2030 (%)
Data Table on Market share by geography 2025-2030 (%)

12.2 Geographic comparison

Chart on Geographic comparison
Data Table on Geographic comparison

12.3 North America - Market size and forecast 2025-2030

Chart on North America - Market size and forecast 2025-2030 ($ thousand)
Data Table on North America - Market size and forecast 2025-2030 ($ thousand)
Chart on North America - Year-over-year growth 2025-2030 (%)
Data Table on North America - Year-over-year growth 2025-2030 (%)
Chart on Regional Comparison - North America
Data Table on Regional Comparison - North America

12.3.1 US - Market size and forecast 2025-2030

Chart on US - Market size and forecast 2025-2030 ($ thousand)
Data Table on US - Market size and forecast 2025-2030 ($ thousand)
Chart on US - Year-over-year growth 2025-2030 (%)
Data Table on US - Year-over-year growth 2025-2030 (%)

12.3.2 Canada - Market size and forecast 2025-2030

Chart on Canada - Market size and forecast 2025-2030 ($ thousand)
Data Table on Canada - Market size and forecast 2025-2030 ($ thousand)
Chart on Canada - Year-over-year growth 2025-2030 (%)
Data Table on Canada - Year-over-year growth 2025-2030 (%)

12.3.3 Mexico - Market size and forecast 2025-2030

Chart on Mexico - Market size and forecast 2025-2030 ($ thousand)
Data Table on Mexico - Market size and forecast 2025-2030 ($ thousand)
Chart on Mexico - Year-over-year growth 2025-2030 (%)
Data Table on Mexico - Year-over-year growth 2025-2030 (%)

12.4 Europe - Market size and forecast 2025-2030

Chart on Europe - Market size and forecast 2025-2030 ($ thousand)
Data Table on Europe - Market size and forecast 2025-2030 ($ thousand)
Chart on Europe - Year-over-year growth 2025-2030 (%)
Data Table on Europe - Year-over-year growth 2025-2030 (%)
Chart on Regional Comparison - Europe
Data Table on Regional Comparison - Europe

12.4.1 Germany - Market size and forecast 2025-2030

Chart on Germany - Market size and forecast 2025-2030 ($ thousand)
Data Table on Germany - Market size and forecast 2025-2030 ($ thousand)
Chart on Germany - Year-over-year growth 2025-2030 (%)
Data Table on Germany - Year-over-year growth 2025-2030 (%)

12.4.2 UK - Market size and forecast 2025-2030

Chart on UK - Market size and forecast 2025-2030 ($ thousand)
Data Table on UK - Market size and forecast 2025-2030 ($ thousand)
Chart on UK - Year-over-year growth 2025-2030 (%)
Data Table on UK - Year-over-year growth 2025-2030 (%)

12.4.3 France - Market size and forecast 2025-2030

Chart on France - Market size and forecast 2025-2030 ($ thousand)
Data Table on France - Market size and forecast 2025-2030 ($ thousand)
Chart on France - Year-over-year growth 2025-2030 (%)
Data Table on France - Year-over-year growth 2025-2030 (%)

12.4.4 Italy - Market size and forecast 2025-2030

Chart on Italy - Market size and forecast 2025-2030 ($ thousand)
Data Table on Italy - Market size and forecast 2025-2030 ($ thousand)
Chart on Italy - Year-over-year growth 2025-2030 (%)
Data Table on Italy - Year-over-year growth 2025-2030 (%)

12.4.5 Spain - Market size and forecast 2025-2030

Chart on Spain - Market size and forecast 2025-2030 ($ thousand)
Data Table on Spain - Market size and forecast 2025-2030 ($ thousand)
Chart on Spain - Year-over-year growth 2025-2030 (%)
Data Table on Spain - Year-over-year growth 2025-2030 (%)

12.4.6 The Netherlands - Market size and forecast 2025-2030

Chart on The Netherlands - Market size and forecast 2025-2030 ($ thousand)
Data Table on The Netherlands - Market size and forecast 2025-2030 ($ thousand)
Chart on The Netherlands - Year-over-year growth 2025-2030 (%)
Data Table on The Netherlands - Year-over-year growth 2025-2030 (%)

12.5 APAC - Market size and forecast 2025-2030

Chart on APAC - Market size and forecast 2025-2030 ($ thousand)
Data Table on APAC - Market size and forecast 2025-2030 ($ thousand)
Chart on APAC - Year-over-year growth 2025-2030 (%)
Data Table on APAC - Year-over-year growth 2025-2030 (%)
Chart on Regional Comparison - APAC
Data Table on Regional Comparison - APAC

12.5.1 China - Market size and forecast 2025-2030

Chart on China - Market size and forecast 2025-2030 ($ thousand)
Data Table on China - Market size and forecast 2025-2030 ($ thousand)
Chart on China - Year-over-year growth 2025-2030 (%)
Data Table on China - Year-over-year growth 2025-2030 (%)

12.5.2 Japan - Market size and forecast 2025-2030

Chart on Japan - Market size and forecast 2025-2030 ($ thousand)
Data Table on Japan - Market size and forecast 2025-2030 ($ thousand)
Chart on Japan - Year-over-year growth 2025-2030 (%)
Data Table on Japan - Year-over-year growth 2025-2030 (%)

12.5.3 India - Market size and forecast 2025-2030

Chart on India - Market size and forecast 2025-2030 ($ thousand)
Data Table on India - Market size and forecast 2025-2030 ($ thousand)
Chart on India - Year-over-year growth 2025-2030 (%)
Data Table on India - Year-over-year growth 2025-2030 (%)

12.5.4 South Korea - Market size and forecast 2025-2030

Chart on South Korea - Market size and forecast 2025-2030 ($ thousand)
Data Table on South Korea - Market size and forecast 2025-2030 ($ thousand)
Chart on South Korea - Year-over-year growth 2025-2030 (%)
Data Table on South Korea - Year-over-year growth 2025-2030 (%)

12.5.5 Australia - Market size and forecast 2025-2030

Chart on Australia - Market size and forecast 2025-2030 ($ thousand)
Data Table on Australia - Market size and forecast 2025-2030 ($ thousand)
Chart on Australia - Year-over-year growth 2025-2030 (%)
Data Table on Australia - Year-over-year growth 2025-2030 (%)

12.5.6 Indonesia - Market size and forecast 2025-2030

Chart on Indonesia - Market size and forecast 2025-2030 ($ thousand)
Data Table on Indonesia - Market size and forecast 2025-2030 ($ thousand)
Chart on Indonesia - Year-over-year growth 2025-2030 (%)
Data Table on Indonesia - Year-over-year growth 2025-2030 (%)

12.6 South America - Market size and forecast 2025-2030

Chart on South America - Market size and forecast 2025-2030 ($ thousand)
Data Table on South America - Market size and forecast 2025-2030 ($ thousand)
Chart on South America - Year-over-year growth 2025-2030 (%)
Data Table on South America - Year-over-year growth 2025-2030 (%)
Chart on Regional Comparison - South America
Data Table on Regional Comparison - South America

12.6.1 Brazil - Market size and forecast 2025-2030

Chart on Brazil - Market size and forecast 2025-2030 ($ thousand)
Data Table on Brazil - Market size and forecast 2025-2030 ($ thousand)
Chart on Brazil - Year-over-year growth 2025-2030 (%)
Data Table on Brazil - Year-over-year growth 2025-2030 (%)

12.6.2 Argentina - Market size and forecast 2025-2030

Chart on Argentina - Market size and forecast 2025-2030 ($ thousand)
Data Table on Argentina - Market size and forecast 2025-2030 ($ thousand)
Chart on Argentina - Year-over-year growth 2025-2030 (%)
Data Table on Argentina - Year-over-year growth 2025-2030 (%)

12.6.3 Colombia - Market size and forecast 2025-2030

Chart on Colombia - Market size and forecast 2025-2030 ($ thousand)
Data Table on Colombia - Market size and forecast 2025-2030 ($ thousand)
Chart on Colombia - Year-over-year growth 2025-2030 (%)
Data Table on Colombia - Year-over-year growth 2025-2030 (%)

12.7 Middle East and Africa - Market size and forecast 2025-2030

Chart on Middle East and Africa - Market size and forecast 2025-2030 ($ thousand)
Data Table on Middle East and Africa - Market size and forecast 2025-2030 ($ thousand)
Chart on Middle East and Africa - Year-over-year growth 2025-2030 (%)
Data Table on Middle East and Africa - Year-over-year growth 2025-2030 (%)
Chart on Regional Comparison - Middle East and Africa
Data Table on Regional Comparison - Middle East and Africa

12.7.1 South Africa - Market size and forecast 2025-2030

Chart on South Africa - Market size and forecast 2025-2030 ($ thousand)
Data Table on South Africa - Market size and forecast 2025-2030 ($ thousand)
Chart on South Africa - Year-over-year growth 2025-2030 (%)
Data Table on South Africa - Year-over-year growth 2025-2030 (%)

12.7.2 Saudi Arabia - Market size and forecast 2025-2030

Chart on Saudi Arabia - Market size and forecast 2025-2030 ($ thousand)
Data Table on Saudi Arabia - Market size and forecast 2025-2030 ($ thousand)
Chart on Saudi Arabia - Year-over-year growth 2025-2030 (%)
Data Table on Saudi Arabia - Year-over-year growth 2025-2030 (%)

12.7.3 UAE - Market size and forecast 2025-2030

Chart on UAE - Market size and forecast 2025-2030 ($ thousand)
Data Table on UAE - Market size and forecast 2025-2030 ($ thousand)
Chart on UAE - Year-over-year growth 2025-2030 (%)
Data Table on UAE - Year-over-year growth 2025-2030 (%)

12.7.4 Egypt - Market size and forecast 2025-2030

Chart on Egypt - Market size and forecast 2025-2030 ($ thousand)
Data Table on Egypt - Market size and forecast 2025-2030 ($ thousand)
Chart on Egypt - Year-over-year growth 2025-2030 (%)
Data Table on Egypt - Year-over-year growth 2025-2030 (%)

12.7.5 Turkey - Market size and forecast 2025-2030

Chart on Turkey - Market size and forecast 2025-2030 ($ thousand)
Data Table on Turkey - Market size and forecast 2025-2030 ($ thousand)
Chart on Turkey - Year-over-year growth 2025-2030 (%)
Data Table on Turkey - Year-over-year growth 2025-2030 (%)

12.8 Market opportunity by geography

Market opportunity by geography ($ thousand)
Data Tables on Market opportunity by geography ($ thousand)

13. Drivers, Challenges, and Opportunity

13.1 Market drivers

Strategic pivot toward cold and customized beverage platforms
Operational efficiency and labor optimization through automation
Functional nutrition and wellness ingredient boom

13.2 Market challenges

Escalating labor costs and burden of capex justification
Regulatory complexity and right-to-repair mandates
Volatility in specialty coffee and niche beverage sector

13.3 Impact of drivers and challenges

Impact of drivers and challenges in 2025 and 2030

13.4 Market opportunities

Acoustic engineering and front-of-house optimization revolution
Workflow automation and standardization of speed
Diversification of texture and rise of heavy-duty functionality

14. Competitive Landscape

14.1 Overview

14.2

Overview on criticality of inputs and factors of differentiation

14.3 Landscape disruption

Overview on factors of disruption

14.4 Industry risks

Impact of key risks on business

15. Competitive Analysis

15.1 Companies profiled

Companies covered

15.2 Company ranking index

15.3 Market positioning of companies

Matrix on companies position and classification

15.4 bianco di puro GmbH and Co. KG

bianco di puro GmbH and Co. KG - Overview
bianco di puro GmbH and Co. KG - Product / Service
bianco di puro GmbH and Co. KG - Key offerings
SWOT

15.5 Blendtec Inc.

Blendtec Inc. - Overview
Blendtec Inc. - Product / Service
Blendtec Inc. - Key offerings
SWOT

15.6 Breville Group Limited.

Breville Group Limited. - Overview
Breville Group Limited. - Product / Service
Breville Group Limited. - Key offerings
SWOT

15.7 Electrolux Professional AB

Electrolux Professional AB - Overview
Electrolux Professional AB - Business segments
Electrolux Professional AB - Key news
Electrolux Professional AB - Key offerings
Electrolux Professional AB - Segment focus
SWOT

15.8 Hamilton Beach Brands Inc.

Hamilton Beach Brands Inc. - Overview
Hamilton Beach Brands Inc. - Product / Service
Hamilton Beach Brands Inc. - Key offerings
SWOT

15.9 Kenwood Ltd.

Kenwood Ltd. - Overview
Kenwood Ltd. - Product / Service
Kenwood Ltd. - Key offerings
SWOT

15.10 KitchenAid

KitchenAid - Overview
KitchenAid - Product / Service
KitchenAid - Key offerings
SWOT

15.11 Koninklijke Philips NV

Koninklijke Philips NV - Overview
Koninklijke Philips NV - Business segments
Koninklijke Philips NV - Key news
Koninklijke Philips NV - Key offerings
Koninklijke Philips NV - Segment focus
SWOT

15.12 Omcan Inc.

Omcan Inc. - Overview
Omcan Inc. - Product / Service
Omcan Inc. - Key offerings
SWOT

15.13 Optimum Appliances

Optimum Appliances - Overview
Optimum Appliances - Product / Service
Optimum Appliances - Key offerings
SWOT

15.14 ROBOT COUPE SNC.

ROBOT COUPE SNC. - Overview
ROBOT COUPE SNC. - Product / Service
ROBOT COUPE SNC. - Key offerings
SWOT

15.15 Sammic SL

Sammic SL - Overview
Sammic SL - Product / Service
Sammic SL - Key offerings
SWOT

15.16 Smeg S.p.a.

Smeg S.p.a. - Overview
Smeg S.p.a. - Product / Service
Smeg S.p.a. - Key offerings
SWOT

15.17 Vita Mix Corp.

Vita Mix Corp. - Overview
Vita Mix Corp. - Product / Service
Vita Mix Corp. - Key offerings
SWOT

15.18 Waring Commercial

Waring Commercial - Overview
Waring Commercial - Product / Service
Waring Commercial - Key offerings
SWOT

16. Appendix

16.1 Scope of the report

Market definition
Objectives
Notes and caveats

16.2 Inclusions and exclusions checklist

Inclusions checklist
Exclusions checklist

16.3 Currency conversion rates for US$

16.4 Research methodology

16.5 Data procurement

Information sources

16.6 Data validation

16.7 Validation techniques employed for market sizing

16.8 Data synthesis

16.9 360 degree market analysis

16.10 List of abbreviations

Research Methodology

Technavio presents a detailed picture of the market by way of study, synthesis, and summation of data from multiple sources. The analysts have presented the various facets of the market with a particular focus on identifying the key industry influencers. The data thus presented is comprehensive, reliable, and the result of extensive research, both primary and secondary.

INFORMATION SOURCES

Primary sources

  • Manufacturers and suppliers
  • Channel partners
  • Industry experts
  • Strategic decision makers

Secondary sources

  • Industry journals and periodicals
  • Government data
  • Financial reports of key industry players
  • Historical data
  • Press releases

DATA ANALYSIS

Data Synthesis

  • Collation of data
  • Estimation of key figures
  • Analysis of derived insights

Data Validation

  • Triangulation with data models
  • Reference against proprietary databases
  • Corroboration with industry experts

REPORT WRITING

Qualitative

  • Market drivers
  • Market challenges
  • Market trends
  • Five forces analysis

Quantitative

  • Market size and forecast
  • Market segmentation
  • Geographical insights
  • Competitive landscape

Interested in this report?

Get your sample now to see our research methodology and insights!

Download Now

Frequently Asked Questions

Commercial Beverage Blender market growth will increase by USD 15035.3 thousand thousand during 2026-2030.

The Commercial Beverage Blender market is expected to grow at a CAGR of 3.4% during 2026-2030.

Commercial Beverage Blender market is segmented by End-user (JCP, Eateries and restaurants, Others) Distribution channel (Offline, Online) Material (Stainless-steel, Plastic, Glass)

bianco di puro GmbH and Co. KG, Blendtec Inc., Breville Group Limited., Brew Driver, Electrolux Professional AB, Hamilton Beach Brands Inc., Kenwood Ltd., KitchenAid, Koninklijke Philips NV, Omcan Inc., Optimum Appliances, Optimum Appliances Pty Ltd., ROBOT COUPE SNC., Sammic SL, SANTOS SAS, Skyfood Equipment LLC, Smeg S.p.a., Stoelting Foodservice Equipment, Vita Mix Corp., Waring Commercial are a few of the key vendors in the Commercial Beverage Blender market.

North America will register the highest growth rate of 32.6% among the other regions. Therefore, the Commercial Beverage Blender market in North America is expected to garner significant business opportunities for the vendors during the forecast period.

US, Canada, Mexico, Germany, UK, France, Italy, Spain, The Netherlands, China, Japan, India, South Korea, Australia, Indonesia, Brazil, Argentina, Colombia, South Africa, Saudi Arabia, UAE, Egypt, Turkey

  • Strategic pivot toward cold and customized beverage platforms is the driving factor this market.

The Commercial Beverage Blender market vendors should focus on grabbing business opportunities from the End-user segment as it accounted for the largest market share in the base year.