Commercial Large Format Display Signage Market Analysis, Size, and Forecast 2026-2030: North America (US, Canada, and Mexico), APAC (China, Japan, and India), Europe (Germany, UK, and France), Middle East and Africa (Saudi Arabia, UAE, and South Africa), South America (Brazil and Argentina), and Rest of World (ROW)

Commercial Large Format Display Signage Market Analysis, Size, and Forecast 2026-2030:
North America (US, Canada, and Mexico), APAC (China, Japan, and India), Europe (Germany, UK, and France), Middle East and Africa (Saudi Arabia, UAE, and South Africa), South America (Brazil and Argentina), and Rest of World (ROW)

Published: Apr 2026 298 Pages SKU: IRTNTR40216

Market Overview at a Glance

$2.91 B
Market Opportunity
4.5%
CAGR 2025 - 2030
43.3%
North America Growth
$7.57 B
Indoor segment 2024

Commercial Large Format Display Signage Market Size 2026-2030

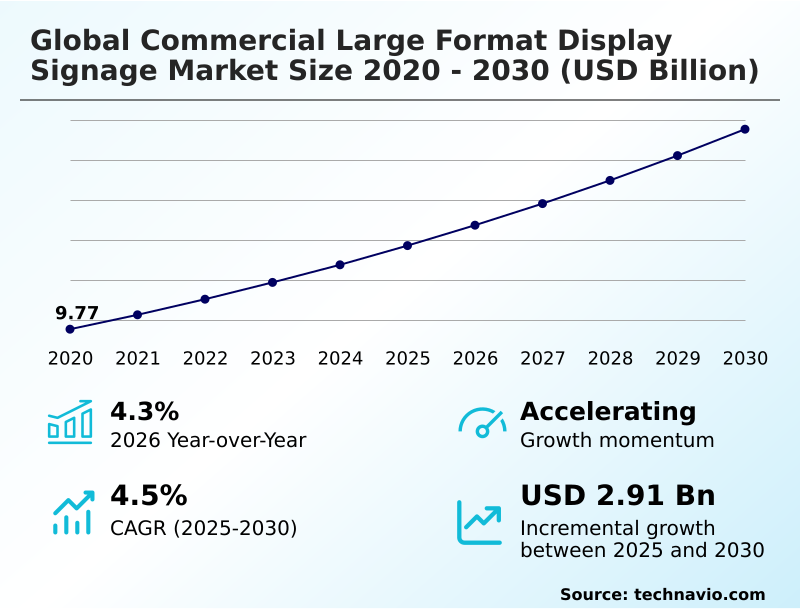
The commercial large format display signage market size is valued to increase by USD 2.91 billion, at a CAGR of 4.5% from 2025 to 2030. Expansion of retail and hospitality industries will drive the commercial large format display signage market.

Major Market Trends & Insights

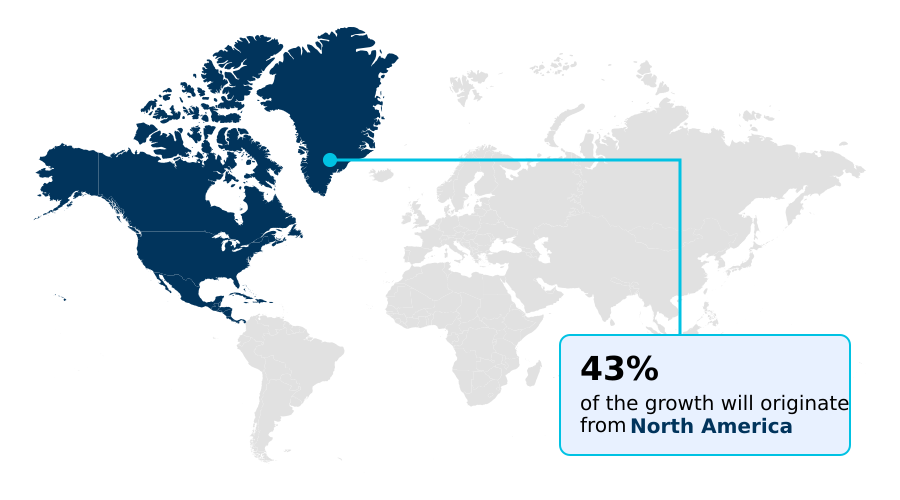
  • North America dominated the market and accounted for a 43.3% growth during the forecast period.
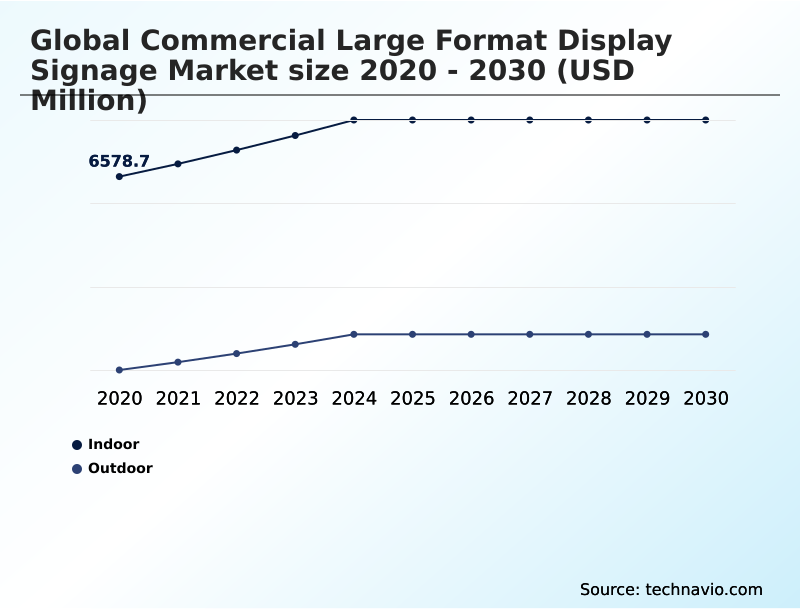
  • By Application - Indoor segment was valued at USD 7.57 billion in 2024
  • By Display Type - Standalone displays segment accounted for the largest market revenue share in 2024

Market Size & Forecast

  • Market Opportunities: USD 5.01 billion
  • Market Future Opportunities: USD 2.91 billion
  • CAGR from 2025 to 2030 : 4.5%

Market Summary

  • The commercial large format display signage market is undergoing a significant transformation, driven by the convergence of advanced display technologies and intelligent software. Businesses are moving beyond static advertising to deploy dynamic visual communication networks that enhance customer engagement and streamline operations.
  • In the retail sector, for instance, deploying interactive displays with real-time data integration allows for dynamic pricing and inventory-driven promotions, improving sales conversion. This shift is supported by falling hardware costs and the rise of cloud-based content management, which simplifies the administration of large, geographically dispersed display networks.
  • The adoption of high-resolution 4K and 8K displays, coupled with technologies like fine-pitch LED, is enabling more immersive and visually impactful experiences in environments ranging from corporate lobbies to public transit hubs. However, the complexity of content creation and software integration remains a key consideration for organizations aiming to maximize their return on investment.
  • The focus is increasingly on creating cohesive ecosystems where hardware, software, and content work seamlessly to deliver measurable business outcomes.

What will be the Size of the Commercial Large Format Display Signage Market during the forecast period?

Get Key Insights on Market Forecast (PDF) Request Free Sample

How is the Commercial Large Format Display Signage Market Segmented?

The commercial large format display signage industry research report provides comprehensive data (region-wise segment analysis), with forecasts and estimates in "USD million" for the period 2026-2030, as well as historical data from 2020-2024 for the following segments.

  • Application
    • Indoor
    • Outdoor
  • Display type
    • Standalone displays
    • Video walls
    • Interactive displays
  • Technology
    • LED displays
    • LCD displays
    • OLED displays
  • Geography
    • North America
      • US
      • Canada
      • Mexico
    • APAC
      • China
      • Japan
      • India
    • Europe
      • Germany
      • UK
      • France
    • Middle East and Africa
      • Saudi Arabia
      • UAE
      • South Africa
    • South America
      • Brazil
      • Argentina
    • Rest of World (ROW)

By Application Insights

The indoor segment is estimated to witness significant growth during the forecast period.

The indoor segment is a cornerstone for modern communication, characterized by high pixel density and superior color accuracy. In corporate settings, these systems serve as high-tech presentation tools and hubs for corporate communication platforms, replacing traditional projectors.

Retailers leverage indoor signage for immersive brand storytelling and wayfinding and directory services. The demand for aesthetically pleasing hardware has driven the adoption of ultra-thin and seamless direct-view LED solutions.

Recent innovations include integrated system-on-chip designs and micro-LED display technology, enabling superior performance. With dynamic content scheduling and audience analytics with AI, businesses can achieve a 15% increase in customer engagement.

This move toward intelligent, high-performance hardware, including interactive touch screen technology, is central to enhancing user experience and operational efficiency in controlled environments.

Request Free Sample

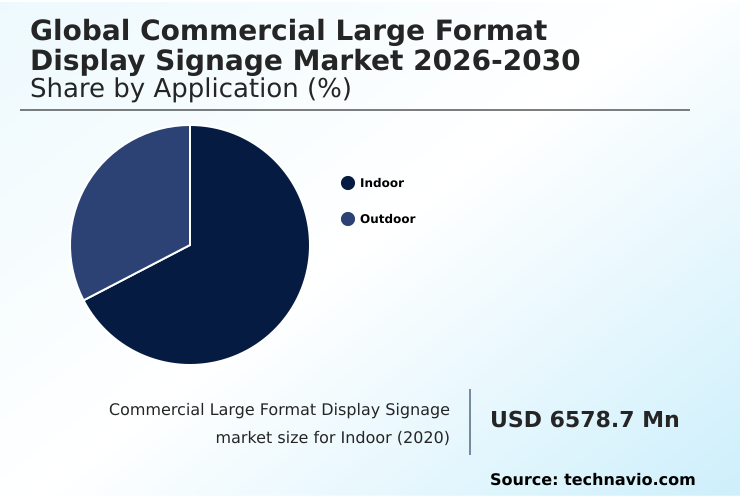
The Indoor segment was valued at USD 7.57 billion in 2024 and showed a gradual increase during the forecast period.

Request Free Sample

Regional Analysis

North America is estimated to contribute 43.3% to the growth of the global market during the forecast period.Technavio’s analysts have elaborately explained the regional trends and drivers that shape the market during the forecast period.

See How Commercial Large Format Display Signage Market Demand is Rising in North America Request Free Sample

The geographic landscape is marked by diverse adoption drivers and technological priorities.

In mature markets, there is a strong push towards upgrading legacy systems with hardware featuring advanced thermal management systems, pixel sharing technology, and high refresh rate panels to meet stringent energy standards; this has led to a 12% reduction in operational power consumption in recent deployments.

Meanwhile, emerging economies are focusing on building new digital infrastructure, prioritizing ruggedized display housings and ambient light sensors for durability. Across all regions, the adoption of web-based analytics dashboards for remote network monitoring is standardizing operational oversight.

This is coupled with a focus on automated brightness controls and blue light filter technology to address both energy and wellness concerns, with systems now achieving 99% compliance with local light pollution ordinances.

Market Dynamics

Our researchers analyzed the data with 2025 as the base year, along with the key drivers, trends, and challenges. A holistic analysis of drivers will help companies refine their marketing strategies to gain a competitive advantage.

  • Successfully navigating the commercial large format display signage market requires a focus on several key operational and strategic areas. Businesses are increasingly evaluating the ROI calculation for digital signage investment, moving beyond initial costs to long-term value.
  • A crucial aspect of this is achieving color accuracy in commercial displays, which is vital for brand consistency in visual communication in modern retail spaces. The technical challenge of content creation for non-standard aspect ratios is being addressed through more flexible software.
  • For large-scale deployments, such as deploying digital signage in hospitality sector, cloud-based management for large signage networks is essential for efficiency. This is also true for video wall solutions for security control rooms, which demand flawless reliability. The seamless integration of displays in architecture is a growing trend, requiring collaboration between tech providers and designers.
  • Furthermore, software integration for real-time data feeds enables dynamic content, while implementing predictive maintenance for displays, which is proven to reduce downtime by over 30% compared to reactive repairs, ensures operational continuity. Managing content across a global display network requires robust platforms, while AI-powered audience engagement metrics provide the data to justify these systems.
  • Concurrently, there is a push for sustainable and energy-efficient display operations, including reducing light pollution from digital billboards. High-impact 3D anamorphic advertising content is becoming a key differentiator.
  • Firms are also focused on upgrading legacy signage to digital systems, deploying durable outdoor displays for public transit, using fine-pitch LED for corporate lobby installations, and securing interactive displays for collaborative workspaces with biometric security for interactive kiosks.

What are the key market drivers leading to the rise in the adoption of Commercial Large Format Display Signage Industry?

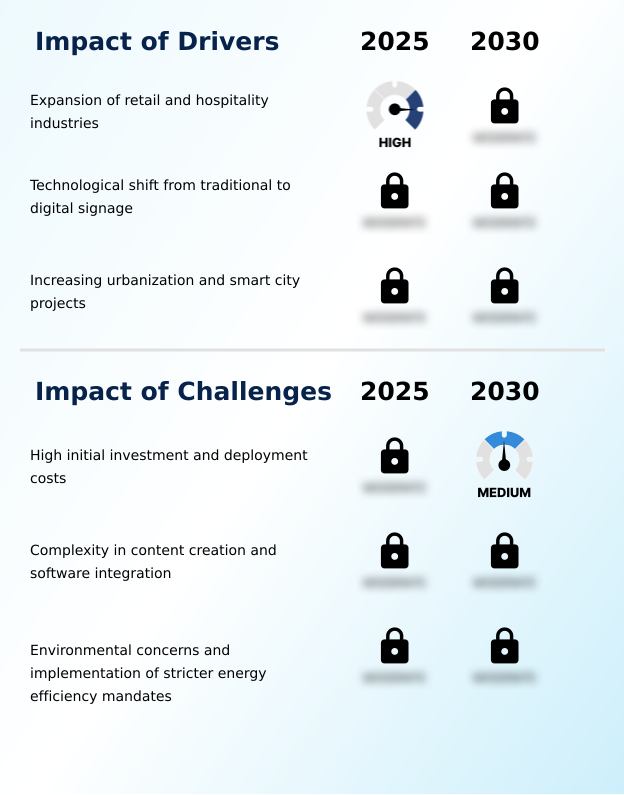
  • The expansion of the retail and hospitality industries serves as a key driver for the commercial large format display signage market.

  • Market growth is significantly driven by the expansion of experiential retail environments and the modernization of corporate communication platforms. The demand for modular display cabinet design and advanced cooling systems is rising as businesses install large, high-performance systems.
  • The adoption of digital menu board systems and public information dissemination tools in the hospitality and transport sectors is accelerating, fueled by the need for real-time updates; this has shown to reduce perceived wait times by up to 30%.
  • Furthermore, the falling costs of hardware, including components enabling cognitive processor integration, makes the technology more accessible. This allows for sophisticated control room visualization and data-driven content delivery.
  • The strategic use of power supply unit efficiency and predictive maintenance sensors helps justify initial investments by lowering total cost of ownership by an average of 20% over a five-year period.

What are the market trends shaping the Commercial Large Format Display Signage Industry?

  • The infusion of artificial intelligence into the digital signage ecosystem is a transformative market trend. This evolution enables hyper-personalized and data-driven content delivery to audiences.

  • Key trends are shaping a more intelligent and immersive visual landscape. The rise of anamorphic illusion optics is creating high-impact experiences, with adoption in flagship retail leading to a reported 40% increase in social media mentions. This is complemented by the refinement of 8K UHD display panels and seamless direct-view LED technology, which are becoming standard for premium indoor installations.
  • The integration of gesture-controlled user interfaces and smart city infrastructure integration transforms public displays from passive screens into interactive community assets. We are also seeing a proliferation of 4K resolution professional displays equipped with computer vision-based personalization, improving ad relevance significantly.
  • These trends are supported by the growing accessibility of high-brightness outdoor displays and IP66-rated protective housing, making dynamic digital-out-of-home advertising more viable, with some networks reporting a 25% higher ad recall than static billboards.

What challenges does the Commercial Large Format Display Signage Industry face during its growth?

  • High initial investment and deployment costs present a key challenge affecting the industry's growth trajectory.

  • Despite strong drivers, the market faces challenges related to complexity and cost. The high initial investment for technologies like crystal LED display systems and QLED 4K signage displays remains a barrier for smaller businesses. Integrating systems with augmented reality compatibility and biometric security integration requires specialized expertise, with implementation times being 50% longer than standard setups.
  • The need for sophisticated software-defined visual networking and multi-factor authentication protocols adds another layer of operational complexity. Moreover, the shift to centralized content distribution requires robust IT infrastructure. Many organizations struggle with the transition, finding that without proper planning, the total cost of ownership can be 25% higher than anticipated due to unforeseen software licensing and maintenance fees.
  • The lack of standardization in ultra stretch displays and OLED signage panels further complicates multi-vendor deployments.

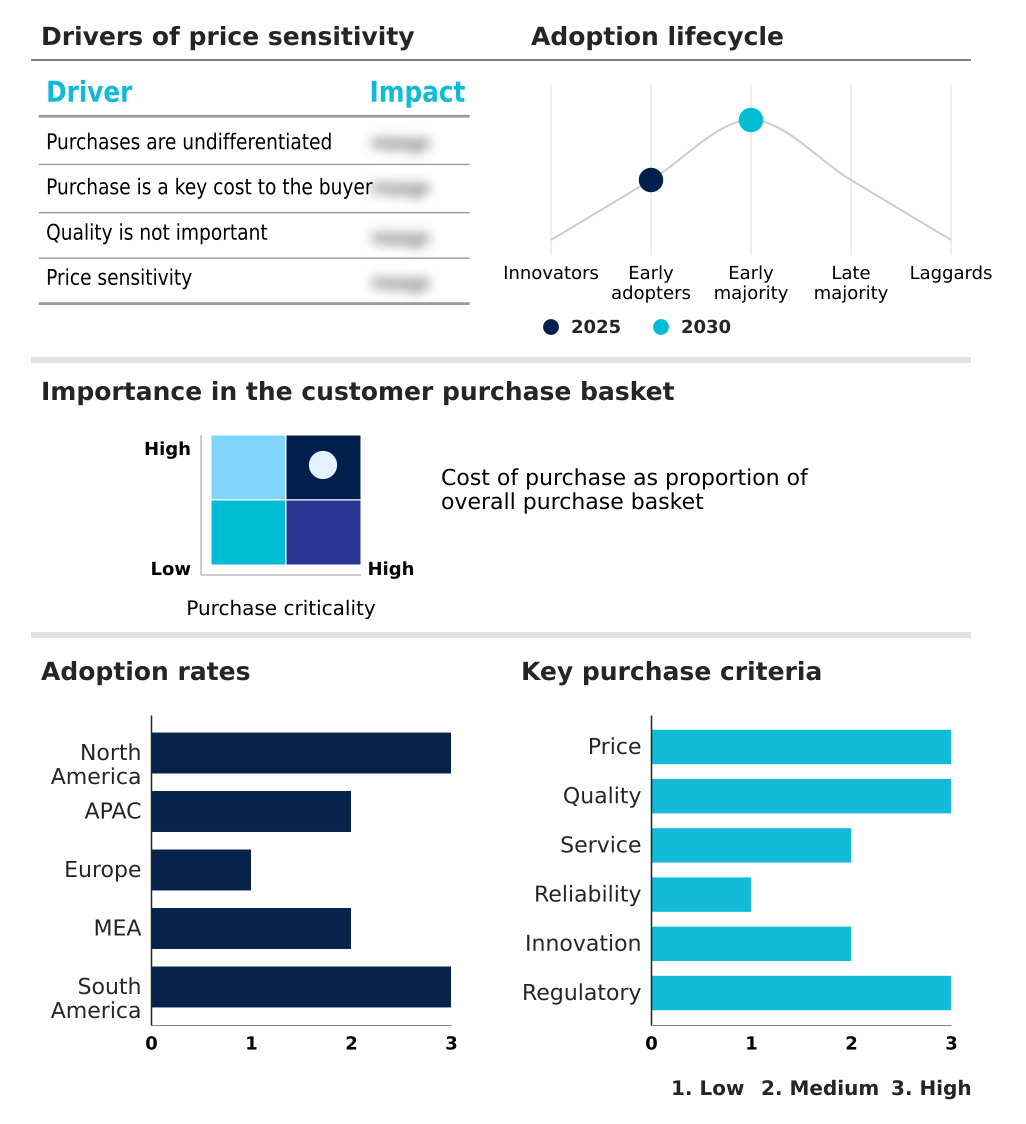
Exclusive Technavio Analysis on Customer Landscape

The commercial large format display signage market forecasting report includes the adoption lifecycle of the market, covering from the innovator’s stage to the laggard’s stage. It focuses on adoption rates in different regions based on penetration. Furthermore, the commercial large format display signage market report also includes key purchase criteria and drivers of price sensitivity to help companies evaluate and develop their market growth analysis strategies.

Customer Landscape of Commercial Large Format Display Signage Industry

Competitive Landscape

Companies are implementing various strategies, such as strategic alliances, commercial large format display signage market forecast, partnerships, mergers and acquisitions, geographical expansion, and product/service launches, to enhance their presence in the industry.

22Miles Inc. - Offerings include advanced digital signage solutions, from high-resolution video walls and interactive displays to comprehensive cloud-based content management systems for diverse commercial applications.

The industry research and growth report includes detailed analyses of the competitive landscape of the market and information about key companies, including:

  • 22Miles Inc.
  • Assured Signage
  • AUO Corp.
  • Axiomtek Co. Ltd.
  • Barco NV
  • Daktronics Inc.
  • Delta Electronics Inc.
  • Hisense International Co. Ltd.
  • Hyundai Technology Inc.
  • Koninklijke Philips NV
  • LG Electronics Inc.
  • Mitsubishi Electric Corp.
  • Panasonic Holdings Corp.
  • Planar Systems Inc.
  • Samsung Electronics Co. Ltd.
  • Sharp Corp.
  • Sony Group Corp.
  • TCL Industries Holdings Ltd.
  • VTRON Technologies
  • Zoom Digital Signage

Qualitative and quantitative analysis of companies has been conducted to help clients understand the wider business environment as well as the strengths and weaknesses of key industry players. Data is qualitatively analyzed to categorize companies as pure play, category-focused, industry-focused, and diversified; it is quantitatively analyzed to categorize companies as dominant, leading, strong, tentative, and weak.

Recent Development and News in Commercial large format display signage market

  • In March, 2025, LG Business Solutions unveiled its latest high brightness outdoor LED series designed for stadium and arena applications, featuring a proprietary IP66 rated protective layer that ensures full functionality even during severe storm events.
  • In August, 2025, Sharp NEC Display Solutions introduced its next generation of standalone high definition panels featuring an integrated Raspberry Pi compute module that allows for easy content synchronization across multiple sites via a secure web portal.
  • In October, 2025, Elo Touch Solutions launched its latest line of high performance interactive digital signage screens featuring an integrated facial recognition module for secure employee logins and personalized customer loyalty interactions.
  • In January, 2025, Samsung Electronics announced the installation of its newest high resolution micro LED wall in a major international airport terminal, featuring advanced modular design that allows for nearly invisible seams and providing a continuous visual canvas.

Dive into Technavio’s robust research methodology, blending expert interviews, extensive data synthesis, and validated models for unparalleled Commercial Large Format Display Signage Market insights. See full methodology.

Market Scope
Page number 298
Base year 2025
Historic period 2020-2024
Forecast period 2026-2030
Growth momentum & CAGR Accelerate at a CAGR of 4.5%
Market growth 2026-2030 USD 2909.8 million
Market structure Fragmented
YoY growth 2025-2026(%) 4.3%
Key countries US, Canada, Mexico, China, Japan, India, South Korea, Australia, Indonesia, Germany, UK, France, Italy, Spain, The Netherlands, Saudi Arabia, UAE, South Africa, Turkey, Israel, Brazil, Argentina and Chile
Competitive landscape Leading Companies, Market Positioning of Companies, Competitive Strategies, and Industry Risks

Request Free Sample

Research Analyst Overview

  • The commercial large format display signage market's evolution is defined by the integration of highly specialized hardware components. Core advancements are seen in micro-LED display technology, fine-pitch LED video walls, and transparent OLED panels, which offer unparalleled visual fidelity. For mainstream applications, ultra-narrow bezel LCD and commercial LCD panels remain crucial, often enhanced with anti-glare panel coatings and GOB surface protection.
  • Durability is a key focus, addressed by IP66-rated protective housing, advanced cooling systems, and ruggedized display housings. Performance is elevated through cognitive processor integration, high refresh rate panels, and integrated system-on-chip designs, with some systems using a Raspberry Pi compute module for flexibility.
  • The user experience is enhanced with interactive touch screen technology, including multi-touch capacitive sensors and infrared touch frame overlay. The market features a range of form factors, from ultra stretch displays to curved LED display form-factors and crystal LED display systems. Innovations like QLED 4K signage displays, OLED signage panels, and 8K UHD display panels are pushing resolution boundaries.
  • Efficient operation is driven by power supply unit efficiency and thermal management systems, while modular display cabinet design and video wall controllers simplify complex installations. Smart features like predictive maintenance sensors, ambient light sensors, and blue light filter technology are becoming standard.
  • Pixel sharing technology, for example, has been shown to increase perceived resolution by up to 50% without a corresponding increase in power draw, a key boardroom consideration for balancing impact and operational expenditure.

What are the Key Data Covered in this Commercial Large Format Display Signage Market Research and Growth Report?

  • What is the expected growth of the Commercial Large Format Display Signage Market between 2026 and 2030?

    • USD 2.91 billion, at a CAGR of 4.5%

  • What segmentation does the market report cover?

    • The report is segmented by Application (Indoor, and Outdoor), Display Type (Standalone displays, Video walls, and Interactive displays), Technology (LED displays, LCD displays, and OLED displays) and Geography (North America, APAC, Europe, Middle East and Africa, South America)

  • Which regions are analyzed in the report?

    • North America, APAC, Europe, Middle East and Africa and South America

  • What are the key growth drivers and market challenges?

    • Expansion of retail and hospitality industries, High initial investment and deployment costs

  • Who are the major players in the Commercial Large Format Display Signage Market?

    • 22Miles Inc., Assured Signage, AUO Corp., Axiomtek Co. Ltd., Barco NV, Daktronics Inc., Delta Electronics Inc., Hisense International Co. Ltd., Hyundai Technology Inc., Koninklijke Philips NV, LG Electronics Inc., Mitsubishi Electric Corp., Panasonic Holdings Corp., Planar Systems Inc., Samsung Electronics Co. Ltd., Sharp Corp., Sony Group Corp., TCL Industries Holdings Ltd., VTRON Technologies and Zoom Digital Signage

Market Research Insights

  • The market's momentum is defined by a strategic shift from on-premises server management to agile, software-defined visual networking. This evolution leverages cloud-based content management and centralized content distribution, enhanced by multi-factor authentication protocols for security. In experiential retail environments, this allows for hyper-personalized advertising and immersive brand storytelling through data-driven content delivery.
  • Key to this is audience analytics with AI and computer vision-based personalization, where predictive content triggering can increase message relevance by over 30%. Applications now span from smart bus shelter displays and public information dissemination to digital concierge services and virtual meeting space integration. Control room visualization benefits from web-based analytics dashboards and remote network monitoring, improving incident response time.
  • Meanwhile, gesture-controlled user interfaces and augmented reality compatibility are transforming wayfinding and directory services and digital menu board systems within smart city infrastructure integration, creating efficient corporate communication platforms.

We can help! Our analysts can customize this commercial large format display signage market research report to meet your requirements.

Get in touch

1. Executive Summary

1.1 Market overview

Executive Summary - Chart on Market Overview
Executive Summary - Data Table on Market Overview
Executive Summary - Chart on Global Market Characteristics
Executive Summary - Chart on Market by Geography
Executive Summary - Chart on Market Segmentation by Application
Executive Summary - Chart on Market Segmentation by Display Type
Executive Summary - Chart on Market Segmentation by Technology
Executive Summary - Chart on Incremental Growth
Executive Summary - Data Table on Incremental Growth
Executive Summary - Chart on Company Market Positioning

2. Technavio Analysis

2.1 Analysis of price sensitivity, lifecycle, customer purchase basket, adoption rates, and purchase criteria

2.2 Criticality of inputs and Factors of differentiation

Chart on Overview on criticality of inputs and factors of differentiation

2.3 Factors of disruption

Chart on Overview on factors of disruption

2.4 Impact of drivers and challenges

Chart on Impact of drivers and challenges in 2025 and 2030

3. Market Landscape

3.1 Market ecosystem

Chart on Parent Market
Data Table on - Parent Market

3.2 Market characteristics

Chart on Market characteristics analysis

3.3 Value chain analysis

Chart on Value chain analysis

4. Market Sizing

4.1 Market definition

Data Table on Offerings of companies included in the market definition

4.2 Market segment analysis

Market segments

4.3 Market size 2025

4.4 Market outlook: Forecast for 2025-2030

Chart on Global - Market size and forecast 2025-2030 ($ million)
Data Table on Global - Market size and forecast 2025-2030 ($ million)
Chart on Global Market: Year-over-year growth 2025-2030 (%)
Data Table on Global Market: Year-over-year growth 2025-2030 (%)

5. Historic Market Size

5.1 Global Commercial Large Format Display Signage Market 2020 - 2024

Historic Market Size - Data Table on Global Commercial Large Format Display Signage Market 2020 - 2024 ($ million)

5.2 Application segment analysis 2020 - 2024

Historic Market Size - Application Segment 2020 - 2024 ($ million)

5.3 Display Type segment analysis 2020 - 2024

Historic Market Size - Display Type Segment 2020 - 2024 ($ million)

5.4 Technology segment analysis 2020 - 2024

Historic Market Size - Technology Segment 2020 - 2024 ($ million)

5.5 Geography segment analysis 2020 - 2024

Historic Market Size - Geography Segment 2020 - 2024 ($ million)

5.6 Country segment analysis 2020 - 2024

Historic Market Size - Country Segment 2020 - 2024 ($ million)

6. Qualitative Analysis

6.1 Impact of AI on Commercial Large Format Display Signage Market

6.2 Impact of Geopolitical Conflicts on Global Commercial Large Format Display Signage Market

7. Five Forces Analysis

7.1 Five forces summary

Five forces analysis - Comparison between 2025 and 2030

7.2 Bargaining power of buyers

Bargaining power of buyers - Impact of key factors 2025 and 2030

7.3 Bargaining power of suppliers

Bargaining power of suppliers - Impact of key factors in 2025 and 2030

7.4 Threat of new entrants

Threat of new entrants - Impact of key factors in 2025 and 2030

7.5 Threat of substitutes

Threat of substitutes - Impact of key factors in 2025 and 2030

7.6 Threat of rivalry

Threat of rivalry - Impact of key factors in 2025 and 2030

7.7 Market condition

Chart on Market condition - Five forces 2025 and 2030

8. Market Segmentation by Application

8.1 Market segments

Chart on Application - Market share 2025-2030 (%)
Data Table on Application - Market share 2025-2030 (%)

8.2 Comparison by Application

Chart on Comparison by Application
Data Table on Comparison by Application

8.3 Indoor - Market size and forecast 2025-2030

Chart on Indoor - Market size and forecast 2025-2030 ($ million)
Data Table on Indoor - Market size and forecast 2025-2030 ($ million)
Chart on Indoor - Year-over-year growth 2025-2030 (%)
Data Table on Indoor - Year-over-year growth 2025-2030 (%)

8.4 Outdoor - Market size and forecast 2025-2030

Chart on Outdoor - Market size and forecast 2025-2030 ($ million)
Data Table on Outdoor - Market size and forecast 2025-2030 ($ million)
Chart on Outdoor - Year-over-year growth 2025-2030 (%)
Data Table on Outdoor - Year-over-year growth 2025-2030 (%)

8.5 Market opportunity by Application

Market opportunity by Application ($ million)
Data Table on Market opportunity by Application ($ million)

9. Market Segmentation by Display Type

9.1 Market segments

Chart on Display Type - Market share 2025-2030 (%)
Data Table on Display Type - Market share 2025-2030 (%)

9.2 Comparison by Display Type

Chart on Comparison by Display Type
Data Table on Comparison by Display Type

9.3 Standalone displays - Market size and forecast 2025-2030

Chart on Standalone displays - Market size and forecast 2025-2030 ($ million)
Data Table on Standalone displays - Market size and forecast 2025-2030 ($ million)
Chart on Standalone displays - Year-over-year growth 2025-2030 (%)
Data Table on Standalone displays - Year-over-year growth 2025-2030 (%)

9.4 Video walls - Market size and forecast 2025-2030

Chart on Video walls - Market size and forecast 2025-2030 ($ million)
Data Table on Video walls - Market size and forecast 2025-2030 ($ million)
Chart on Video walls - Year-over-year growth 2025-2030 (%)
Data Table on Video walls - Year-over-year growth 2025-2030 (%)

9.5 Interactive displays - Market size and forecast 2025-2030

Chart on Interactive displays - Market size and forecast 2025-2030 ($ million)
Data Table on Interactive displays - Market size and forecast 2025-2030 ($ million)
Chart on Interactive displays - Year-over-year growth 2025-2030 (%)
Data Table on Interactive displays - Year-over-year growth 2025-2030 (%)

9.6 Market opportunity by Display Type

Market opportunity by Display Type ($ million)
Data Table on Market opportunity by Display Type ($ million)

10. Market Segmentation by Technology

10.1 Market segments

Chart on Technology - Market share 2025-2030 (%)
Data Table on Technology - Market share 2025-2030 (%)

10.2 Comparison by Technology

Chart on Comparison by Technology
Data Table on Comparison by Technology

10.3 LED displays - Market size and forecast 2025-2030

Chart on LED displays - Market size and forecast 2025-2030 ($ million)
Data Table on LED displays - Market size and forecast 2025-2030 ($ million)
Chart on LED displays - Year-over-year growth 2025-2030 (%)
Data Table on LED displays - Year-over-year growth 2025-2030 (%)

10.4 LCD displays - Market size and forecast 2025-2030

Chart on LCD displays - Market size and forecast 2025-2030 ($ million)
Data Table on LCD displays - Market size and forecast 2025-2030 ($ million)
Chart on LCD displays - Year-over-year growth 2025-2030 (%)
Data Table on LCD displays - Year-over-year growth 2025-2030 (%)

10.5 OLED displays - Market size and forecast 2025-2030

Chart on OLED displays - Market size and forecast 2025-2030 ($ million)
Data Table on OLED displays - Market size and forecast 2025-2030 ($ million)
Chart on OLED displays - Year-over-year growth 2025-2030 (%)
Data Table on OLED displays - Year-over-year growth 2025-2030 (%)

10.6 Market opportunity by Technology

Market opportunity by Technology ($ million)
Data Table on Market opportunity by Technology ($ million)

11. Customer Landscape

11.1 Customer landscape overview

Analysis of price sensitivity, lifecycle, customer purchase basket, adoption rates, and purchase criteria

12. Geographic Landscape

12.1 Geographic segmentation

Chart on Market share by geography 2025-2030 (%)
Data Table on Market share by geography 2025-2030 (%)

12.2 Geographic comparison

Chart on Geographic comparison
Data Table on Geographic comparison

12.3 North America - Market size and forecast 2025-2030

Chart on North America - Market size and forecast 2025-2030 ($ million)
Data Table on North America - Market size and forecast 2025-2030 ($ million)
Chart on North America - Year-over-year growth 2025-2030 (%)
Data Table on North America - Year-over-year growth 2025-2030 (%)
Chart on Regional Comparison - North America
Data Table on Regional Comparison - North America

12.3.1 US - Market size and forecast 2025-2030

Chart on US - Market size and forecast 2025-2030 ($ million)
Data Table on US - Market size and forecast 2025-2030 ($ million)
Chart on US - Year-over-year growth 2025-2030 (%)
Data Table on US - Year-over-year growth 2025-2030 (%)

12.3.2 Canada - Market size and forecast 2025-2030

Chart on Canada - Market size and forecast 2025-2030 ($ million)
Data Table on Canada - Market size and forecast 2025-2030 ($ million)
Chart on Canada - Year-over-year growth 2025-2030 (%)
Data Table on Canada - Year-over-year growth 2025-2030 (%)

12.3.3 Mexico - Market size and forecast 2025-2030

Chart on Mexico - Market size and forecast 2025-2030 ($ million)
Data Table on Mexico - Market size and forecast 2025-2030 ($ million)
Chart on Mexico - Year-over-year growth 2025-2030 (%)
Data Table on Mexico - Year-over-year growth 2025-2030 (%)

12.4 APAC - Market size and forecast 2025-2030

Chart on APAC - Market size and forecast 2025-2030 ($ million)
Data Table on APAC - Market size and forecast 2025-2030 ($ million)
Chart on APAC - Year-over-year growth 2025-2030 (%)
Data Table on APAC - Year-over-year growth 2025-2030 (%)
Chart on Regional Comparison - APAC
Data Table on Regional Comparison - APAC

12.4.1 China - Market size and forecast 2025-2030

Chart on China - Market size and forecast 2025-2030 ($ million)
Data Table on China - Market size and forecast 2025-2030 ($ million)
Chart on China - Year-over-year growth 2025-2030 (%)
Data Table on China - Year-over-year growth 2025-2030 (%)

12.4.2 Japan - Market size and forecast 2025-2030

Chart on Japan - Market size and forecast 2025-2030 ($ million)
Data Table on Japan - Market size and forecast 2025-2030 ($ million)
Chart on Japan - Year-over-year growth 2025-2030 (%)
Data Table on Japan - Year-over-year growth 2025-2030 (%)

12.4.3 India - Market size and forecast 2025-2030

Chart on India - Market size and forecast 2025-2030 ($ million)
Data Table on India - Market size and forecast 2025-2030 ($ million)
Chart on India - Year-over-year growth 2025-2030 (%)
Data Table on India - Year-over-year growth 2025-2030 (%)

12.4.4 South Korea - Market size and forecast 2025-2030

Chart on South Korea - Market size and forecast 2025-2030 ($ million)
Data Table on South Korea - Market size and forecast 2025-2030 ($ million)
Chart on South Korea - Year-over-year growth 2025-2030 (%)
Data Table on South Korea - Year-over-year growth 2025-2030 (%)

12.4.5 Australia - Market size and forecast 2025-2030

Chart on Australia - Market size and forecast 2025-2030 ($ million)
Data Table on Australia - Market size and forecast 2025-2030 ($ million)
Chart on Australia - Year-over-year growth 2025-2030 (%)
Data Table on Australia - Year-over-year growth 2025-2030 (%)

12.4.6 Indonesia - Market size and forecast 2025-2030

Chart on Indonesia - Market size and forecast 2025-2030 ($ million)
Data Table on Indonesia - Market size and forecast 2025-2030 ($ million)
Chart on Indonesia - Year-over-year growth 2025-2030 (%)
Data Table on Indonesia - Year-over-year growth 2025-2030 (%)

12.5 Europe - Market size and forecast 2025-2030

Chart on Europe - Market size and forecast 2025-2030 ($ million)
Data Table on Europe - Market size and forecast 2025-2030 ($ million)
Chart on Europe - Year-over-year growth 2025-2030 (%)
Data Table on Europe - Year-over-year growth 2025-2030 (%)
Chart on Regional Comparison - Europe
Data Table on Regional Comparison - Europe

12.5.1 Germany - Market size and forecast 2025-2030

Chart on Germany - Market size and forecast 2025-2030 ($ million)
Data Table on Germany - Market size and forecast 2025-2030 ($ million)
Chart on Germany - Year-over-year growth 2025-2030 (%)
Data Table on Germany - Year-over-year growth 2025-2030 (%)

12.5.2 UK - Market size and forecast 2025-2030

Chart on UK - Market size and forecast 2025-2030 ($ million)
Data Table on UK - Market size and forecast 2025-2030 ($ million)
Chart on UK - Year-over-year growth 2025-2030 (%)
Data Table on UK - Year-over-year growth 2025-2030 (%)

12.5.3 France - Market size and forecast 2025-2030

Chart on France - Market size and forecast 2025-2030 ($ million)
Data Table on France - Market size and forecast 2025-2030 ($ million)
Chart on France - Year-over-year growth 2025-2030 (%)
Data Table on France - Year-over-year growth 2025-2030 (%)

12.5.4 Italy - Market size and forecast 2025-2030

Chart on Italy - Market size and forecast 2025-2030 ($ million)
Data Table on Italy - Market size and forecast 2025-2030 ($ million)
Chart on Italy - Year-over-year growth 2025-2030 (%)
Data Table on Italy - Year-over-year growth 2025-2030 (%)

12.5.5 Spain - Market size and forecast 2025-2030

Chart on Spain - Market size and forecast 2025-2030 ($ million)
Data Table on Spain - Market size and forecast 2025-2030 ($ million)
Chart on Spain - Year-over-year growth 2025-2030 (%)
Data Table on Spain - Year-over-year growth 2025-2030 (%)

12.5.6 The Netherlands - Market size and forecast 2025-2030

Chart on The Netherlands - Market size and forecast 2025-2030 ($ million)
Data Table on The Netherlands - Market size and forecast 2025-2030 ($ million)
Chart on The Netherlands - Year-over-year growth 2025-2030 (%)
Data Table on The Netherlands - Year-over-year growth 2025-2030 (%)

12.6 Middle East and Africa - Market size and forecast 2025-2030

Chart on Middle East and Africa - Market size and forecast 2025-2030 ($ million)
Data Table on Middle East and Africa - Market size and forecast 2025-2030 ($ million)
Chart on Middle East and Africa - Year-over-year growth 2025-2030 (%)
Data Table on Middle East and Africa - Year-over-year growth 2025-2030 (%)
Chart on Regional Comparison - Middle East and Africa
Data Table on Regional Comparison - Middle East and Africa

12.6.1 Saudi Arabia - Market size and forecast 2025-2030

Chart on Saudi Arabia - Market size and forecast 2025-2030 ($ million)
Data Table on Saudi Arabia - Market size and forecast 2025-2030 ($ million)
Chart on Saudi Arabia - Year-over-year growth 2025-2030 (%)
Data Table on Saudi Arabia - Year-over-year growth 2025-2030 (%)

12.6.2 UAE - Market size and forecast 2025-2030

Chart on UAE - Market size and forecast 2025-2030 ($ million)
Data Table on UAE - Market size and forecast 2025-2030 ($ million)
Chart on UAE - Year-over-year growth 2025-2030 (%)
Data Table on UAE - Year-over-year growth 2025-2030 (%)

12.6.3 South Africa - Market size and forecast 2025-2030

Chart on South Africa - Market size and forecast 2025-2030 ($ million)
Data Table on South Africa - Market size and forecast 2025-2030 ($ million)
Chart on South Africa - Year-over-year growth 2025-2030 (%)
Data Table on South Africa - Year-over-year growth 2025-2030 (%)

12.6.4 Turkey - Market size and forecast 2025-2030

Chart on Turkey - Market size and forecast 2025-2030 ($ million)
Data Table on Turkey - Market size and forecast 2025-2030 ($ million)
Chart on Turkey - Year-over-year growth 2025-2030 (%)
Data Table on Turkey - Year-over-year growth 2025-2030 (%)

12.6.5 Israel - Market size and forecast 2025-2030

Chart on Israel - Market size and forecast 2025-2030 ($ million)
Data Table on Israel - Market size and forecast 2025-2030 ($ million)
Chart on Israel - Year-over-year growth 2025-2030 (%)
Data Table on Israel - Year-over-year growth 2025-2030 (%)

12.7 South America - Market size and forecast 2025-2030

Chart on South America - Market size and forecast 2025-2030 ($ million)
Data Table on South America - Market size and forecast 2025-2030 ($ million)
Chart on South America - Year-over-year growth 2025-2030 (%)
Data Table on South America - Year-over-year growth 2025-2030 (%)
Chart on Regional Comparison - South America
Data Table on Regional Comparison - South America

12.7.1 Brazil - Market size and forecast 2025-2030

Chart on Brazil - Market size and forecast 2025-2030 ($ million)
Data Table on Brazil - Market size and forecast 2025-2030 ($ million)
Chart on Brazil - Year-over-year growth 2025-2030 (%)
Data Table on Brazil - Year-over-year growth 2025-2030 (%)

12.7.2 Argentina - Market size and forecast 2025-2030

Chart on Argentina - Market size and forecast 2025-2030 ($ million)
Data Table on Argentina - Market size and forecast 2025-2030 ($ million)
Chart on Argentina - Year-over-year growth 2025-2030 (%)
Data Table on Argentina - Year-over-year growth 2025-2030 (%)

12.7.3 Chile - Market size and forecast 2025-2030

Chart on Chile - Market size and forecast 2025-2030 ($ million)
Data Table on Chile - Market size and forecast 2025-2030 ($ million)
Chart on Chile - Year-over-year growth 2025-2030 (%)
Data Table on Chile - Year-over-year growth 2025-2030 (%)

12.8 Market opportunity by geography

Market opportunity by geography ($ million)
Data Tables on Market opportunity by geography ($ million)

13. Drivers, Challenges, and Opportunity

13.1 Market drivers

Expansion of retail and hospitality industries
Technological shift from traditional to digital signage
Increasing urbanization and smart city projects

13.2 Market challenges

High initial investment and deployment costs
Complexity in content creation and software integration
Environmental concerns and implementation of stricter energy efficiency mandates

13.3 Impact of drivers and challenges

Impact of drivers and challenges in 2025 and 2030

13.4 Market opportunities

Infusion of artificial intelligence into digital signage ecosystem
Growth of 3D anamorphic and immersive visual content
Adoption of cloud based and remote management systems

14. Competitive Landscape

14.1 Overview

14.2

Overview on criticality of inputs and factors of differentiation

14.3 Landscape disruption

Overview on factors of disruption

14.4 Industry risks

Impact of key risks on business

15. Competitive Analysis

15.1 Companies profiled

Companies covered

15.2 Company ranking index

15.3 Market positioning of companies

Matrix on companies position and classification

15.4 AUO Corp.

AUO Corp. - Overview
AUO Corp. - Business segments
AUO Corp. - Key news
AUO Corp. - Key offerings
AUO Corp. - Segment focus
SWOT

15.5 Axiomtek Co. Ltd.

Axiomtek Co. Ltd. - Overview
Axiomtek Co. Ltd. - Business segments
Axiomtek Co. Ltd. - Key offerings
Axiomtek Co. Ltd. - Segment focus
SWOT

15.6 Barco NV

Barco NV - Overview
Barco NV - Business segments
Barco NV - Key news
Barco NV - Key offerings
Barco NV - Segment focus
SWOT

15.7 Daktronics Inc.

Daktronics Inc. - Overview
Daktronics Inc. - Business segments
Daktronics Inc. - Key offerings
Daktronics Inc. - Segment focus
SWOT

15.8 Delta Electronics Inc.

Delta Electronics Inc. - Overview
Delta Electronics Inc. - Business segments
Delta Electronics Inc. - Key news
Delta Electronics Inc. - Key offerings
Delta Electronics Inc. - Segment focus
SWOT

15.9 Hisense International Co. Ltd.

Hisense International Co. Ltd. - Overview
Hisense International Co. Ltd. - Product / Service
Hisense International Co. Ltd. - Key offerings
SWOT

15.10 Koninklijke Philips NV

Koninklijke Philips NV - Overview
Koninklijke Philips NV - Business segments
Koninklijke Philips NV - Key news
Koninklijke Philips NV - Key offerings
Koninklijke Philips NV - Segment focus
SWOT

15.11 LG Electronics Inc.

LG Electronics Inc. - Overview
LG Electronics Inc. - Business segments
LG Electronics Inc. - Key offerings
LG Electronics Inc. - Segment focus
SWOT

15.12 Mitsubishi Electric Corp.

Mitsubishi Electric Corp. - Overview
Mitsubishi Electric Corp. - Business segments
Mitsubishi Electric Corp. - Key offerings
Mitsubishi Electric Corp. - Segment focus
SWOT

15.13 Panasonic Holdings Corp.

Panasonic Holdings Corp. - Overview
Panasonic Holdings Corp. - Business segments
Panasonic Holdings Corp. - Key news
Panasonic Holdings Corp. - Key offerings
Panasonic Holdings Corp. - Segment focus
SWOT

15.14 Planar Systems Inc.

Planar Systems Inc. - Overview
Planar Systems Inc. - Product / Service
Planar Systems Inc. - Key offerings
SWOT

15.15 Samsung Electronics Co. Ltd.

Samsung Electronics Co. Ltd. - Overview
Samsung Electronics Co. Ltd. - Business segments
Samsung Electronics Co. Ltd. - Key news
Samsung Electronics Co. Ltd. - Key offerings
Samsung Electronics Co. Ltd. - Segment focus
SWOT

15.16 Sharp Corp.

Sharp Corp. - Overview
Sharp Corp. - Business segments
Sharp Corp. - Key offerings
Sharp Corp. - Segment focus
SWOT

15.17 Sony Group Corp.

Sony Group Corp. - Overview
Sony Group Corp. - Business segments
Sony Group Corp. - Key news
Sony Group Corp. - Key offerings
Sony Group Corp. - Segment focus
SWOT

15.18 TCL Industries Holdings Ltd.

TCL Industries Holdings Ltd. - Overview
TCL Industries Holdings Ltd. - Business segments
TCL Industries Holdings Ltd. - Key news
TCL Industries Holdings Ltd. - Key offerings
TCL Industries Holdings Ltd. - Segment focus
SWOT

16. Appendix

16.1 Scope of the report

Market definition
Objectives
Notes and caveats

16.2 Inclusions and exclusions checklist

Inclusions checklist
Exclusions checklist

16.3 Currency conversion rates for US$

16.4 Research methodology

16.5 Data procurement

Information sources

16.6 Data validation

16.7 Validation techniques employed for market sizing

16.8 Data synthesis

16.9 360 degree market analysis

16.10 List of abbreviations

Research Methodology

Technavio presents a detailed picture of the market by way of study, synthesis, and summation of data from multiple sources. The analysts have presented the various facets of the market with a particular focus on identifying the key industry influencers. The data thus presented is comprehensive, reliable, and the result of extensive research, both primary and secondary.

INFORMATION SOURCES

Primary sources

  • Manufacturers and suppliers
  • Channel partners
  • Industry experts
  • Strategic decision makers

Secondary sources

  • Industry journals and periodicals
  • Government data
  • Financial reports of key industry players
  • Historical data
  • Press releases

DATA ANALYSIS

Data Synthesis

  • Collation of data
  • Estimation of key figures
  • Analysis of derived insights

Data Validation

  • Triangulation with data models
  • Reference against proprietary databases
  • Corroboration with industry experts

REPORT WRITING

Qualitative

  • Market drivers
  • Market challenges
  • Market trends
  • Five forces analysis

Quantitative

  • Market size and forecast
  • Market segmentation
  • Geographical insights
  • Competitive landscape

Interested in this report?

Get your sample now to see our research methodology and insights!

Download Now

Frequently Asked Questions

Commercial Large Format Display Signage market growth will increase by USD 2909.8 million during 2026-2030.

The Commercial Large Format Display Signage market is expected to grow at a CAGR of 4.5% during 2026-2030.

Commercial Large Format Display Signage market is segmented by Application (Indoor, Outdoor) Display type (Standalone displays, Video walls, Interactive displays) Technology (LED displays, LCD displays, OLED displays)

22Miles Inc., Assured Signage, AUO Corp., Axiomtek Co. Ltd., Barco NV, Daktronics Inc., Delta Electronics Inc., Hisense International Co. Ltd., Hyundai Technology Inc., Koninklijke Philips NV, LG Electronics Inc., Mitsubishi Electric Corp., Panasonic Holdings Corp., Planar Systems Inc., Samsung Electronics Co. Ltd., Sharp Corp., Sony Group Corp., TCL Industries Holdings Ltd., VTRON Technologies, Zoom Digital Signage are a few of the key vendors in the Commercial Large Format Display Signage market.

North America will register the highest growth rate of 43.3% among the other regions. Therefore, the Commercial Large Format Display Signage market in North America is expected to garner significant business opportunities for the vendors during the forecast period.

US, Canada, Mexico, China, Japan, India, South Korea, Australia, Indonesia, Germany, UK, France, Italy, Spain, The Netherlands, Saudi Arabia, UAE, South Africa, Turkey, Israel, Brazil, Argentina, Chile

  • Expansion of retail and hospitality industries is the driving factor this market.

The Commercial Large Format Display Signage market vendors should focus on grabbing business opportunities from the Application segment as it accounted for the largest market share in the base year.
RIA - Research AI Assistant
Ask RIA